| Tissue | Expression Dynamics | Abbreviation |
| Colorectum (GSE201348) |  | FAP: Familial adenomatous polyposis |
| CRC: Colorectal cancer |
| Colorectum (HTA11) | 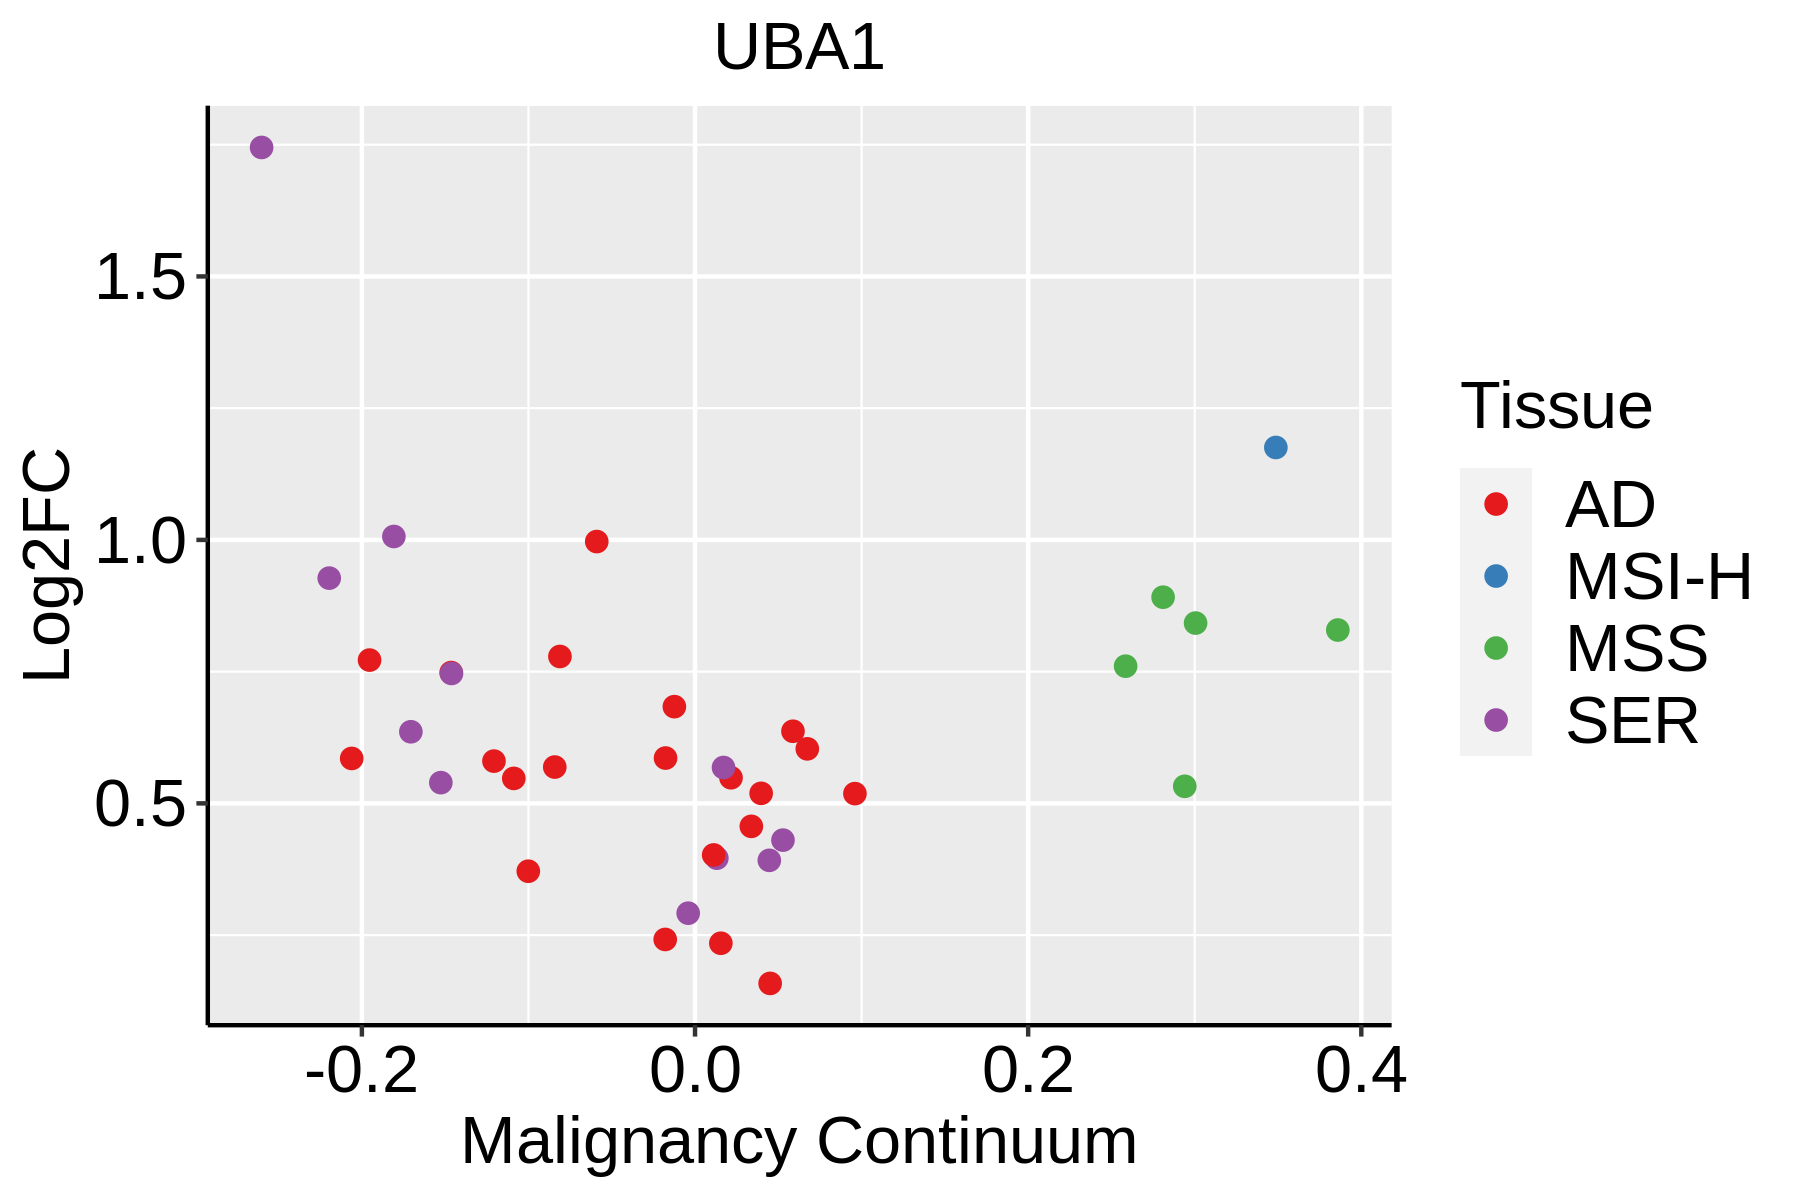 | AD: Adenomas |
| SER: Sessile serrated lesions |
| MSI-H: Microsatellite-high colorectal cancer |
| MSS: Microsatellite stable colorectal cancer |
| Esophagus | 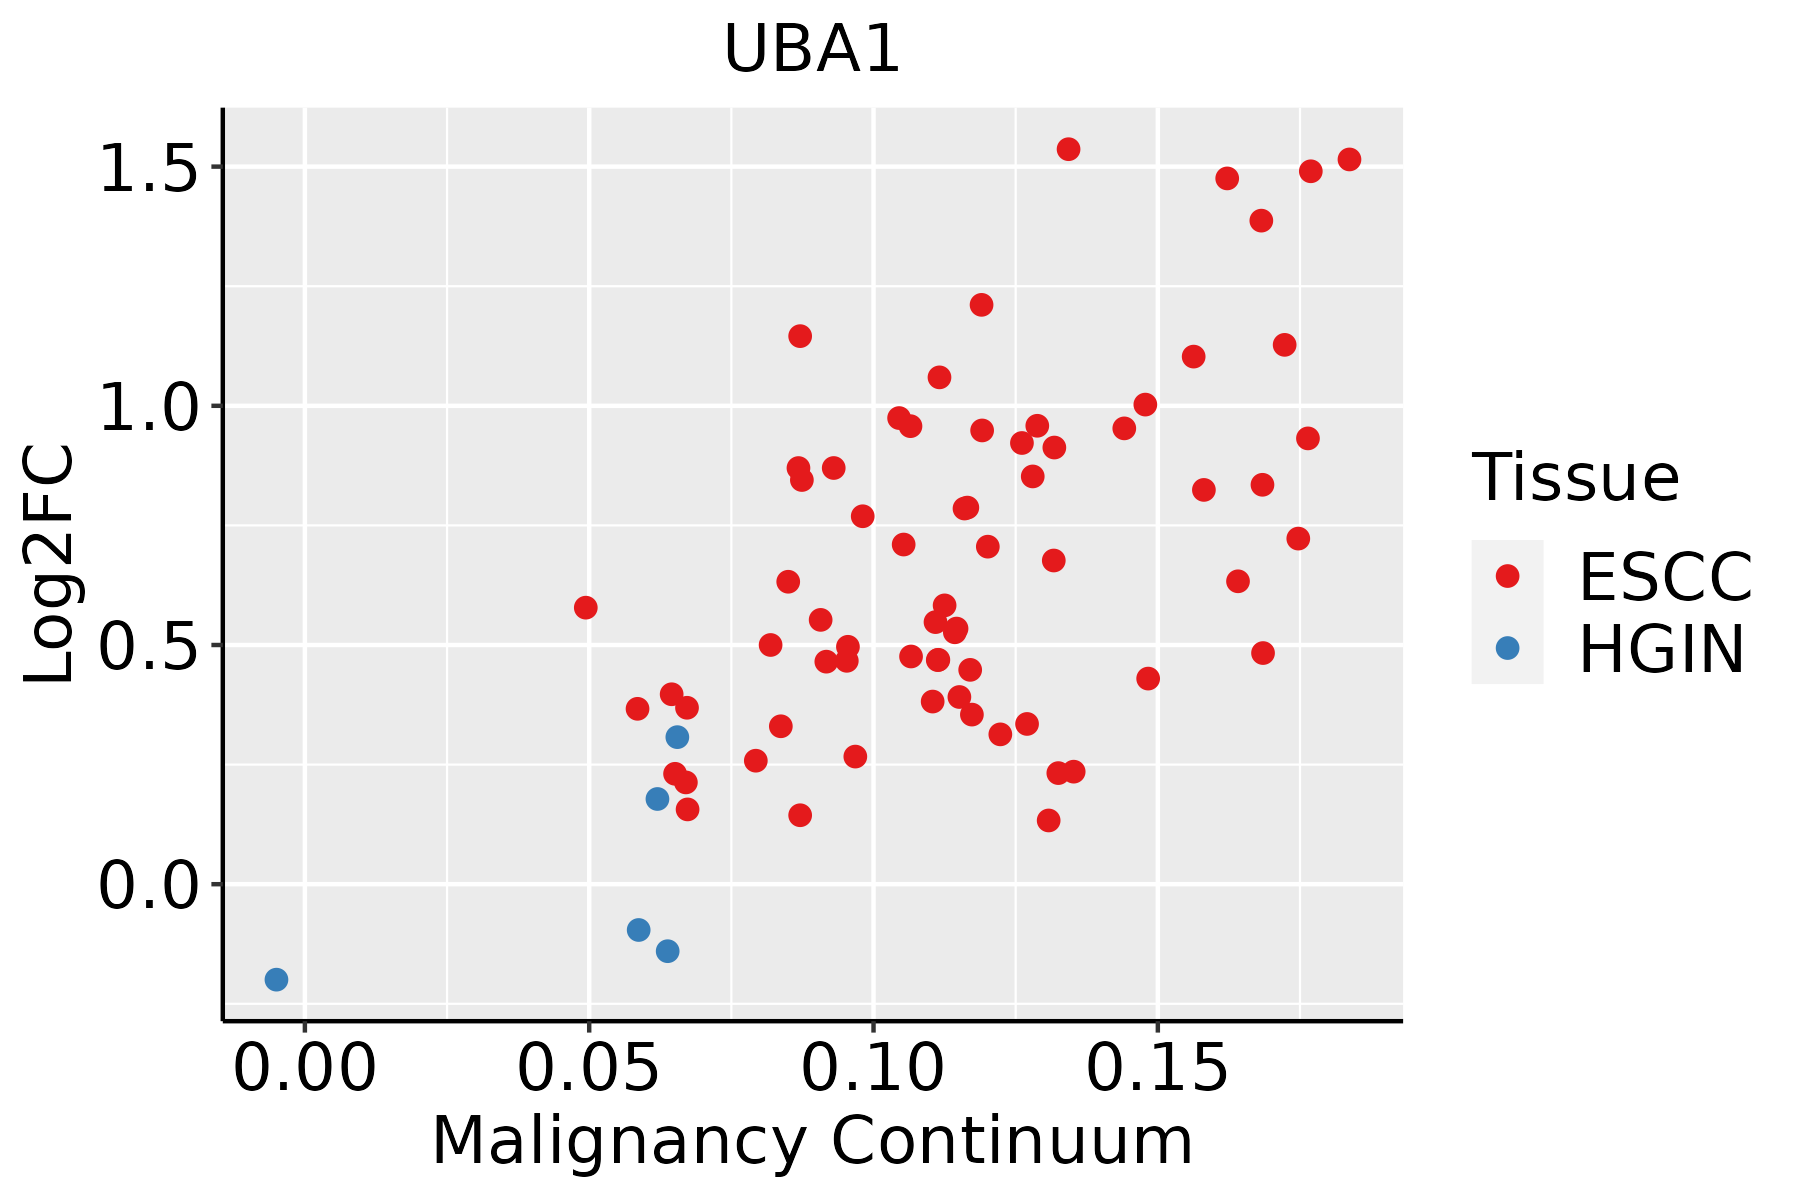 | ESCC: Esophageal squamous cell carcinoma |
| HGIN: High-grade intraepithelial neoplasias |
| LGIN: Low-grade intraepithelial neoplasias |
| Liver | 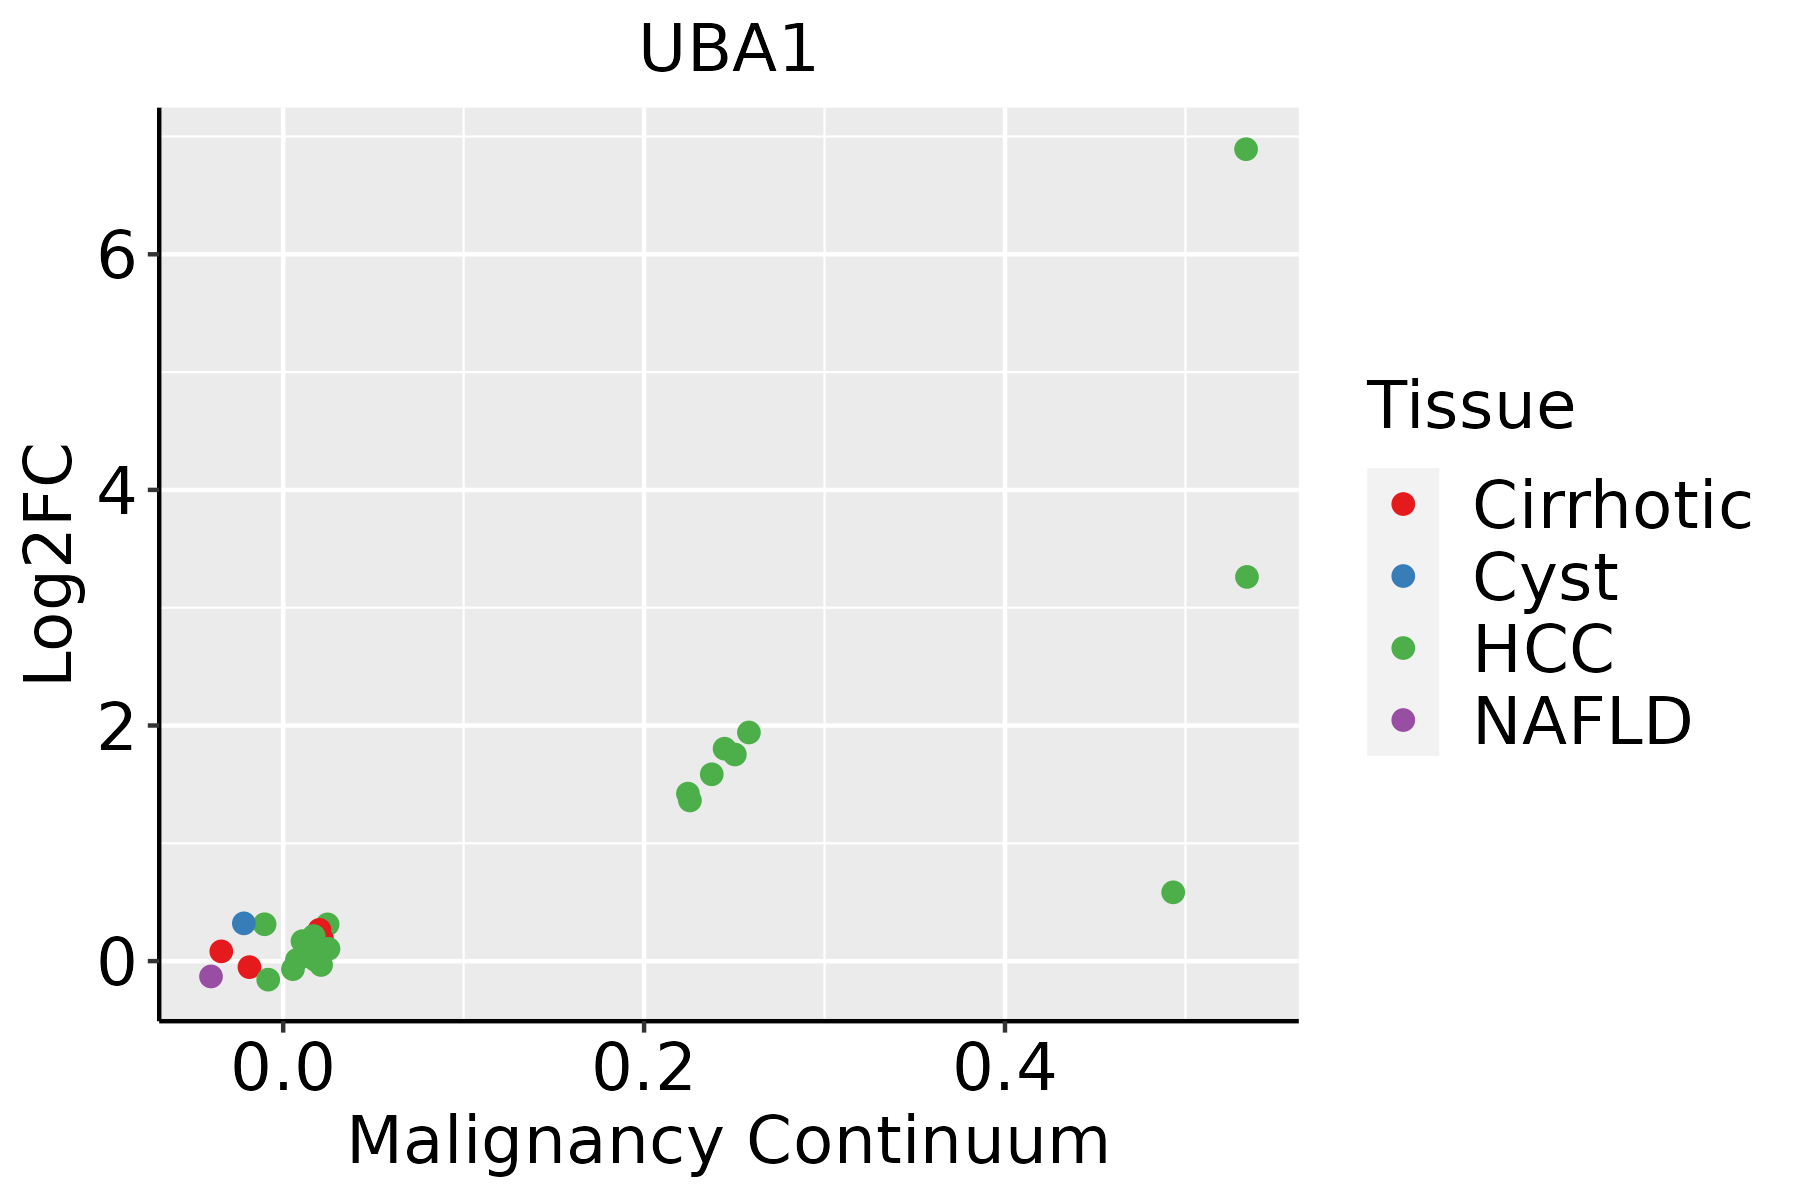 | HCC: Hepatocellular carcinoma |
| NAFLD: Non-alcoholic fatty liver disease |
| Oral Cavity | 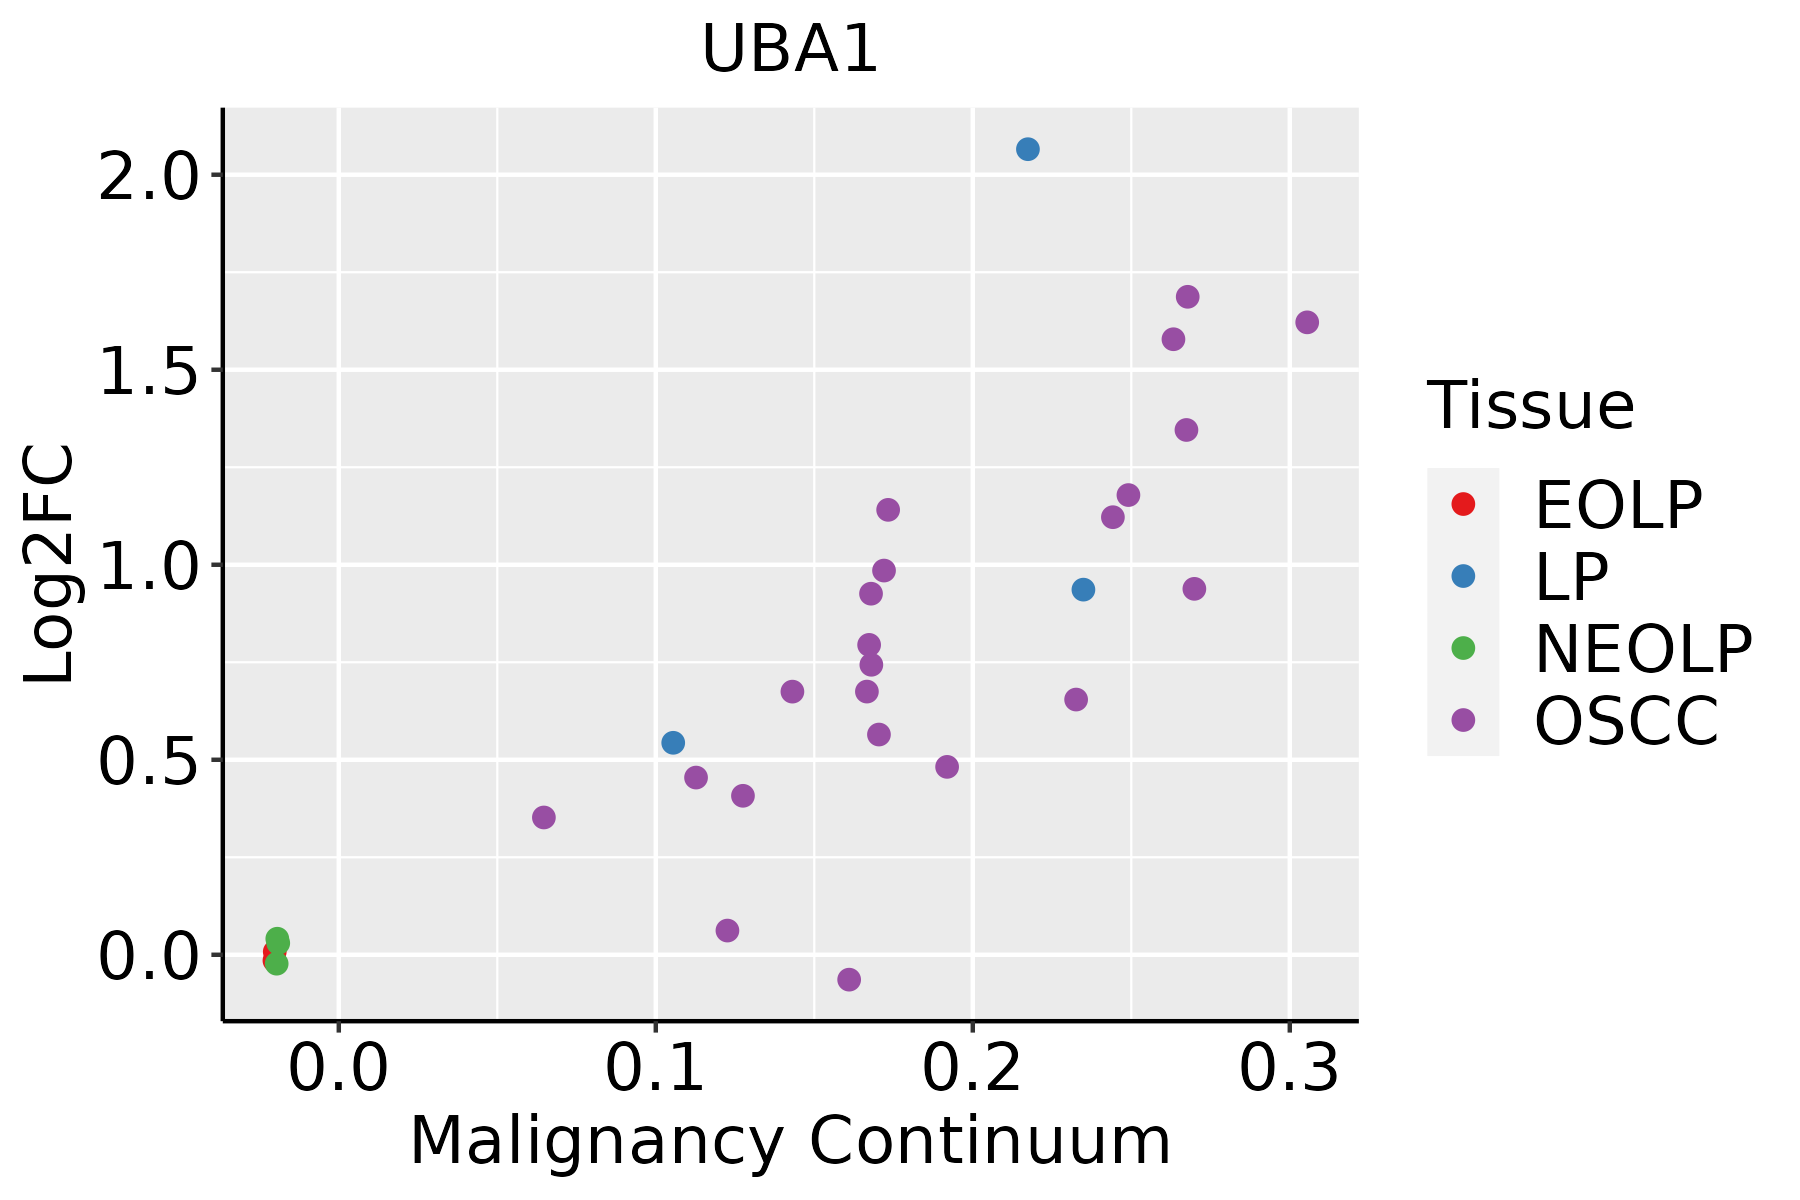 | EOLP: Erosive Oral lichen planus |
| LP: leukoplakia |
| NEOLP: Non-erosive oral lichen planus |
| OSCC: Oral squamous cell carcinoma |
| Skin | 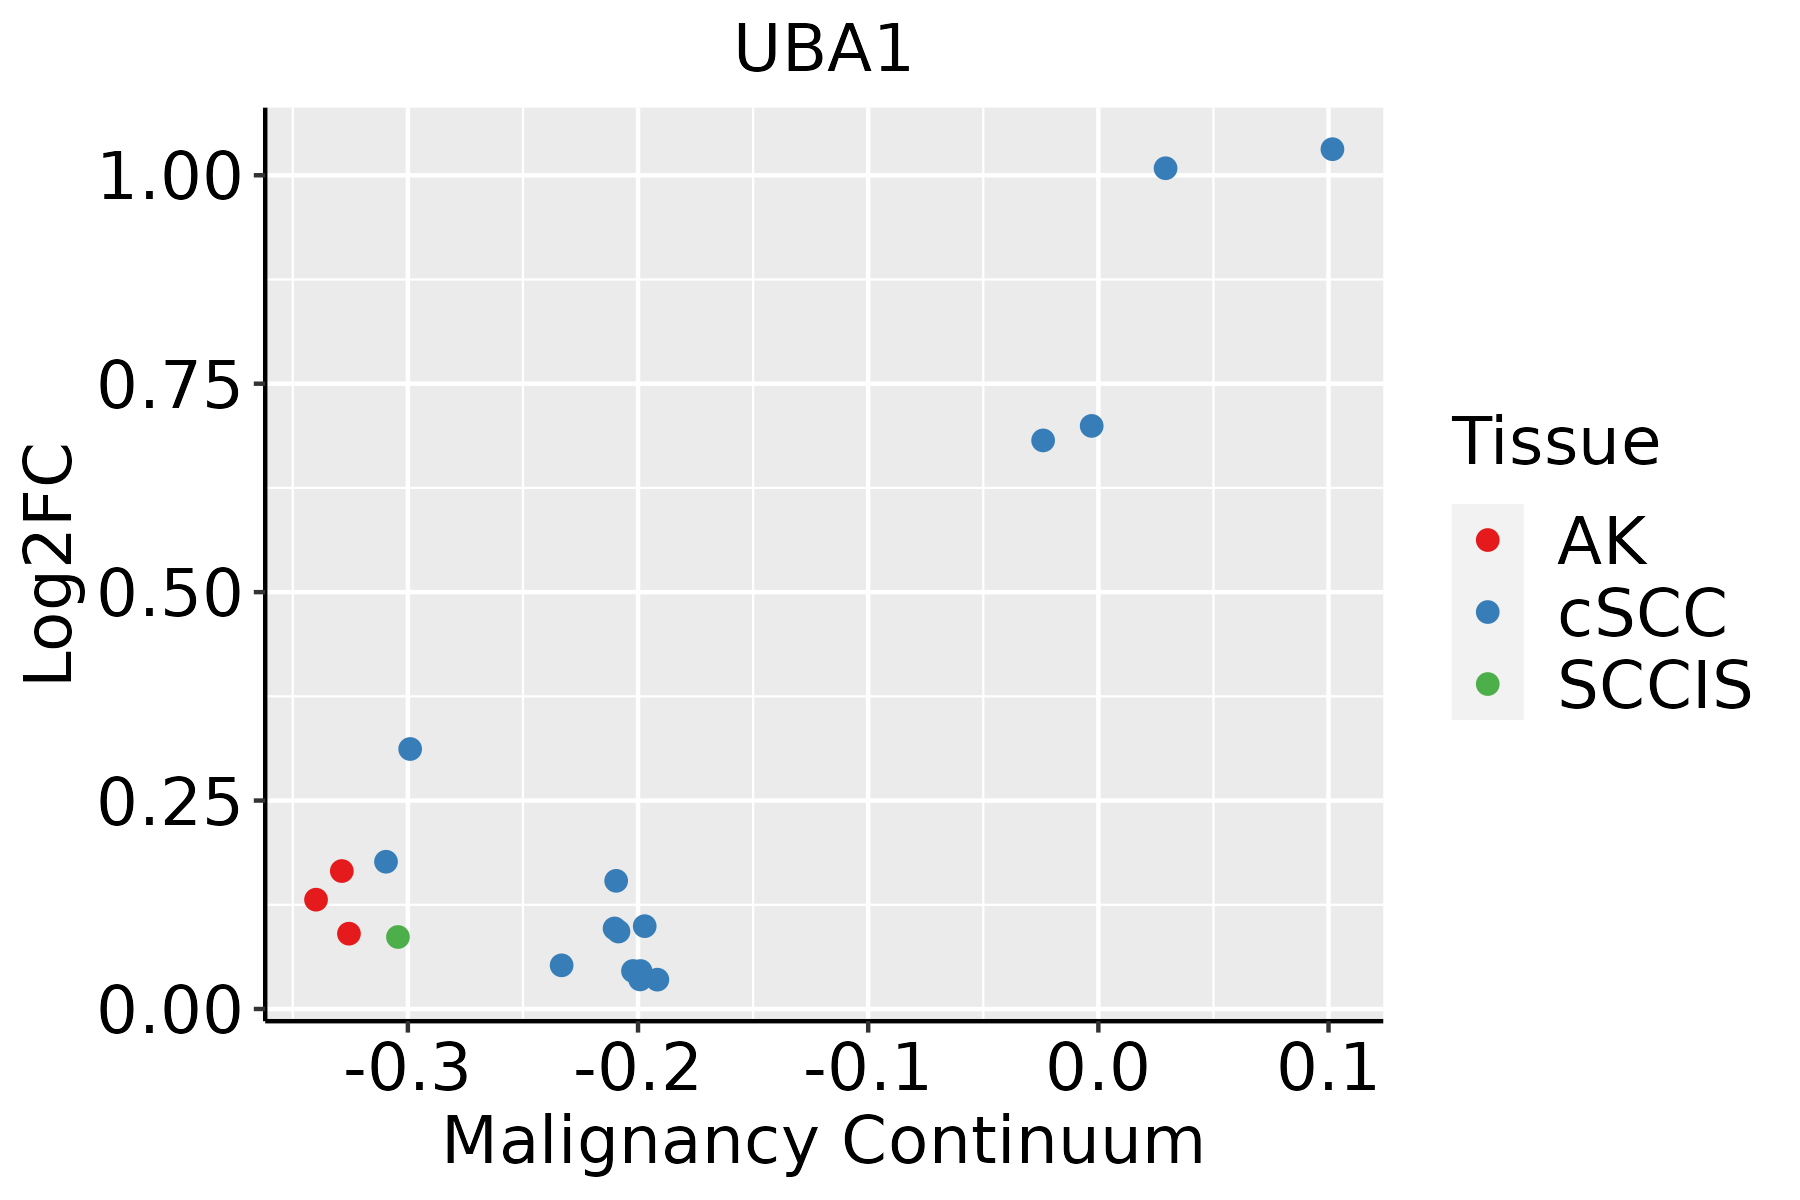 | AK: Actinic keratosis |
| cSCC: Cutaneous squamous cell carcinoma |
| SCCIS:squamous cell carcinoma in situ |
| Thyroid | 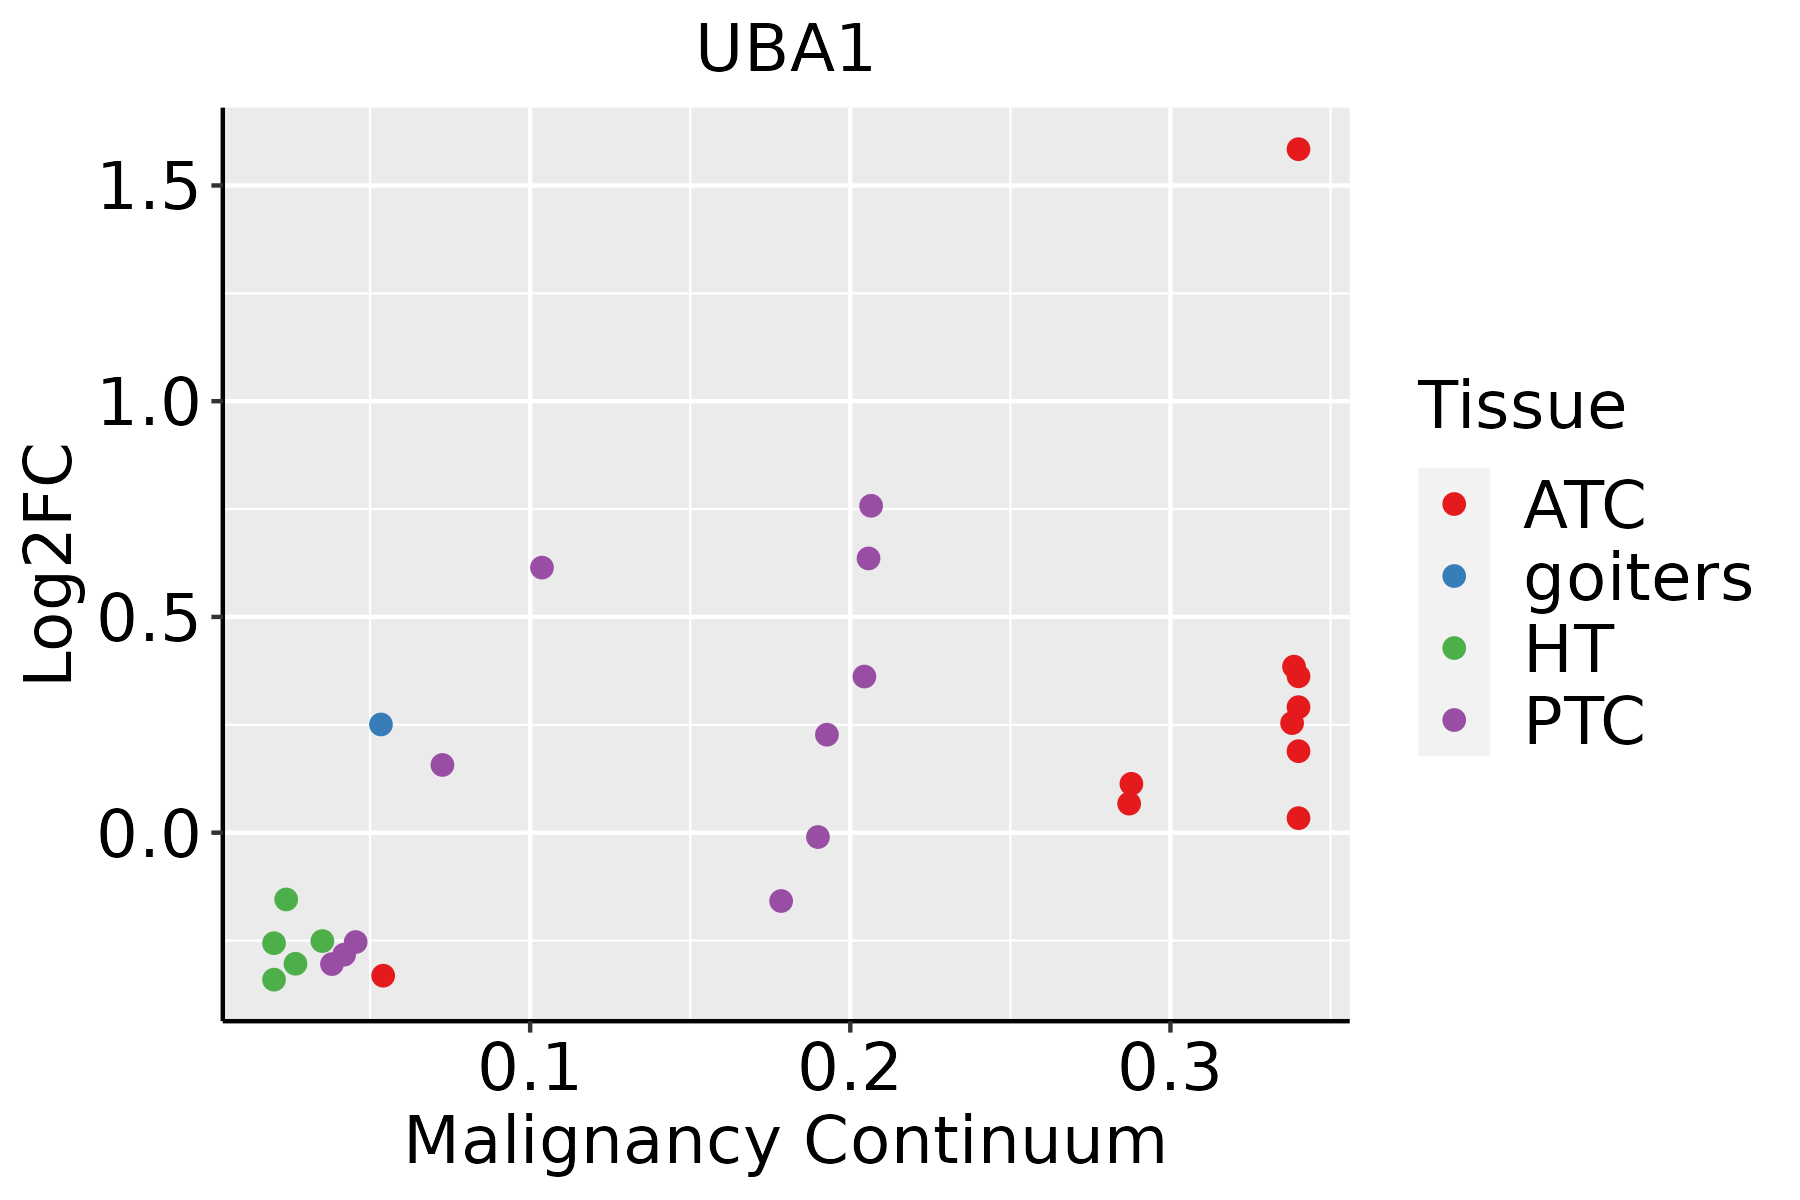 | ATC: Anaplastic thyroid cancer |
| HT: Hashimoto's thyroiditis |
| PTC: Papillary thyroid cancer |
| GO ID | Tissue | Disease Stage | Description | Gene Ratio | Bg Ratio | pvalue | p.adjust | Count |
| GO:00307057 | Cervix | CC | cytoskeleton-dependent intracellular transport | 40/2311 | 195/18723 | 7.92e-04 | 6.99e-03 | 40 |
| GO:00713533 | Cervix | HSIL_HPV | cellular response to interleukin-4 | 7/737 | 33/18723 | 2.48e-04 | 4.30e-03 | 7 |
| GO:00706703 | Cervix | HSIL_HPV | response to interleukin-4 | 7/737 | 36/18723 | 4.38e-04 | 6.51e-03 | 7 |
| GO:003070513 | Cervix | N_HPV | cytoskeleton-dependent intracellular transport | 13/534 | 195/18723 | 4.03e-03 | 3.16e-02 | 13 |
| GO:00307058 | Endometrium | AEH | cytoskeleton-dependent intracellular transport | 38/2100 | 195/18723 | 4.72e-04 | 4.91e-03 | 38 |
| GO:00508086 | Endometrium | AEH | synapse organization | 67/2100 | 426/18723 | 2.67e-03 | 1.94e-02 | 67 |
| GO:003070514 | Endometrium | EEC | cytoskeleton-dependent intracellular transport | 39/2168 | 195/18723 | 4.40e-04 | 4.58e-03 | 39 |
| GO:005080812 | Endometrium | EEC | synapse organization | 68/2168 | 426/18723 | 3.73e-03 | 2.49e-02 | 68 |
| GO:003070517 | Esophagus | HGIN | cytoskeleton-dependent intracellular transport | 45/2587 | 195/18723 | 3.07e-04 | 5.15e-03 | 45 |
| GO:003070518 | Esophagus | ESCC | cytoskeleton-dependent intracellular transport | 133/8552 | 195/18723 | 1.48e-10 | 4.27e-09 | 133 |
| GO:00713532 | Liver | Cirrhotic | cellular response to interleukin-4 | 17/4634 | 33/18723 | 8.32e-04 | 6.06e-03 | 17 |
| GO:003070511 | Liver | Cirrhotic | cytoskeleton-dependent intracellular transport | 68/4634 | 195/18723 | 9.54e-04 | 6.77e-03 | 68 |
| GO:00706702 | Liver | Cirrhotic | response to interleukin-4 | 17/4634 | 36/18723 | 2.82e-03 | 1.63e-02 | 17 |
| GO:003070521 | Liver | HCC | cytoskeleton-dependent intracellular transport | 111/7958 | 195/18723 | 3.25e-05 | 3.28e-04 | 111 |
| GO:007135311 | Liver | HCC | cellular response to interleukin-4 | 21/7958 | 33/18723 | 1.16e-02 | 4.28e-02 | 21 |
| GO:003070510 | Oral cavity | OSCC | cytoskeleton-dependent intracellular transport | 113/7305 | 195/18723 | 6.03e-08 | 1.09e-06 | 113 |
| GO:00713535 | Oral cavity | OSCC | cellular response to interleukin-4 | 21/7305 | 33/18723 | 3.63e-03 | 1.51e-02 | 21 |
| GO:00706705 | Oral cavity | OSCC | response to interleukin-4 | 21/7305 | 36/18723 | 1.46e-02 | 4.76e-02 | 21 |
| GO:007135313 | Oral cavity | LP | cellular response to interleukin-4 | 18/4623 | 33/18723 | 2.26e-04 | 2.41e-03 | 18 |
| GO:003070516 | Oral cavity | LP | cytoskeleton-dependent intracellular transport | 68/4623 | 195/18723 | 8.92e-04 | 7.64e-03 | 68 |
| Pathway ID | Tissue | Disease Stage | Description | Gene Ratio | Bg Ratio | pvalue | p.adjust | qvalue | Count |
| hsa05012 | Colorectum | AD | Parkinson disease | 147/2092 | 266/8465 | 2.53e-27 | 8.48e-25 | 5.41e-25 | 147 |
| hsa05022 | Colorectum | AD | Pathways of neurodegeneration - multiple diseases | 201/2092 | 476/8465 | 4.54e-18 | 1.27e-16 | 8.09e-17 | 201 |
| hsa04120 | Colorectum | AD | Ubiquitin mediated proteolysis | 58/2092 | 142/8465 | 1.46e-05 | 1.53e-04 | 9.76e-05 | 58 |
| hsa050121 | Colorectum | AD | Parkinson disease | 147/2092 | 266/8465 | 2.53e-27 | 8.48e-25 | 5.41e-25 | 147 |
| hsa050221 | Colorectum | AD | Pathways of neurodegeneration - multiple diseases | 201/2092 | 476/8465 | 4.54e-18 | 1.27e-16 | 8.09e-17 | 201 |
| hsa041201 | Colorectum | AD | Ubiquitin mediated proteolysis | 58/2092 | 142/8465 | 1.46e-05 | 1.53e-04 | 9.76e-05 | 58 |
| hsa050122 | Colorectum | SER | Parkinson disease | 132/1580 | 266/8465 | 2.72e-31 | 9.03e-29 | 6.55e-29 | 132 |
| hsa050222 | Colorectum | SER | Pathways of neurodegeneration - multiple diseases | 168/1580 | 476/8465 | 6.23e-19 | 2.07e-17 | 1.50e-17 | 168 |
| hsa041202 | Colorectum | SER | Ubiquitin mediated proteolysis | 39/1580 | 142/8465 | 6.18e-03 | 3.66e-02 | 2.66e-02 | 39 |
| hsa050123 | Colorectum | SER | Parkinson disease | 132/1580 | 266/8465 | 2.72e-31 | 9.03e-29 | 6.55e-29 | 132 |
| hsa050223 | Colorectum | SER | Pathways of neurodegeneration - multiple diseases | 168/1580 | 476/8465 | 6.23e-19 | 2.07e-17 | 1.50e-17 | 168 |
| hsa041203 | Colorectum | SER | Ubiquitin mediated proteolysis | 39/1580 | 142/8465 | 6.18e-03 | 3.66e-02 | 2.66e-02 | 39 |
| hsa050124 | Colorectum | MSS | Parkinson disease | 140/1875 | 266/8465 | 2.32e-28 | 7.79e-26 | 4.77e-26 | 140 |
| hsa050224 | Colorectum | MSS | Pathways of neurodegeneration - multiple diseases | 192/1875 | 476/8465 | 2.79e-20 | 1.04e-18 | 6.36e-19 | 192 |
| hsa041204 | Colorectum | MSS | Ubiquitin mediated proteolysis | 55/1875 | 142/8465 | 5.02e-06 | 6.00e-05 | 3.68e-05 | 55 |
| hsa050125 | Colorectum | MSS | Parkinson disease | 140/1875 | 266/8465 | 2.32e-28 | 7.79e-26 | 4.77e-26 | 140 |
| hsa050225 | Colorectum | MSS | Pathways of neurodegeneration - multiple diseases | 192/1875 | 476/8465 | 2.79e-20 | 1.04e-18 | 6.36e-19 | 192 |
| hsa041205 | Colorectum | MSS | Ubiquitin mediated proteolysis | 55/1875 | 142/8465 | 5.02e-06 | 6.00e-05 | 3.68e-05 | 55 |
| hsa050126 | Colorectum | MSI-H | Parkinson disease | 85/797 | 266/8465 | 1.19e-25 | 1.29e-23 | 1.08e-23 | 85 |
| hsa050226 | Colorectum | MSI-H | Pathways of neurodegeneration - multiple diseases | 107/797 | 476/8465 | 1.24e-18 | 5.72e-17 | 4.80e-17 | 107 |
| Hugo Symbol | Variant Class | Variant Classification | dbSNP RS | HGVSc | HGVSp | HGVSp Short | SWISSPROT | BIOTYPE | SIFT | PolyPhen | Tumor Sample Barcode | Tissue | Histology | Sex | Age | Stage | Therapy Types | Drugs | Outcome |
| UBA1 | SNV | Missense_Mutation | novel | c.2132N>T | p.Cys711Phe | p.C711F | P22314 | protein_coding | deleterious(0.02) | benign(0.001) | TCGA-A2-A25A-01 | Breast | breast invasive carcinoma | Female | <65 | I/II | Unspecific | Cytoxan | SD |
| UBA1 | SNV | Missense_Mutation | novel | c.2851G>A | p.Glu951Lys | p.E951K | P22314 | protein_coding | tolerated(0.23) | benign(0.094) | TCGA-AN-A046-01 | Breast | breast invasive carcinoma | Female | >=65 | I/II | Unknown | Unknown | SD |
| UBA1 | SNV | Missense_Mutation | | c.2464N>A | p.Asp822Asn | p.D822N | P22314 | protein_coding | deleterious(0.04) | benign(0.12) | TCGA-AR-A0TX-01 | Breast | breast invasive carcinoma | Female | <65 | I/II | Unknown | Unknown | SD |
| UBA1 | SNV | Missense_Mutation | rs781991007 | c.636T>G | p.Asn212Lys | p.N212K | P22314 | protein_coding | deleterious(0.01) | benign(0.333) | TCGA-AR-A1AP-01 | Breast | breast invasive carcinoma | Female | >=65 | I/II | Hormone Therapy | anastrozole | SD |
| UBA1 | SNV | Missense_Mutation | rs782282295 | c.385N>A | p.Glu129Lys | p.E129K | P22314 | protein_coding | tolerated(0.12) | possibly_damaging(0.701) | TCGA-BH-A0W7-01 | Breast | breast invasive carcinoma | Female | <65 | I/II | Chemotherapy | taxotere | CR |
| UBA1 | SNV | Missense_Mutation | | c.2988N>A | p.Met996Ile | p.M996I | P22314 | protein_coding | tolerated(0.17) | benign(0.237) | TCGA-C8-A12P-01 | Breast | breast invasive carcinoma | Female | <65 | I/II | Unknown | Unknown | SD |
| UBA1 | SNV | Missense_Mutation | novel | c.1750N>T | p.Met584Leu | p.M584L | P22314 | protein_coding | tolerated(0.08) | benign(0.363) | TCGA-E2-A154-01 | Breast | breast invasive carcinoma | Female | >=65 | I/II | Hormone Therapy | arimidex | SD |
| UBA1 | insertion | In_Frame_Ins | novel | c.1065_1066insCCTGTCACTGCCTACACTGGACCCCTCGTTGAG | p.Ala355_Ala356insProValThrAlaTyrThrGlyProLeuValGlu | p.A355_A356insPVTAYTGPLVE | P22314 | protein_coding | | | TCGA-AN-A03X-01 | Breast | breast invasive carcinoma | Female | >=65 | I/II | Unknown | Unknown | SD |
| UBA1 | SNV | Missense_Mutation | | c.2467N>A | p.Asp823Asn | p.D823N | P22314 | protein_coding | tolerated(0.11) | benign(0.147) | TCGA-DR-A0ZM-01 | Cervix | cervical & endocervical cancer | Female | <65 | III/IV | Unspecific | Cisplatin | SD |
| UBA1 | SNV | Missense_Mutation | novel | c.1570N>A | p.Val524Ile | p.V524I | P22314 | protein_coding | tolerated(0.27) | benign(0.341) | TCGA-MA-AA43-01 | Cervix | cervical & endocervical cancer | Female | <65 | III/IV | Unknown | Unknown | SD |


