Schematic overview of the cellular and molecular mechanisms involved in the cancer progression, including the proposed cellular and molecular mechanisms in cancer cells trajectory. AT1: alveolar type 1 cells; AT2: alveolar type 2 cells; AAH: atypical adenomatous hyperplasia; AIS: adenocarcinoma in situ; MIA: minimally invasive adenocarcinoma; IA: invasive adenocarcinoma; EMT: epithelial-mesenchymal transition

Home

Download

Statistics

Help

Contact

Center for Computational Systems Medicine
leaf

Gene summary

leaf

Malignant transformation analysis

leaf

Malignant transformation related pathway analysis

leaf

Cell-cell communication analysis

leaf

Single-cell gene regulatory network inference analysis

leaf

Somatic mutation of malignant transformation related genes

leaf

Related drugs of malignant transformation related genes

Gene: UACA

Gene summary for UACA

check button Gene summary.

Gene informationSpeciesHuman
Gene symbol

UACA

Gene ID

55075

Gene nameuveal autoantigen with coiled-coil domains and ankyrin repeats
Gene AliasNUCLING
Cytomap15q23
Gene Typeprotein-coding
GO ID

GO:0006508

UniProtAcc

Q9BZF9


Top

Malignant transformation analysis

check button Identification of the aberrant gene expression in precancerous and cancerous lesions by comparing the gene expression of stem-like cells in diseased tissues with normal stem cells
check button Malignant transformation involving gene list.
Entrez IDSymbolReplicatesSpeciesOrganTissueAdj P-valueLog2FCMalignancy
55075UACALZE2THumanEsophagusESCC1.87e-032.90e-010.082
55075UACALZE4THumanEsophagusESCC1.87e-061.30e-010.0811
55075UACALZE7THumanEsophagusESCC1.77e-021.77e-010.0667
55075UACALZE22THumanEsophagusESCC2.28e-043.68e-010.068
55075UACALZE24THumanEsophagusESCC5.57e-182.76e-010.0596
55075UACALZE21THumanEsophagusESCC5.27e-032.04e-010.0655
55075UACAP1T-EHumanEsophagusESCC4.22e-045.97e-010.0875
55075UACAP2T-EHumanEsophagusESCC1.04e-356.67e-010.1177
55075UACAP4T-EHumanEsophagusESCC2.02e-174.87e-010.1323
55075UACAP8T-EHumanEsophagusESCC4.44e-295.90e-010.0889
55075UACAP9T-EHumanEsophagusESCC2.82e-154.95e-010.1131
55075UACAP10T-EHumanEsophagusESCC2.46e-306.30e-010.116
55075UACAP11T-EHumanEsophagusESCC1.63e-114.89e-010.1426
55075UACAP12T-EHumanEsophagusESCC7.03e-296.40e-010.1122
55075UACAP15T-EHumanEsophagusESCC1.86e-153.81e-010.1149
55075UACAP16T-EHumanEsophagusESCC9.48e-274.73e-010.1153
55075UACAP17T-EHumanEsophagusESCC8.32e-042.27e-010.1278
55075UACAP19T-EHumanEsophagusESCC2.91e-023.91e-010.1662
55075UACAP20T-EHumanEsophagusESCC2.56e-042.41e-010.1124
55075UACAP21T-EHumanEsophagusESCC4.46e-052.38e-010.1617
Page: 1 2 3 4 5 6 7 

check button Transcriptomic changes along malignancy continuum.
TissueExpression DynamicsAbbreviation
EsophagusThe image shows the transcriptomic changes along malignancy continuum.log2FC in expression of this searched gene in stem-like cells from each diseased tissue sample relative to stem-like cells in normal samples in each tissue plotted against the malignancy continuum. Samples are colored based on if they are from different disease stage.
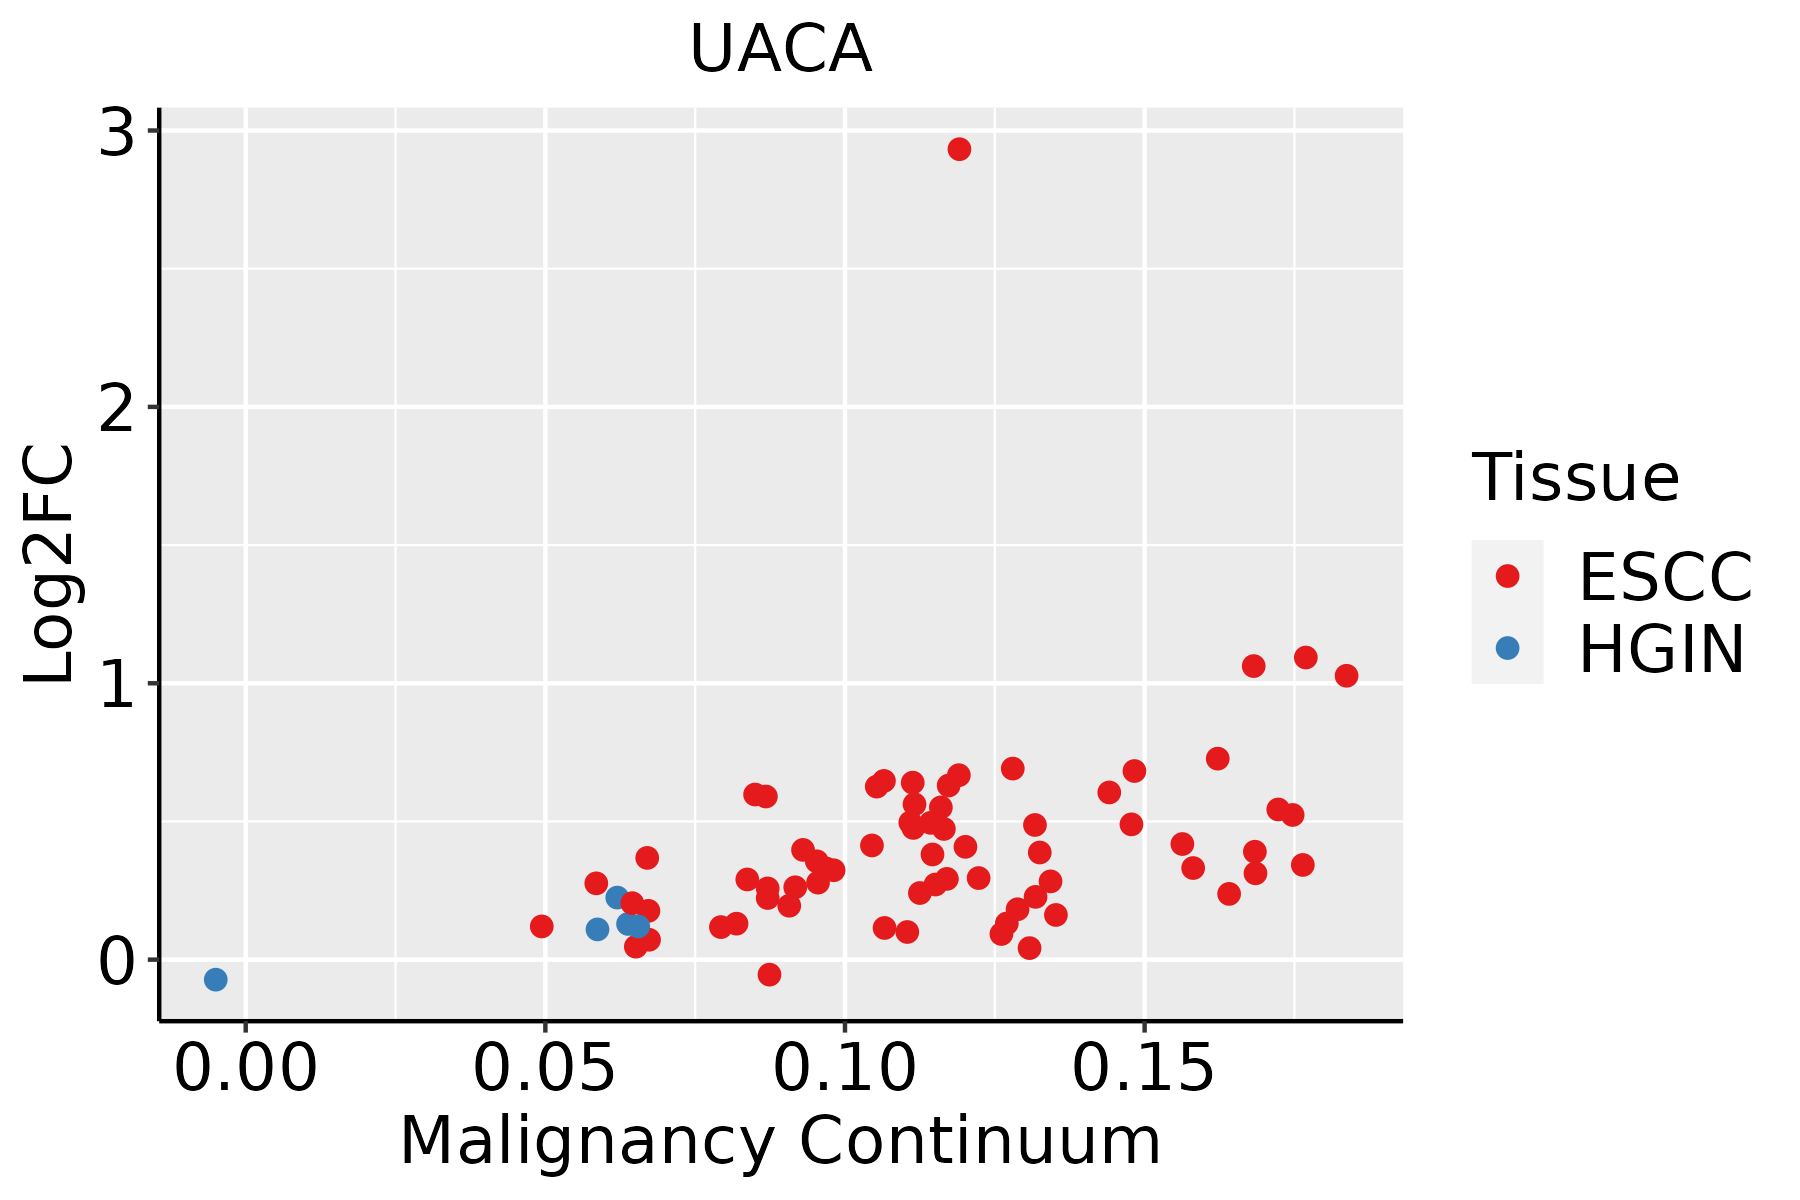
ESCC: Esophageal squamous cell carcinoma
HGIN: High-grade intraepithelial neoplasias
LGIN: Low-grade intraepithelial neoplasias
LiverThe image shows the transcriptomic changes along malignancy continuum.log2FC in expression of this searched gene in stem-like cells from each diseased tissue sample relative to stem-like cells in normal samples in each tissue plotted against the malignancy continuum. Samples are colored based on if they are from different disease stage.HCC: Hepatocellular carcinoma
NAFLD: Non-alcoholic fatty liver disease
Oral CavityThe image shows the transcriptomic changes along malignancy continuum.log2FC in expression of this searched gene in stem-like cells from each diseased tissue sample relative to stem-like cells in normal samples in each tissue plotted against the malignancy continuum. Samples are colored based on if they are from different disease stage.
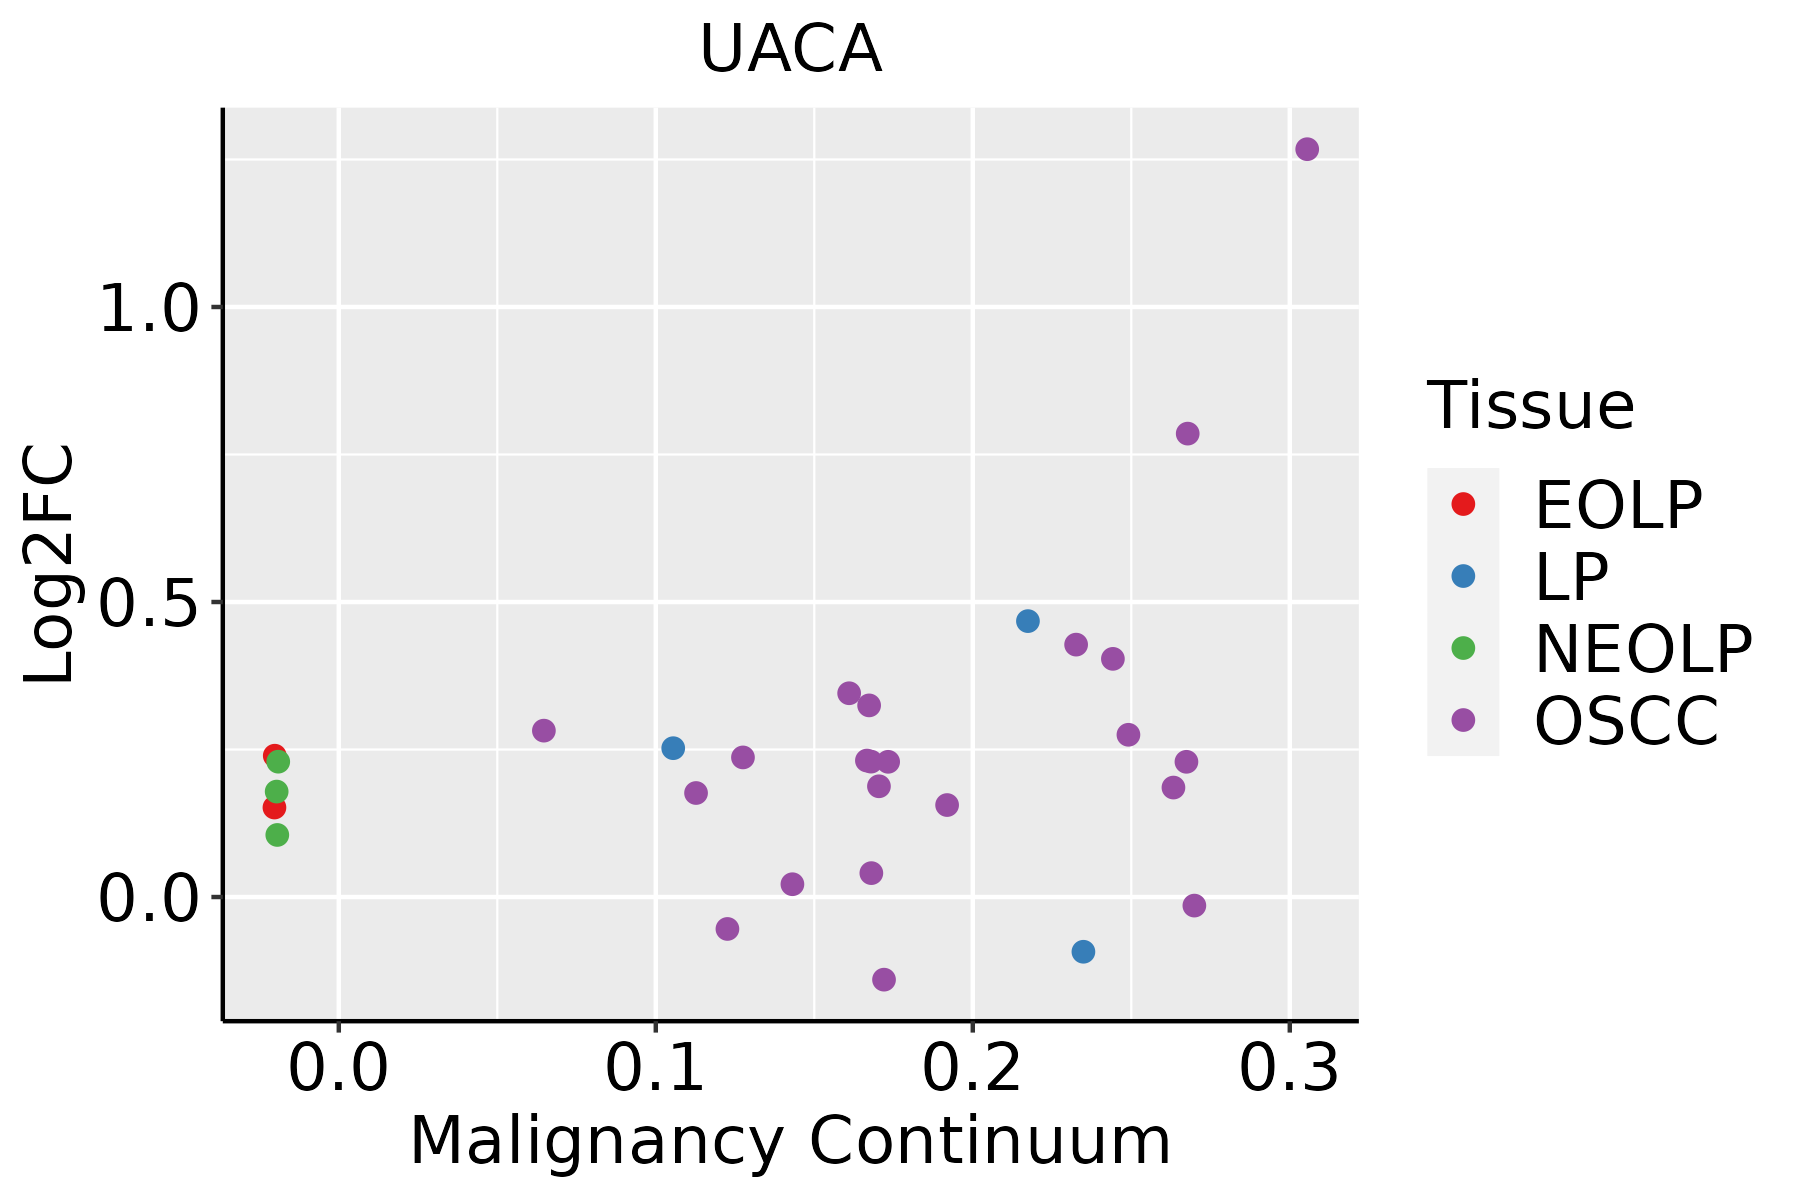
EOLP: Erosive Oral lichen planus
LP: leukoplakia
NEOLP: Non-erosive oral lichen planus
OSCC: Oral squamous cell carcinoma
ProstateThe image shows the transcriptomic changes along malignancy continuum.log2FC in expression of this searched gene in stem-like cells from each diseased tissue sample relative to stem-like cells in normal samples in each tissue plotted against the malignancy continuum. Samples are colored based on if they are from different disease stage.
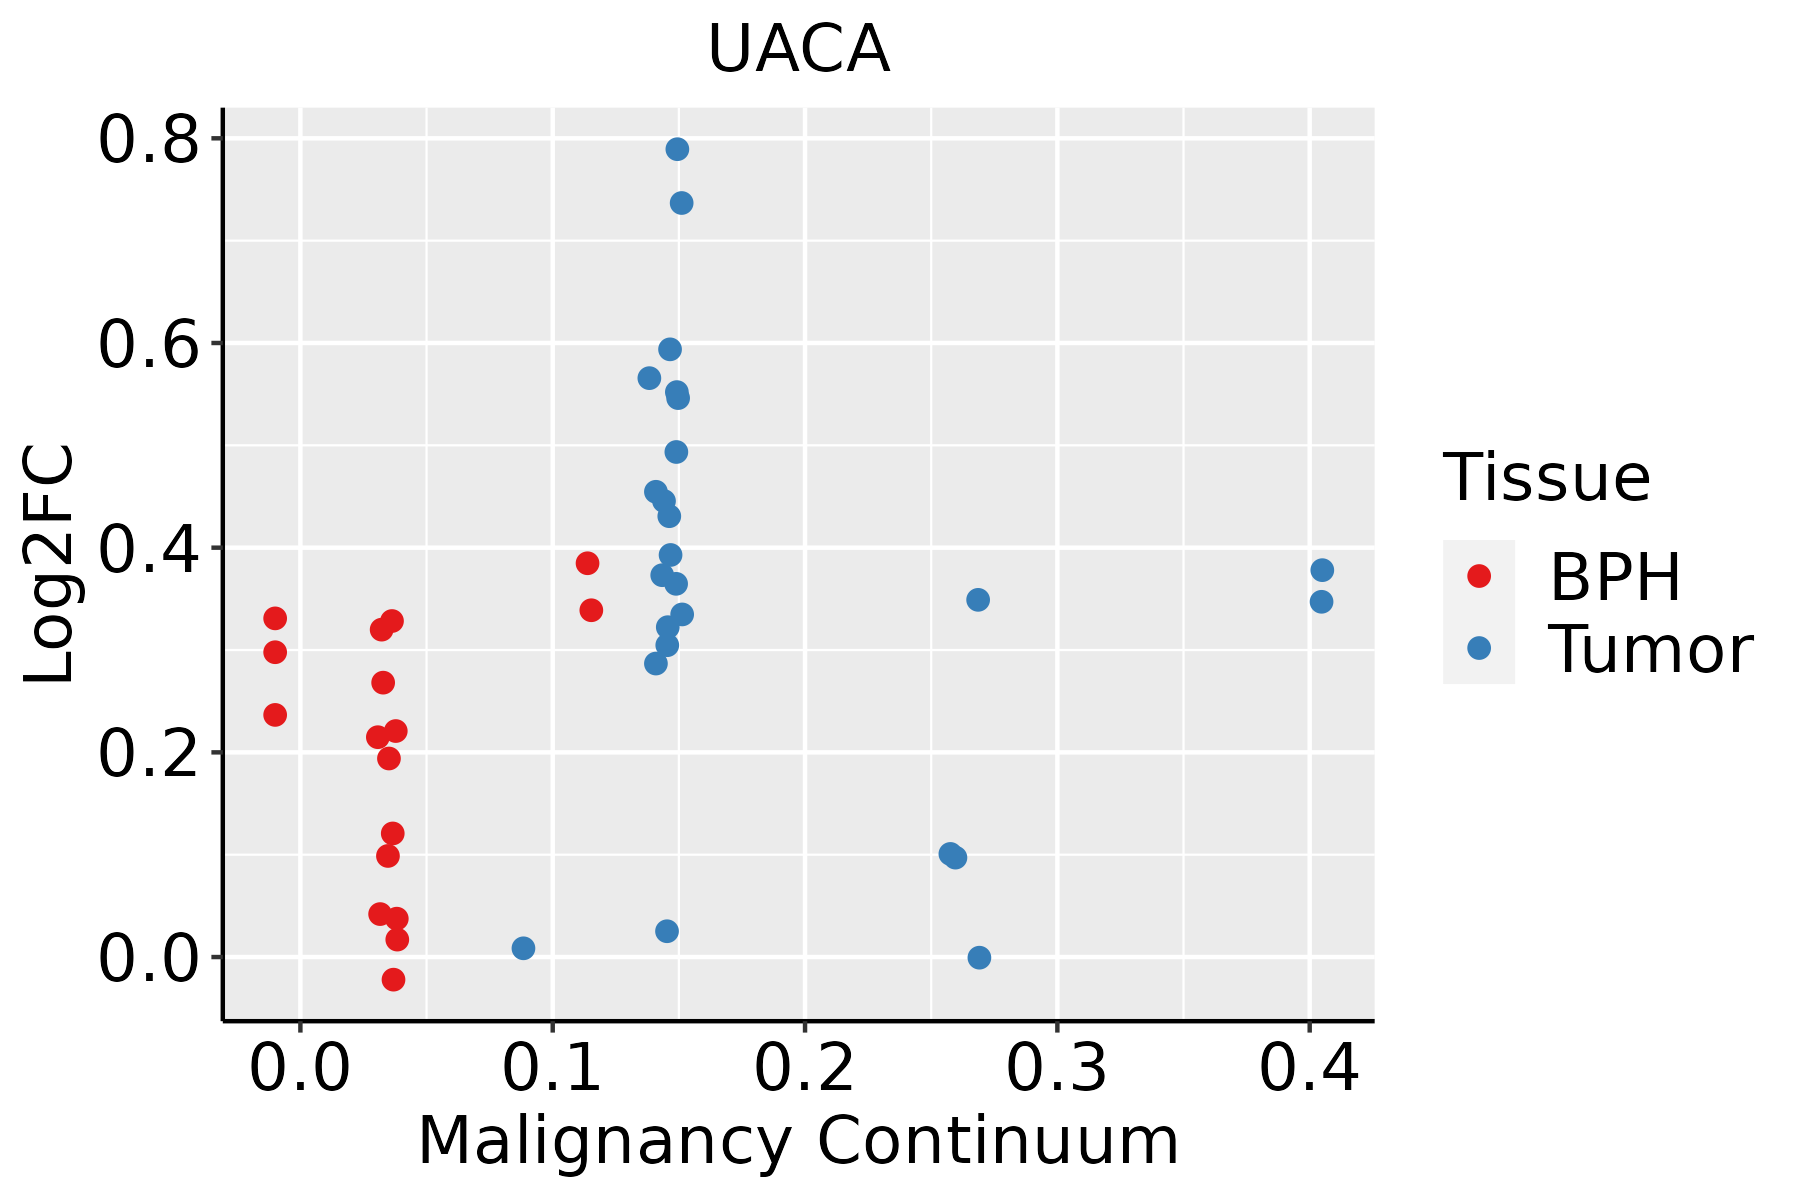
BPH: Benign Prostatic Hyperplasia
ThyroidThe image shows the transcriptomic changes along malignancy continuum.log2FC in expression of this searched gene in stem-like cells from each diseased tissue sample relative to stem-like cells in normal samples in each tissue plotted against the malignancy continuum. Samples are colored based on if they are from different disease stage.
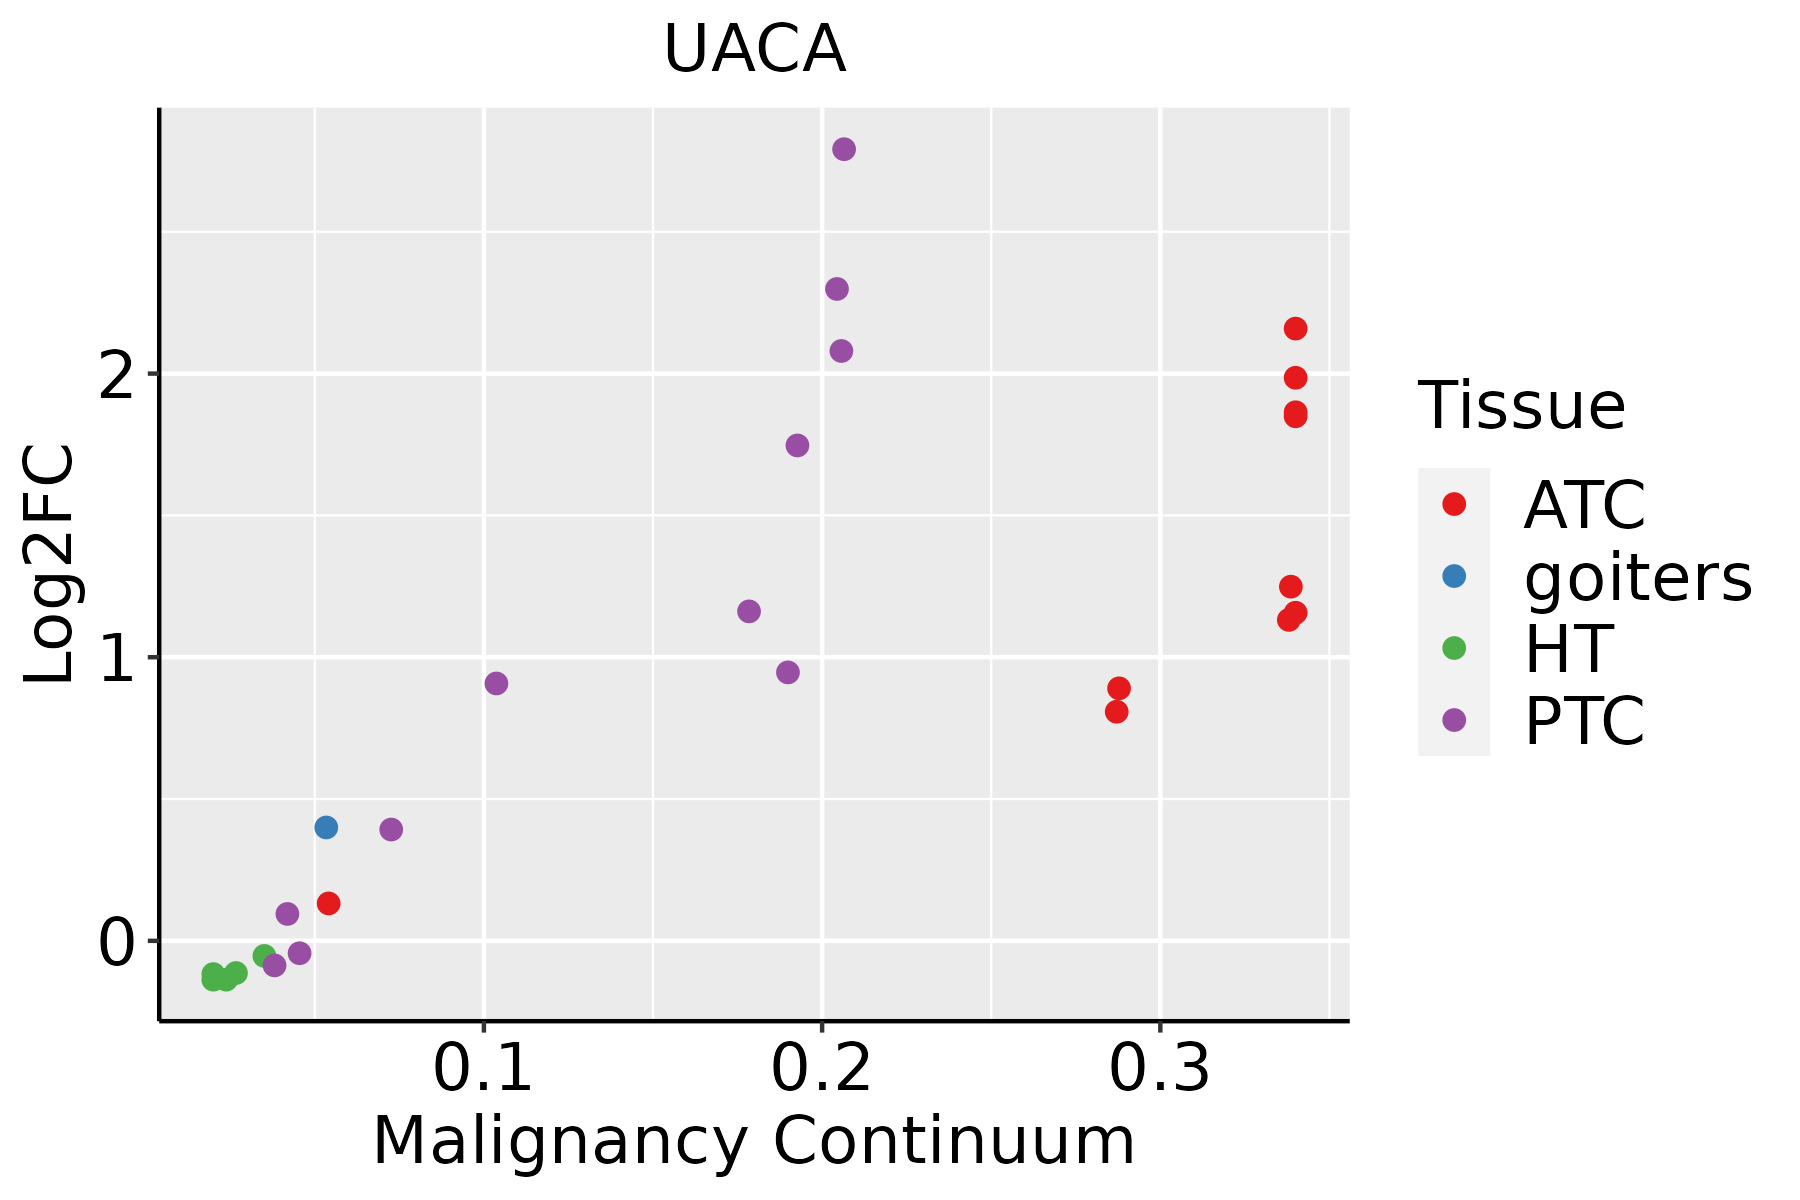
ATC: Anaplastic thyroid cancer
HT: Hashimoto's thyroiditis
PTC: Papillary thyroid cancer
∗log2FC in expression of this searched gene in stem-like cells from each diseased tissue sample relative to stem-like cells in normal samples in each tissue plotted against the malignancy continuum. Samples are colored based on if they are from different disease stage.

Top

Malignant transformation related pathway analysis

check buttonFind out the enriched GO biological processes and KEGG pathways involved in transition from healthy to precancer to cancer
check button Figure of enriched GO biological processes.
TissueDisease StageEnriched GO biological Processes
ColorectumADGO analysis - Figure of enriched GO biological processes: Top 15 enriched GO BP terms are showed in the bar plot of each disease state in each tissue. Each row represents a significant GO biological process which is colored according to the -log10(p.adjust).
ColorectumSERGO analysis - Figure of enriched GO biological processes: Top 15 enriched GO BP terms are showed in the bar plot of each disease state in each tissue. Each row represents a significant GO biological process which is colored according to the -log10(p.adjust).
ColorectumMSSGO analysis - Figure of enriched GO biological processes: Top 15 enriched GO BP terms are showed in the bar plot of each disease state in each tissue. Each row represents a significant GO biological process which is colored according to the -log10(p.adjust).
ColorectumMSI-HGO analysis - Figure of enriched GO biological processes: Top 15 enriched GO BP terms are showed in the bar plot of each disease state in each tissue. Each row represents a significant GO biological process which is colored according to the -log10(p.adjust).
ColorectumFAPGO analysis - Figure of enriched GO biological processes: Top 15 enriched GO BP terms are showed in the bar plot of each disease state in each tissue. Each row represents a significant GO biological process which is colored according to the -log10(p.adjust).
∗Top 15 enriched GO BP terms are showed in the bar plot of each disease state in each tissue. Each row represents a significant GO biological process which is colored according to the -log10(p.adjust).
Page: 1 2 3 4 5 6 7 8 9 

check button Enriched GO biological processes.
GO IDTissueDisease StageDescriptionGene RatioBg Ratiopvaluep.adjustCount
GO:0045862111EsophagusESCCpositive regulation of proteolysis256/8552372/187237.88e-209.43e-18256
GO:2000116111EsophagusESCCregulation of cysteine-type endopeptidase activity158/8552235/187231.67e-115.90e-10158
GO:0043281111EsophagusESCCregulation of cysteine-type endopeptidase activity involved in apoptotic process143/8552209/187232.12e-117.31e-10143
GO:0010952111EsophagusESCCpositive regulation of peptidase activity133/8552197/187234.31e-101.14e-08133
GO:0052547111EsophagusESCCregulation of peptidase activity275/8552461/187237.54e-101.88e-08275
GO:0052548111EsophagusESCCregulation of endopeptidase activity253/8552432/187233.68e-086.78e-07253
GO:0010950111EsophagusESCCpositive regulation of endopeptidase activity116/8552179/187231.77e-072.79e-06116
GO:0043280110EsophagusESCCpositive regulation of cysteine-type endopeptidase activity involved in apoptotic process84/8552129/187236.38e-066.55e-0584
GO:2001056110EsophagusESCCpositive regulation of cysteine-type endopeptidase activity94/8552148/187238.87e-068.59e-0594
GO:00380615EsophagusESCCNIK/NF-kappaB signaling81/8552143/187235.33e-032.00e-0281
GO:00458627LiverNAFLDpositive regulation of proteolysis65/1882372/187236.58e-062.29e-0465
GO:00525477LiverNAFLDregulation of peptidase activity72/1882461/187231.03e-042.03e-0372
GO:00525487LiverNAFLDregulation of endopeptidase activity67/1882432/187232.17e-043.70e-0367
GO:004586222LiverHCCpositive regulation of proteolysis232/7958372/187235.66e-153.98e-13232
GO:004328112LiverHCCregulation of cysteine-type endopeptidase activity involved in apoptotic process125/7958209/187233.12e-075.42e-06125
GO:200011612LiverHCCregulation of cysteine-type endopeptidase activity137/7958235/187236.91e-071.08e-05137
GO:005254722LiverHCCregulation of peptidase activity247/7958461/187238.28e-071.27e-05247
GO:005254822LiverHCCregulation of endopeptidase activity230/7958432/187233.58e-064.68e-05230
GO:001095212LiverHCCpositive regulation of peptidase activity110/7958197/187231.04e-048.98e-04110
GO:001095012LiverHCCpositive regulation of endopeptidase activity96/7958179/187231.68e-038.79e-0396
Page: 1 2 3 4 5 6 

check button Enriched KEGG pathways.
Pathway IDTissueDisease StageDescriptionGene RatioBg Ratiopvaluep.adjustqvalueCount
Page: 1 

Top

Cell-cell communication analysis

check buttonIdentification of potential cell-cell interactions between two cell types and their ligand-receptor pairs for different disease states
LigandReceptorLRpairPathwayTissueDisease Stage
Page: 1 

Top

Single-cell gene regulatory network inference analysis

check buttonFind out the significant the regulons (TFs) and the target genes of each regulon across cell types for different disease states
TFCell TypeTissueDisease StageTarget GeneRSSRegulon Activity
∗The dot plots of a searched regulon are shown for all cell subpopulations in each disease state of each tissue based on the regulon specific score inferred using pySCENIC and by calculating the average expression.
Page: 1 

Top

Somatic mutation of malignant transformation related genes

check buttonAnnotation of somatic variants for genes involved in malignant transformation
Hugo SymbolVariant ClassVariant ClassificationdbSNP RSHGVScHGVSpHGVSp ShortSWISSPROTBIOTYPESIFTPolyPhenTumor Sample BarcodeTissueHistologySexAgeStageTherapy TypesDrugsOutcome
UACASNVMissense_Mutationc.1948T>Ap.Leu650Ilep.L650IQ9BZF9protein_codingtolerated(0.18)benign(0.017)TCGA-A8-A09Z-01Breastbreast invasive carcinomaFemale>=65I/IIUnknownUnknownSD
UACASNVMissense_Mutationrs143107777c.2314N>Gp.Thr772Alap.T772AQ9BZF9protein_codingdeleterious(0.03)possibly_damaging(0.839)TCGA-AC-A2QI-01Breastbreast invasive carcinomaFemale>=65III/IVChemotherapycytoxanCR
UACASNVMissense_Mutationrs753763851c.2704G>Tp.Asp902Tyrp.D902YQ9BZF9protein_codingdeleterious(0)benign(0.219)TCGA-AN-A046-01Breastbreast invasive carcinomaFemale>=65I/IIUnknownUnknownSD
UACASNVMissense_Mutationnovelc.2408T>Gp.Phe803Cysp.F803CQ9BZF9protein_codingtolerated(0.08)possibly_damaging(0.619)TCGA-AN-A046-01Breastbreast invasive carcinomaFemale>=65I/IIUnknownUnknownSD
UACASNVMissense_Mutationc.2173G>Ap.Asp725Asnp.D725NQ9BZF9protein_codingdeleterious(0)possibly_damaging(0.905)TCGA-AN-A0AK-01Breastbreast invasive carcinomaFemale>=65I/IIUnknownUnknownSD
UACASNVMissense_Mutationc.3154N>Cp.Glu1052Glnp.E1052QQ9BZF9protein_codingdeleterious(0.01)probably_damaging(0.998)TCGA-AN-A0XW-01Breastbreast invasive carcinomaFemale<65III/IVUnknownUnknownSD
UACASNVMissense_Mutationc.844N>Tp.Asp282Tyrp.D282YQ9BZF9protein_codingdeleterious(0.02)possibly_damaging(0.526)TCGA-BH-A0B4-01Breastbreast invasive carcinomaMale>=65III/IVHormone TherapytamoxiphenSD
UACASNVMissense_Mutationc.4181N>Tp.Gly1394Valp.G1394VQ9BZF9protein_codingdeleterious(0)possibly_damaging(0.875)TCGA-BH-A0HX-01Breastbreast invasive carcinomaFemale<65I/IIChemotherapyadrimycinSD
UACASNVMissense_Mutationc.3480G>Cp.Lys1160Asnp.K1160NQ9BZF9protein_codingdeleterious(0)possibly_damaging(0.776)TCGA-C8-A26Y-01Breastbreast invasive carcinomaFemale>=65I/IIUnknownUnknownSD
UACASNVMissense_Mutationrs201992560c.3758A>Cp.Lys1253Thrp.K1253TQ9BZF9protein_codingdeleterious(0)probably_damaging(0.962)TCGA-E2-A14S-01Breastbreast invasive carcinomaFemale>=65I/IIChemotherapycytoxanSD
Page: 1 2 3 4 5 6 7 8 9 10 11 12 13 14 15 16 17 18 19 

Top

Related drugs of malignant transformation related genes

check buttonIdentification of chemicals and drugs interact with genes involved in malignant transfromation
(DGIdb 4.0)
Entrez IDSymbolCategoryInteraction TypesDrug Claim NameDrug NamePMIDs
Page: 1