
|
|||||
|
 | |
| |
| |
| |
| |
| |
|
Gene: U2AF2 |
Gene summary for U2AF2 |
| Gene information | Species | Human | Gene symbol | U2AF2 | Gene ID | 11338 |
| Gene name | U2 small nuclear RNA auxiliary factor 2 | |
| Gene Alias | U2AF65 | |
| Cytomap | 19q13.42 | |
| Gene Type | protein-coding | GO ID | GO:0000375 | UniProtAcc | P26368 |
Top |
Malignant transformation analysis |
| Identification of the aberrant gene expression in precancerous and cancerous lesions by comparing the gene expression of stem-like cells in diseased tissues with normal stem cells |
| Entrez ID | Symbol | Replicates | Species | Organ | Tissue | Adj P-value | Log2FC | Malignancy |
| 11338 | U2AF2 | LZE4T | Human | Esophagus | ESCC | 1.16e-14 | 3.91e-01 | 0.0811 |
| 11338 | U2AF2 | LZE5T | Human | Esophagus | ESCC | 3.23e-04 | 1.73e-01 | 0.0514 |
| 11338 | U2AF2 | LZE7T | Human | Esophagus | ESCC | 2.73e-12 | 7.84e-01 | 0.0667 |
| 11338 | U2AF2 | LZE8T | Human | Esophagus | ESCC | 2.69e-13 | 3.94e-01 | 0.067 |
| 11338 | U2AF2 | LZE20T | Human | Esophagus | ESCC | 1.98e-04 | 2.74e-01 | 0.0662 |
| 11338 | U2AF2 | LZE22D1 | Human | Esophagus | HGIN | 1.03e-07 | 1.60e-01 | 0.0595 |
| 11338 | U2AF2 | LZE24T | Human | Esophagus | ESCC | 8.39e-16 | 5.58e-01 | 0.0596 |
| 11338 | U2AF2 | LZE21T | Human | Esophagus | ESCC | 7.53e-04 | 4.75e-01 | 0.0655 |
| 11338 | U2AF2 | LZE6T | Human | Esophagus | ESCC | 4.85e-05 | 3.62e-01 | 0.0845 |
| 11338 | U2AF2 | P1T-E | Human | Esophagus | ESCC | 3.91e-12 | 6.70e-01 | 0.0875 |
| 11338 | U2AF2 | P2T-E | Human | Esophagus | ESCC | 8.55e-41 | 8.89e-01 | 0.1177 |
| 11338 | U2AF2 | P4T-E | Human | Esophagus | ESCC | 3.92e-29 | 7.99e-01 | 0.1323 |
| 11338 | U2AF2 | P5T-E | Human | Esophagus | ESCC | 9.25e-21 | 3.75e-01 | 0.1327 |
| 11338 | U2AF2 | P8T-E | Human | Esophagus | ESCC | 9.44e-64 | 1.28e+00 | 0.0889 |
| 11338 | U2AF2 | P9T-E | Human | Esophagus | ESCC | 1.00e-14 | 4.01e-01 | 0.1131 |
| 11338 | U2AF2 | P10T-E | Human | Esophagus | ESCC | 1.84e-48 | 9.72e-01 | 0.116 |
| 11338 | U2AF2 | P11T-E | Human | Esophagus | ESCC | 1.39e-15 | 9.07e-01 | 0.1426 |
| 11338 | U2AF2 | P12T-E | Human | Esophagus | ESCC | 2.63e-32 | 6.67e-01 | 0.1122 |
| 11338 | U2AF2 | P15T-E | Human | Esophagus | ESCC | 1.31e-39 | 9.50e-01 | 0.1149 |
| 11338 | U2AF2 | P16T-E | Human | Esophagus | ESCC | 8.37e-41 | 7.89e-01 | 0.1153 |
| Page: 1 2 3 4 5 6 7 |
| Tissue | Expression Dynamics | Abbreviation |
| Esophagus | 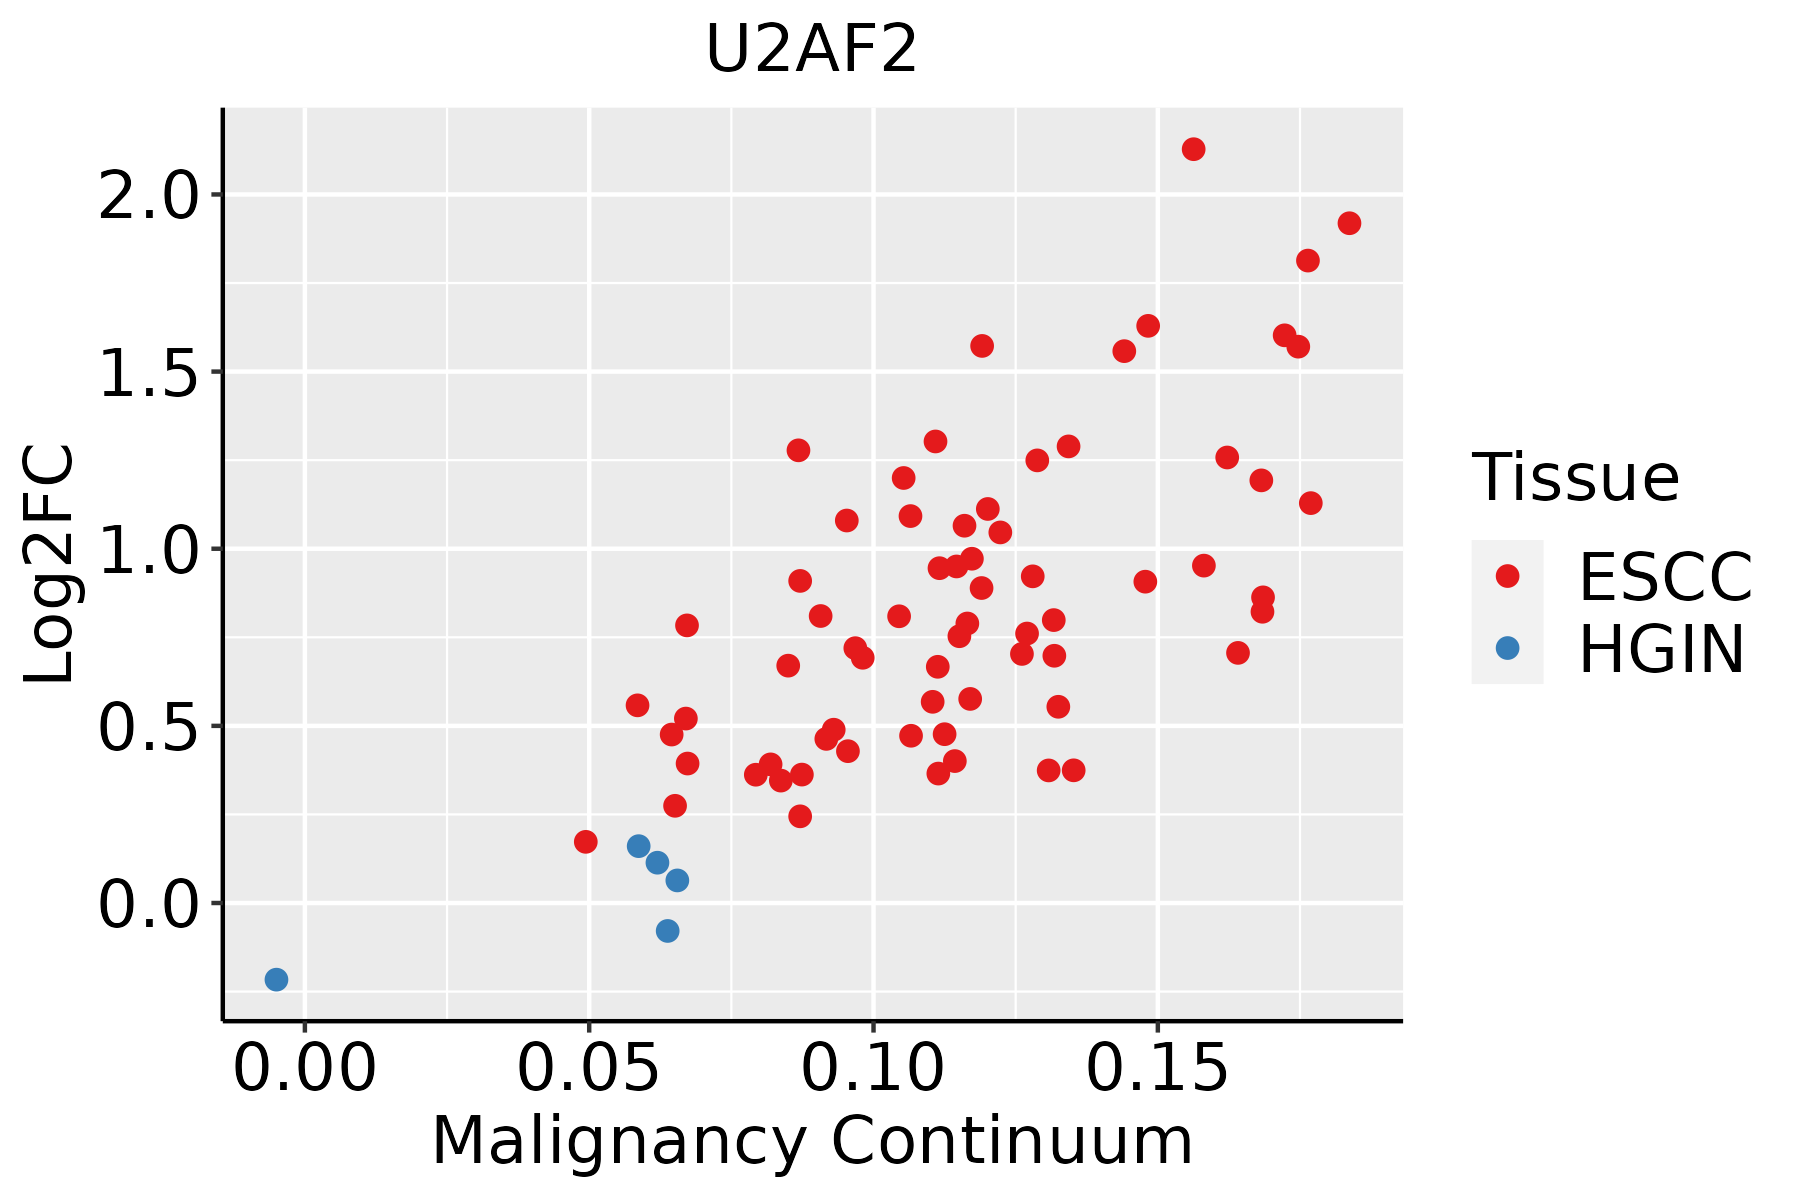 | ESCC: Esophageal squamous cell carcinoma |
| HGIN: High-grade intraepithelial neoplasias | ||
| LGIN: Low-grade intraepithelial neoplasias | ||
| Liver |  | HCC: Hepatocellular carcinoma |
| NAFLD: Non-alcoholic fatty liver disease | ||
| Lung | 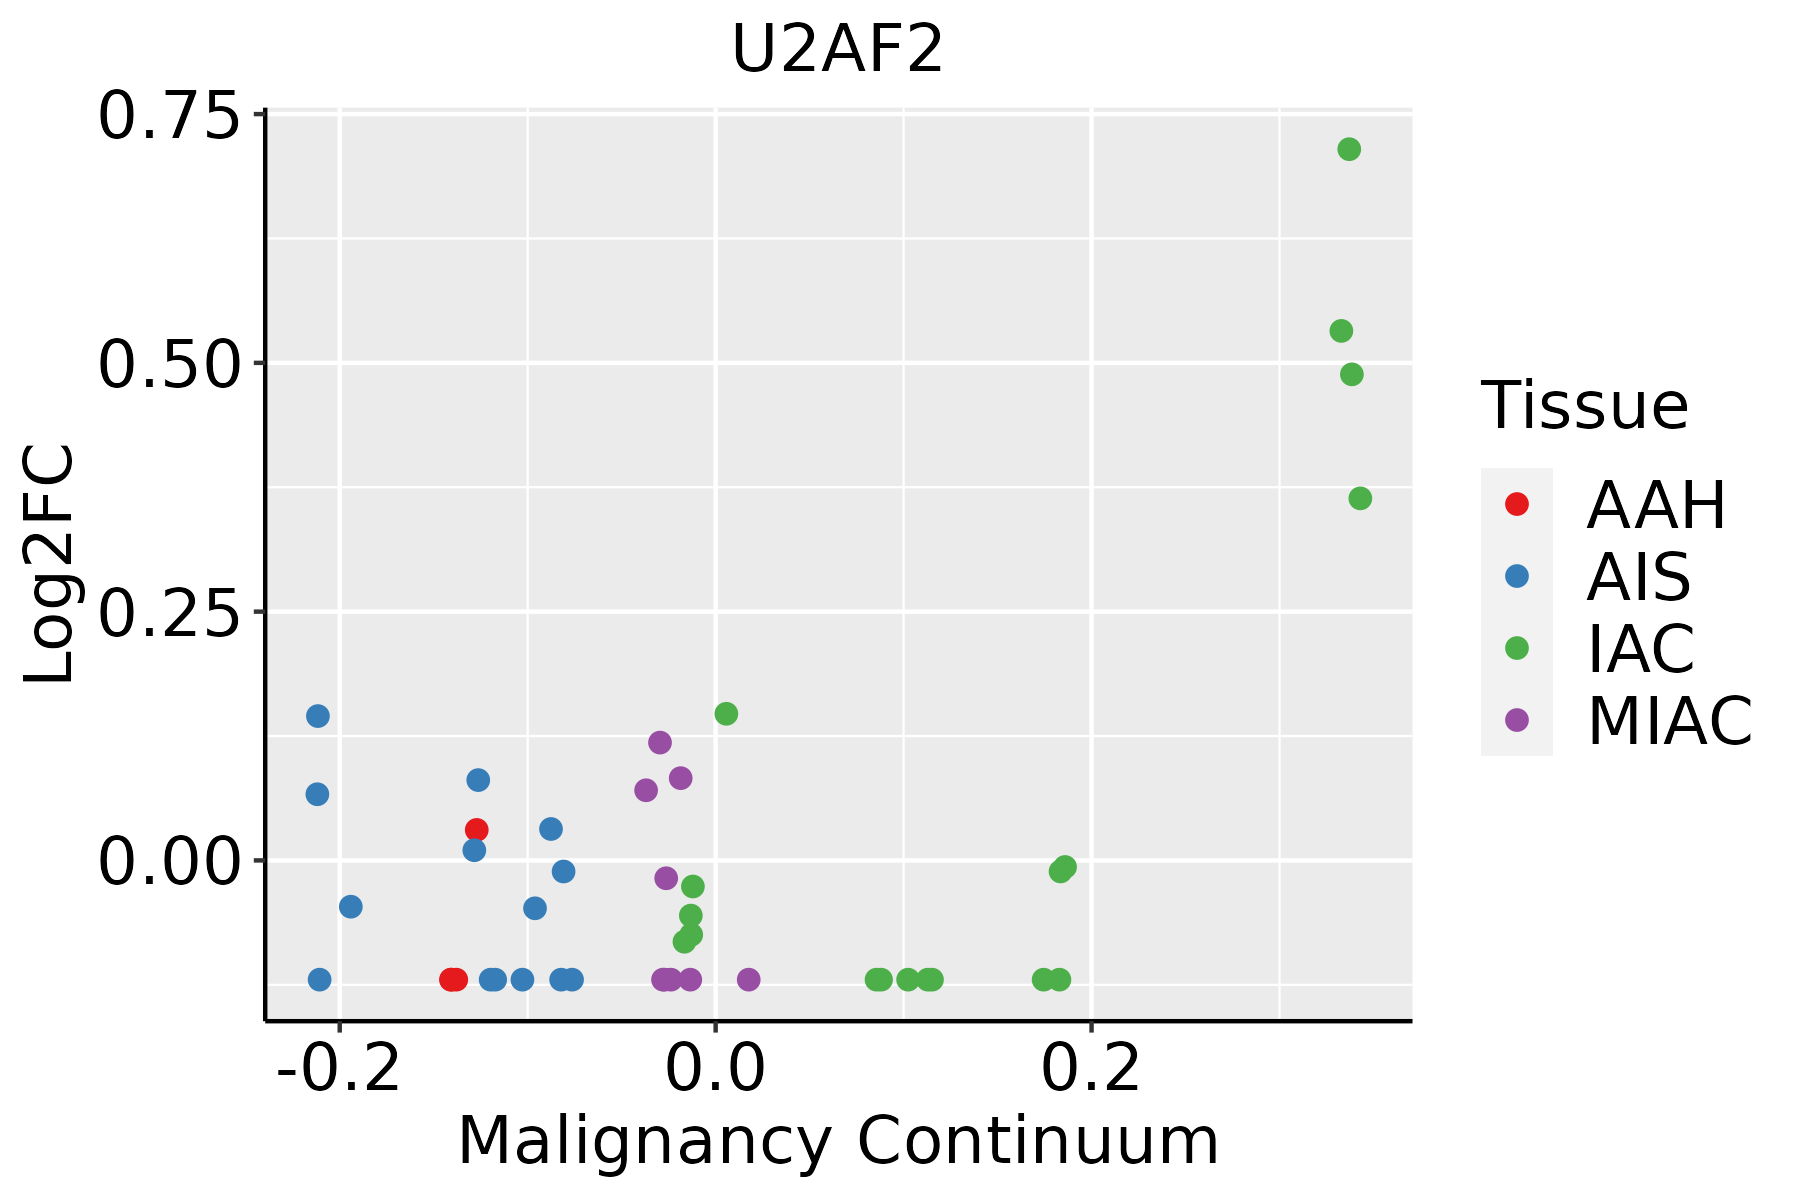 | AAH: Atypical adenomatous hyperplasia |
| AIS: Adenocarcinoma in situ | ||
| IAC: Invasive lung adenocarcinoma | ||
| MIA: Minimally invasive adenocarcinoma | ||
| Oral Cavity |  | EOLP: Erosive Oral lichen planus |
| LP: leukoplakia | ||
| NEOLP: Non-erosive oral lichen planus | ||
| OSCC: Oral squamous cell carcinoma | ||
| Skin | 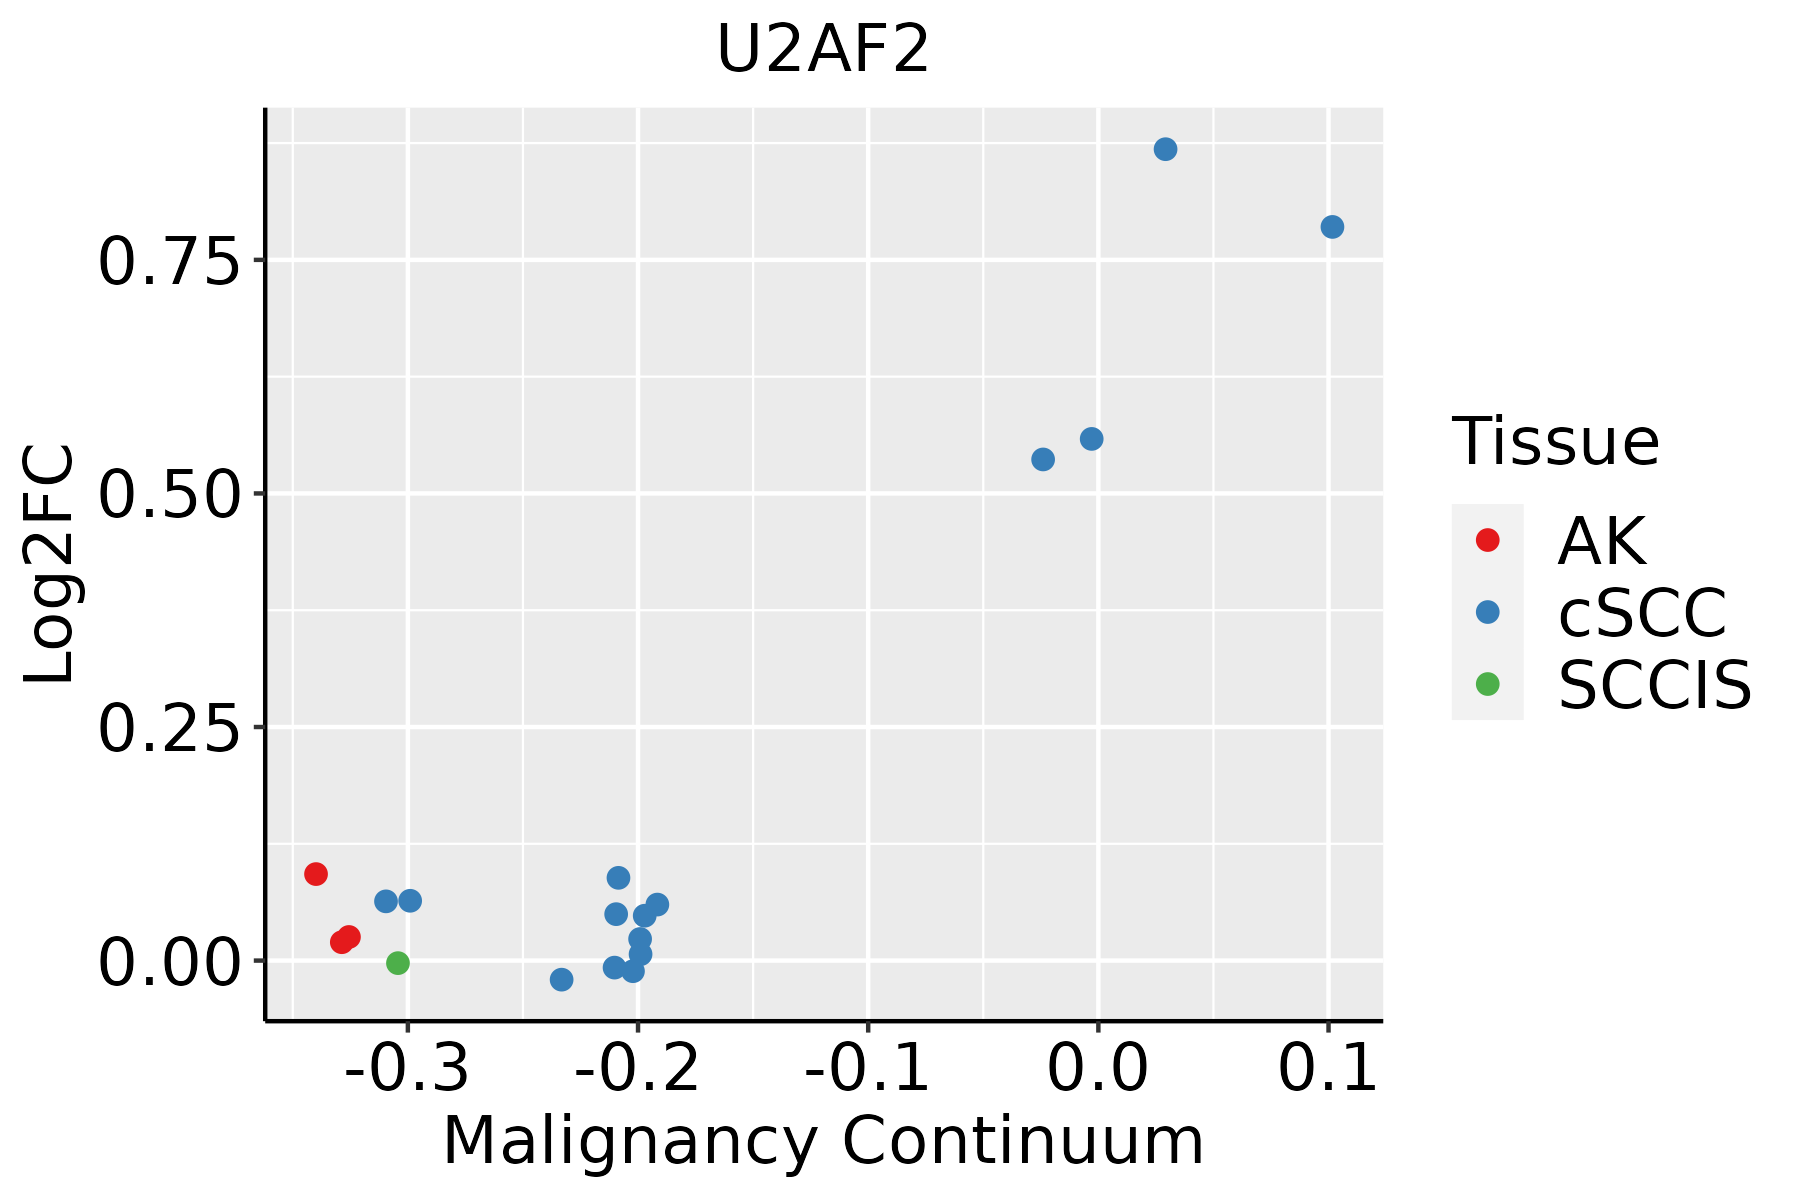 | AK: Actinic keratosis |
| cSCC: Cutaneous squamous cell carcinoma | ||
| SCCIS:squamous cell carcinoma in situ | ||
| Thyroid | 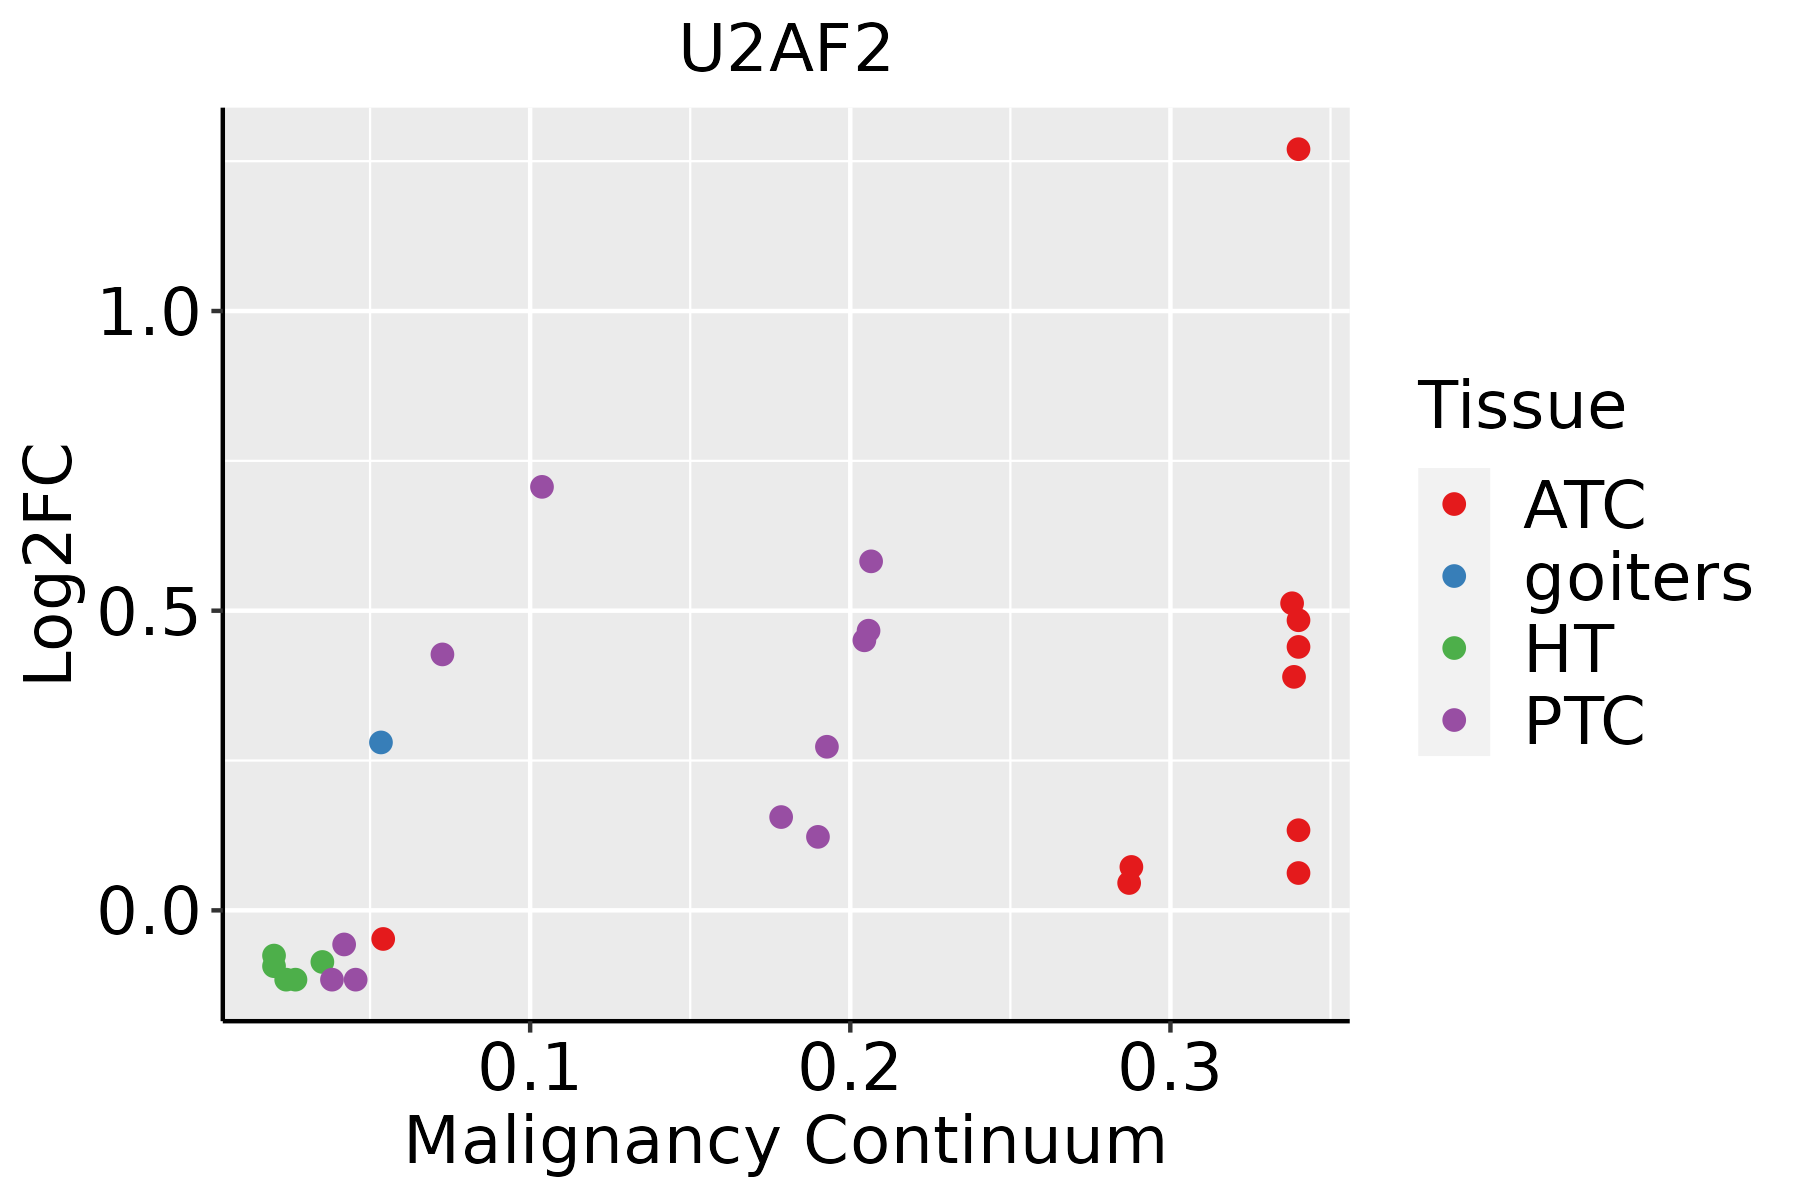 | ATC: Anaplastic thyroid cancer |
| HT: Hashimoto's thyroiditis | ||
| PTC: Papillary thyroid cancer |
| ∗log2FC in expression of this searched gene in stem-like cells from each diseased tissue sample relative to stem-like cells in normal samples in each tissue plotted against the malignancy continuum. Samples are colored based on if they are from different disease stage. |
Top |
Malignant transformation related pathway analysis |
| Find out the enriched GO biological processes and KEGG pathways involved in transition from healthy to precancer to cancer |
| Tissue | Disease Stage | Enriched GO biological Processes |
| Colorectum | AD |  |
| Colorectum | SER |  |
| Colorectum | MSS |  |
| Colorectum | MSI-H |  |
| Colorectum | FAP |  |
| ∗Top 15 enriched GO BP terms are showed in the bar plot of each disease state in each tissue. Each row represents a significant GO biological process which is colored according to the -log10(p.adjust). |
| Page: 1 2 3 4 5 6 7 8 9 |
| GO ID | Tissue | Disease Stage | Description | Gene Ratio | Bg Ratio | pvalue | p.adjust | Count |
| GO:000838026 | Esophagus | HGIN | RNA splicing | 160/2587 | 434/18723 | 3.74e-34 | 1.12e-30 | 160 |
| GO:000037520 | Esophagus | HGIN | RNA splicing, via transesterification reactions | 115/2587 | 324/18723 | 3.16e-23 | 3.80e-20 | 115 |
| GO:000037720 | Esophagus | HGIN | RNA splicing, via transesterification reactions with bulged adenosine as nucleophile | 113/2587 | 320/18723 | 1.24e-22 | 9.26e-20 | 113 |
| GO:000039820 | Esophagus | HGIN | mRNA splicing, via spliceosome | 113/2587 | 320/18723 | 1.24e-22 | 9.26e-20 | 113 |
| GO:004348427 | Esophagus | HGIN | regulation of RNA splicing | 59/2587 | 148/18723 | 3.61e-15 | 7.22e-13 | 59 |
| GO:190331120 | Esophagus | HGIN | regulation of mRNA metabolic process | 91/2587 | 288/18723 | 5.06e-15 | 9.78e-13 | 91 |
| GO:005068419 | Esophagus | HGIN | regulation of mRNA processing | 55/2587 | 137/18723 | 2.17e-14 | 3.94e-12 | 55 |
| GO:190332027 | Esophagus | HGIN | regulation of protein modification by small protein conjugation or removal | 78/2587 | 242/18723 | 1.40e-13 | 2.26e-11 | 78 |
| GO:004802426 | Esophagus | HGIN | regulation of mRNA splicing, via spliceosome | 42/2587 | 101/18723 | 6.35e-12 | 7.78e-10 | 42 |
| GO:003139627 | Esophagus | HGIN | regulation of protein ubiquitination | 64/2587 | 210/18723 | 3.02e-10 | 2.71e-08 | 64 |
| GO:190332127 | Esophagus | HGIN | negative regulation of protein modification by small protein conjugation or removal | 33/2587 | 95/18723 | 2.07e-07 | 9.95e-06 | 33 |
| GO:003139727 | Esophagus | HGIN | negative regulation of protein ubiquitination | 30/2587 | 83/18723 | 2.72e-07 | 1.28e-05 | 30 |
| GO:003312020 | Esophagus | HGIN | positive regulation of RNA splicing | 17/2587 | 37/18723 | 2.33e-06 | 8.37e-05 | 17 |
| GO:190331226 | Esophagus | HGIN | negative regulation of mRNA metabolic process | 29/2587 | 92/18723 | 1.01e-05 | 2.92e-04 | 29 |
| GO:003311926 | Esophagus | HGIN | negative regulation of RNA splicing | 12/2587 | 25/18723 | 4.25e-05 | 1.04e-03 | 12 |
| GO:005068610 | Esophagus | HGIN | negative regulation of mRNA processing | 12/2587 | 29/18723 | 2.48e-04 | 4.38e-03 | 12 |
| GO:004802510 | Esophagus | HGIN | negative regulation of mRNA splicing, via spliceosome | 9/2587 | 20/18723 | 7.18e-04 | 9.60e-03 | 9 |
| GO:0008380111 | Esophagus | ESCC | RNA splicing | 336/8552 | 434/18723 | 1.74e-42 | 3.67e-39 | 336 |
| GO:0000375111 | Esophagus | ESCC | RNA splicing, via transesterification reactions | 248/8552 | 324/18723 | 3.05e-30 | 1.49e-27 | 248 |
| GO:0000377111 | Esophagus | ESCC | RNA splicing, via transesterification reactions with bulged adenosine as nucleophile | 244/8552 | 320/18723 | 2.52e-29 | 1.07e-26 | 244 |
| Page: 1 2 3 4 5 6 7 8 9 10 |
| Pathway ID | Tissue | Disease Stage | Description | Gene Ratio | Bg Ratio | pvalue | p.adjust | qvalue | Count |
| hsa0304018 | Esophagus | HGIN | Spliceosome | 79/1383 | 217/8465 | 3.22e-13 | 7.00e-12 | 5.56e-12 | 79 |
| hsa0304019 | Esophagus | HGIN | Spliceosome | 79/1383 | 217/8465 | 3.22e-13 | 7.00e-12 | 5.56e-12 | 79 |
| hsa0304027 | Esophagus | ESCC | Spliceosome | 128/4205 | 217/8465 | 3.31e-03 | 8.79e-03 | 4.50e-03 | 128 |
| hsa0304037 | Esophagus | ESCC | Spliceosome | 128/4205 | 217/8465 | 3.31e-03 | 8.79e-03 | 4.50e-03 | 128 |
| hsa030407 | Liver | Cirrhotic | Spliceosome | 102/2530 | 217/8465 | 5.69e-08 | 9.47e-07 | 5.84e-07 | 102 |
| hsa0304012 | Liver | Cirrhotic | Spliceosome | 102/2530 | 217/8465 | 5.69e-08 | 9.47e-07 | 5.84e-07 | 102 |
| hsa0304022 | Liver | HCC | Spliceosome | 122/4020 | 217/8465 | 5.55e-03 | 1.60e-02 | 8.91e-03 | 122 |
| hsa0304032 | Liver | HCC | Spliceosome | 122/4020 | 217/8465 | 5.55e-03 | 1.60e-02 | 8.91e-03 | 122 |
| hsa0304016 | Oral cavity | OSCC | Spliceosome | 123/3704 | 217/8465 | 7.21e-05 | 2.74e-04 | 1.40e-04 | 123 |
| hsa0304017 | Oral cavity | OSCC | Spliceosome | 123/3704 | 217/8465 | 7.21e-05 | 2.74e-04 | 1.40e-04 | 123 |
| hsa0304026 | Oral cavity | LP | Spliceosome | 106/2418 | 217/8465 | 1.30e-10 | 2.40e-09 | 1.55e-09 | 106 |
| hsa0304036 | Oral cavity | LP | Spliceosome | 106/2418 | 217/8465 | 1.30e-10 | 2.40e-09 | 1.55e-09 | 106 |
| Page: 1 |
Top |
Cell-cell communication analysis |
| Identification of potential cell-cell interactions between two cell types and their ligand-receptor pairs for different disease states |
| Ligand | Receptor | LRpair | Pathway | Tissue | Disease Stage |
| Page: 1 |
Top |
Single-cell gene regulatory network inference analysis |
| Find out the significant the regulons (TFs) and the target genes of each regulon across cell types for different disease states |
| TF | Cell Type | Tissue | Disease Stage | Target Gene | RSS | Regulon Activity |
| ∗The dot plots of a searched regulon are shown for all cell subpopulations in each disease state of each tissue based on the regulon specific score inferred using pySCENIC and by calculating the average expression. |
| Page: 1 |
Top |
Somatic mutation of malignant transformation related genes |
| Annotation of somatic variants for genes involved in malignant transformation |
| Hugo Symbol | Variant Class | Variant Classification | dbSNP RS | HGVSc | HGVSp | HGVSp Short | SWISSPROT | BIOTYPE | SIFT | PolyPhen | Tumor Sample Barcode | Tissue | Histology | Sex | Age | Stage | Therapy Types | Drugs | Outcome |
| U2AF2 | SNV | Missense_Mutation | c.290N>T | p.Pro97Leu | p.P97L | P26368 | protein_coding | tolerated(0.09) | benign(0.005) | TCGA-E2-A1LG-01 | Breast | breast invasive carcinoma | Female | <65 | I/II | Chemotherapy | doxorubicin | SD | |
| U2AF2 | SNV | Missense_Mutation | novel | c.457N>A | p.Val153Met | p.V153M | P26368 | protein_coding | deleterious(0.03) | probably_damaging(0.997) | TCGA-C5-A8YR-01 | Cervix | cervical & endocervical cancer | Female | <65 | I/II | Unknown | Unknown | PD |
| U2AF2 | SNV | Missense_Mutation | c.956G>T | p.Gly319Val | p.G319V | P26368 | protein_coding | deleterious(0) | probably_damaging(0.983) | TCGA-DS-A0VN-01 | Cervix | cervical & endocervical cancer | Female | <65 | I/II | Chemotherapy | cisplatin | SD | |
| U2AF2 | SNV | Missense_Mutation | c.965N>A | p.Gly322Asp | p.G322D | P26368 | protein_coding | deleterious(0.02) | probably_damaging(0.996) | TCGA-A6-5665-01 | Colorectum | colon adenocarcinoma | Female | >=65 | I/II | Unknown | Unknown | PD | |
| U2AF2 | SNV | Missense_Mutation | c.902G>A | p.Gly301Asp | p.G301D | P26368 | protein_coding | deleterious(0) | probably_damaging(1) | TCGA-AA-3672-01 | Colorectum | colon adenocarcinoma | Female | >=65 | III/IV | Unknown | Unknown | SD | |
| U2AF2 | SNV | Missense_Mutation | c.449G>A | p.Arg150His | p.R150H | P26368 | protein_coding | deleterious(0) | probably_damaging(0.998) | TCGA-AA-3684-01 | Colorectum | colon adenocarcinoma | Female | >=65 | III/IV | Unknown | Unknown | SD | |
| U2AF2 | SNV | Missense_Mutation | c.1207N>T | p.Arg403Trp | p.R403W | P26368 | protein_coding | deleterious(0) | probably_damaging(0.966) | TCGA-F4-6856-01 | Colorectum | colon adenocarcinoma | Male | <65 | I/II | Ancillary | leucovorin | CR | |
| U2AF2 | SNV | Missense_Mutation | c.876N>T | p.Lys292Asn | p.K292N | P26368 | protein_coding | deleterious(0.01) | probably_damaging(0.992) | TCGA-AG-A002-01 | Colorectum | rectum adenocarcinoma | Male | <65 | I/II | Unknown | Unknown | SD | |
| U2AF2 | SNV | Missense_Mutation | c.1414N>T | p.Arg472Trp | p.R472W | P26368 | protein_coding | deleterious(0) | probably_damaging(0.945) | TCGA-CL-5917-01 | Colorectum | rectum adenocarcinoma | Female | >=65 | III/IV | Unknown | Unknown | SD | |
| U2AF2 | insertion | Frame_Shift_Ins | rs758316280 | c.524_525insG | p.Leu178AlafsTer15 | p.L178Afs*15 | P26368 | protein_coding | TCGA-AD-A5EJ-01 | Colorectum | colon adenocarcinoma | Female | >=65 | I/II | Unknown | Unknown | SD |
| Page: 1 2 3 4 5 6 |
Top |
Related drugs of malignant transformation related genes |
| Identification of chemicals and drugs interact with genes involved in malignant transfromation |
| (DGIdb 4.0) |
| Entrez ID | Symbol | Category | Interaction Types | Drug Claim Name | Drug Name | PMIDs |
| Page: 1 |

Copyright 2023-Present -The University of Texas Health Science Center at Houston |