
|
|||||
|
 | |
| |
| |
| |
| |
| |
|
Gene: TYW3 |
Gene summary for TYW3 |
| Gene information | Species | Human | Gene symbol | TYW3 | Gene ID | 127253 |
| Gene name | tRNA-yW synthesizing protein 3 homolog | |
| Gene Alias | C1orf171 | |
| Cytomap | 1p31.1 | |
| Gene Type | protein-coding | GO ID | GO:0001510 | UniProtAcc | Q6IPR3 |
Top |
Malignant transformation analysis |
| Identification of the aberrant gene expression in precancerous and cancerous lesions by comparing the gene expression of stem-like cells in diseased tissues with normal stem cells |
| Entrez ID | Symbol | Replicates | Species | Organ | Tissue | Adj P-value | Log2FC | Malignancy |
| 127253 | TYW3 | LZE4T | Human | Esophagus | ESCC | 1.60e-06 | 2.79e-01 | 0.0811 |
| 127253 | TYW3 | LZE8T | Human | Esophagus | ESCC | 7.47e-03 | 2.45e-01 | 0.067 |
| 127253 | TYW3 | LZE22T | Human | Esophagus | ESCC | 6.09e-03 | 1.88e-01 | 0.068 |
| 127253 | TYW3 | LZE24T | Human | Esophagus | ESCC | 2.65e-04 | 1.80e-01 | 0.0596 |
| 127253 | TYW3 | P2T-E | Human | Esophagus | ESCC | 1.70e-50 | 8.90e-01 | 0.1177 |
| 127253 | TYW3 | P4T-E | Human | Esophagus | ESCC | 2.62e-26 | 6.67e-01 | 0.1323 |
| 127253 | TYW3 | P5T-E | Human | Esophagus | ESCC | 4.07e-27 | 4.87e-01 | 0.1327 |
| 127253 | TYW3 | P8T-E | Human | Esophagus | ESCC | 2.03e-19 | 2.11e-01 | 0.0889 |
| 127253 | TYW3 | P9T-E | Human | Esophagus | ESCC | 1.19e-12 | 3.97e-01 | 0.1131 |
| 127253 | TYW3 | P10T-E | Human | Esophagus | ESCC | 4.97e-35 | 5.92e-01 | 0.116 |
| 127253 | TYW3 | P11T-E | Human | Esophagus | ESCC | 3.88e-07 | 4.81e-01 | 0.1426 |
| 127253 | TYW3 | P12T-E | Human | Esophagus | ESCC | 2.08e-23 | 4.29e-01 | 0.1122 |
| 127253 | TYW3 | P15T-E | Human | Esophagus | ESCC | 9.51e-26 | 5.65e-01 | 0.1149 |
| 127253 | TYW3 | P16T-E | Human | Esophagus | ESCC | 2.47e-27 | 4.92e-01 | 0.1153 |
| 127253 | TYW3 | P17T-E | Human | Esophagus | ESCC | 1.38e-04 | 3.23e-01 | 0.1278 |
| 127253 | TYW3 | P19T-E | Human | Esophagus | ESCC | 2.16e-03 | 5.05e-01 | 0.1662 |
| 127253 | TYW3 | P20T-E | Human | Esophagus | ESCC | 3.00e-20 | 4.69e-01 | 0.1124 |
| 127253 | TYW3 | P21T-E | Human | Esophagus | ESCC | 7.51e-42 | 9.03e-01 | 0.1617 |
| 127253 | TYW3 | P22T-E | Human | Esophagus | ESCC | 4.98e-25 | 3.01e-01 | 0.1236 |
| 127253 | TYW3 | P23T-E | Human | Esophagus | ESCC | 2.70e-16 | 4.45e-01 | 0.108 |
| Page: 1 2 3 4 5 6 |
| Tissue | Expression Dynamics | Abbreviation |
| Esophagus | 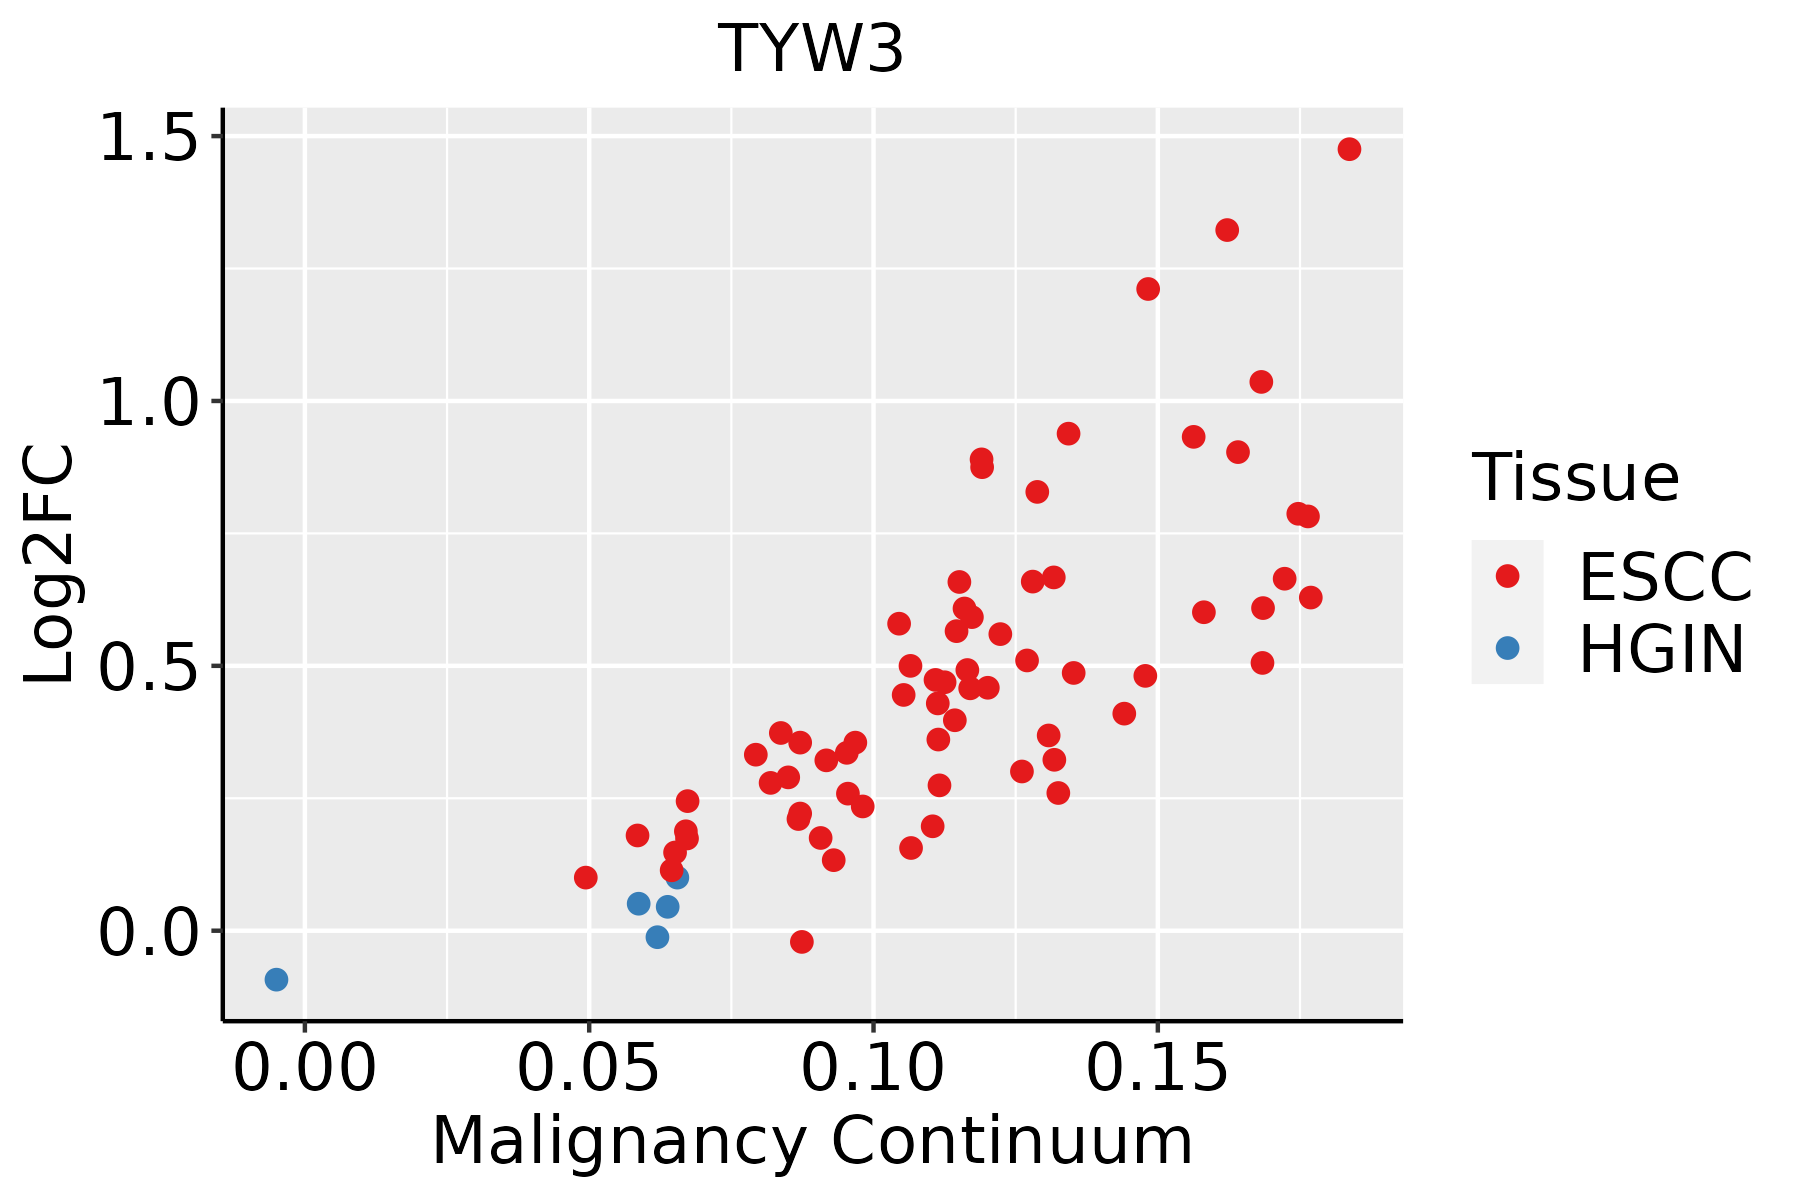 | ESCC: Esophageal squamous cell carcinoma |
| HGIN: High-grade intraepithelial neoplasias | ||
| LGIN: Low-grade intraepithelial neoplasias | ||
| Liver | 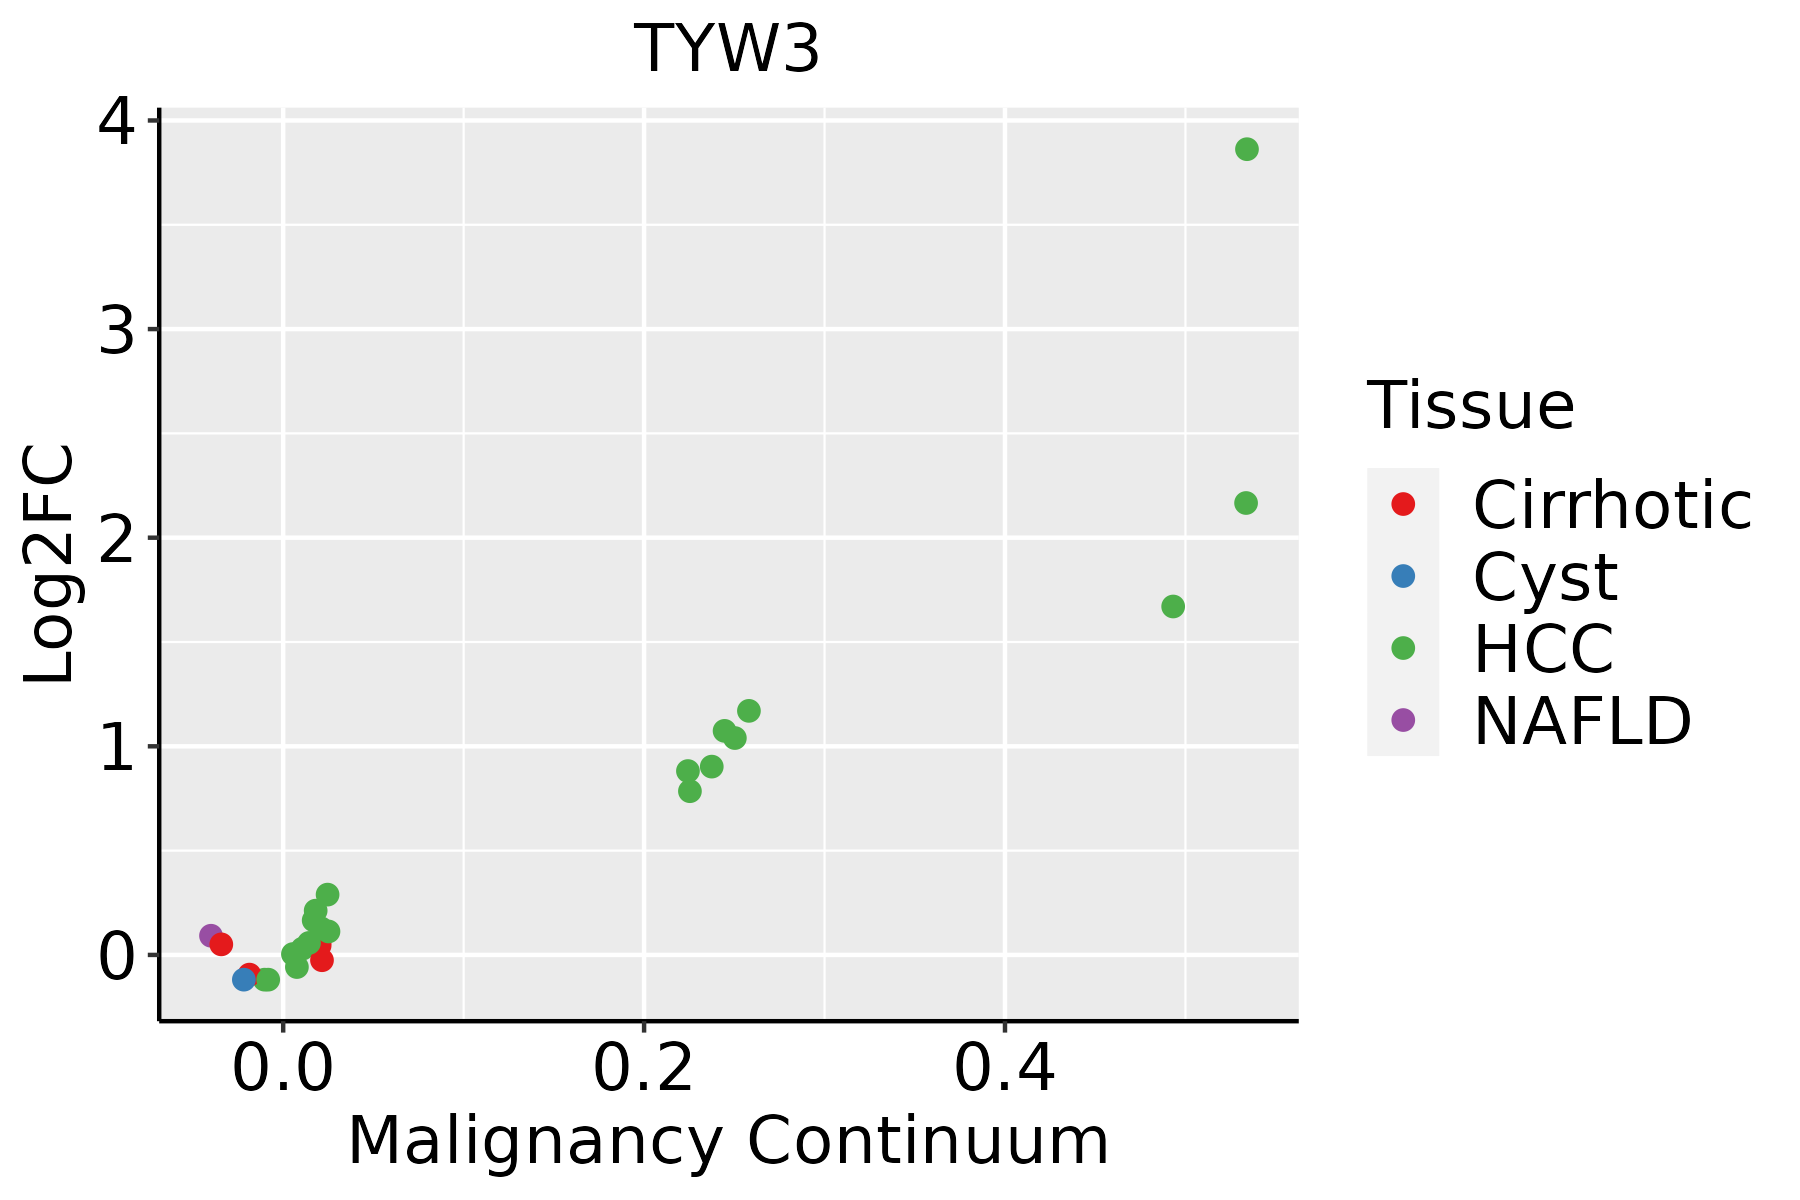 | HCC: Hepatocellular carcinoma |
| NAFLD: Non-alcoholic fatty liver disease | ||
| Oral Cavity | 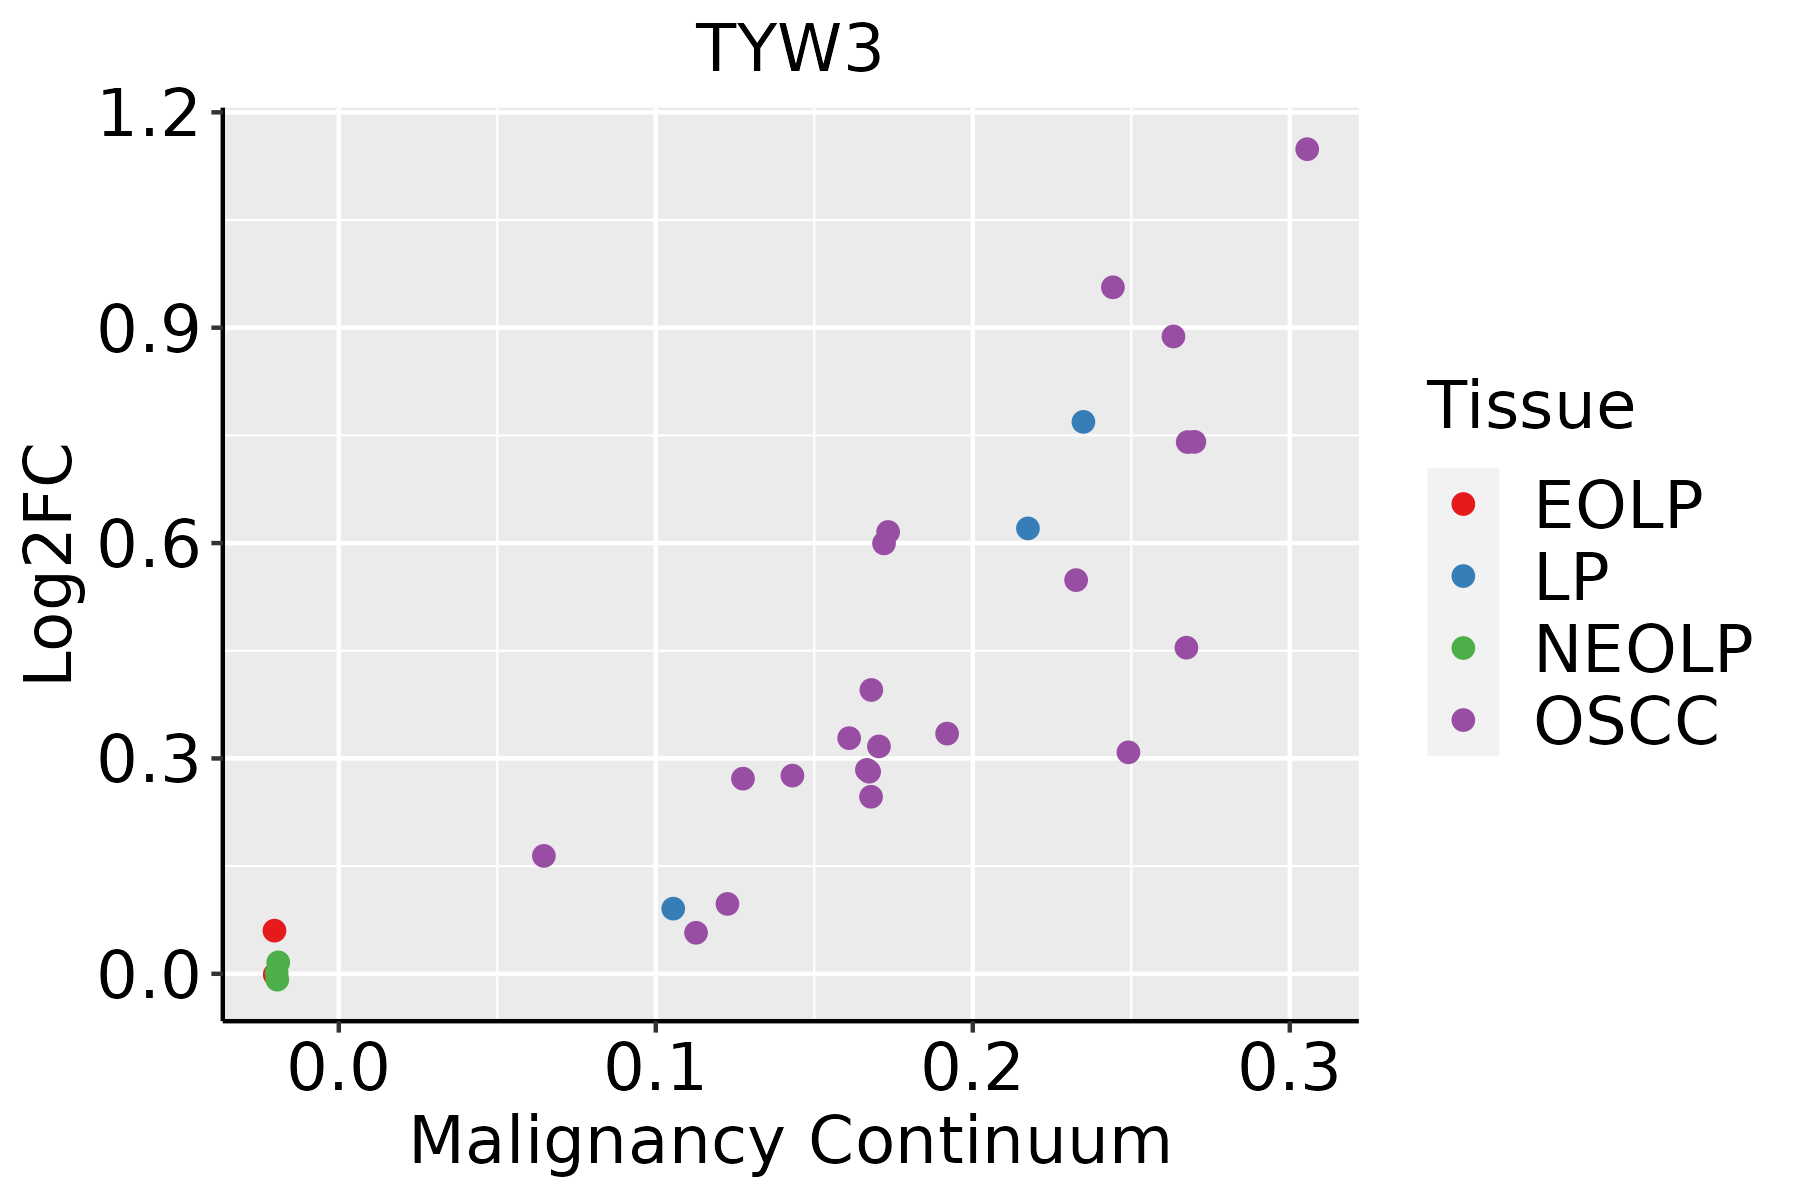 | EOLP: Erosive Oral lichen planus |
| LP: leukoplakia | ||
| NEOLP: Non-erosive oral lichen planus | ||
| OSCC: Oral squamous cell carcinoma | ||
| Skin | 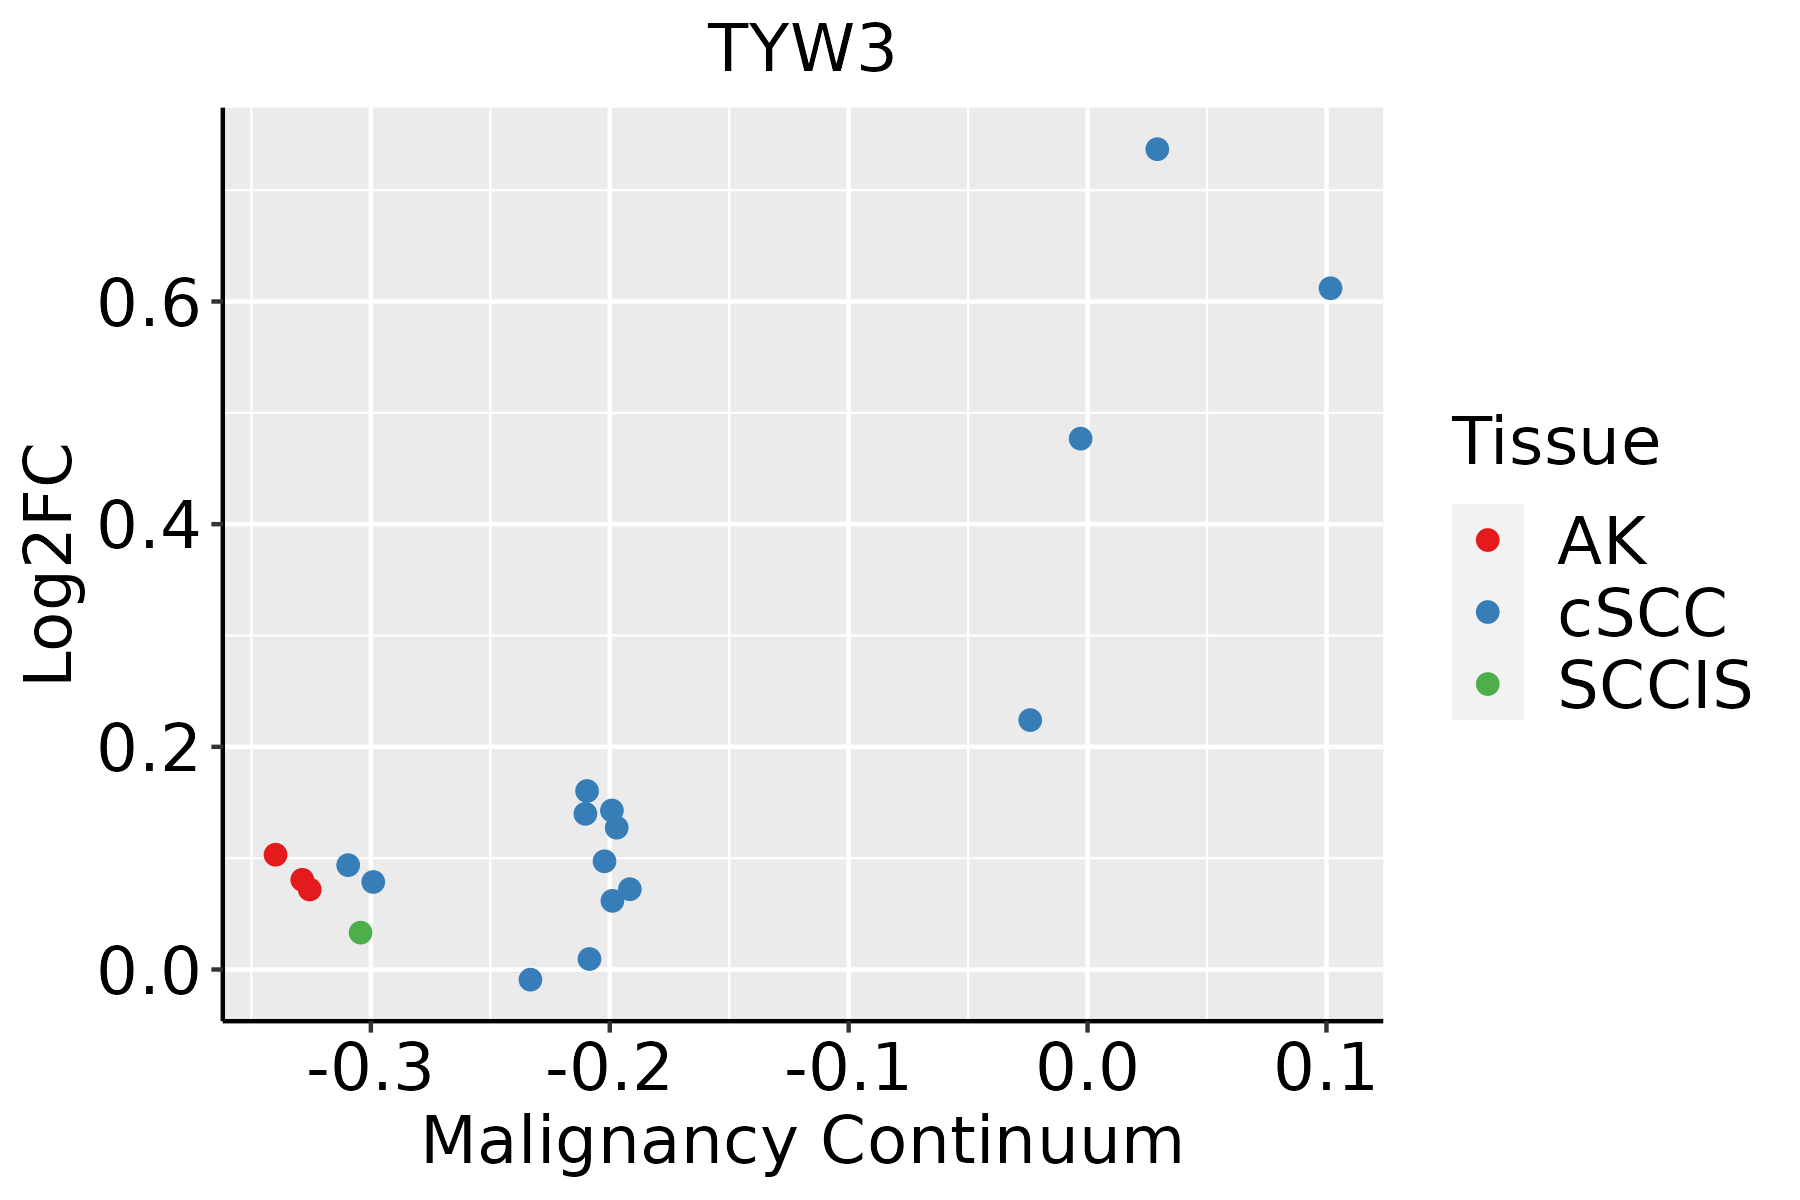 | AK: Actinic keratosis |
| cSCC: Cutaneous squamous cell carcinoma | ||
| SCCIS:squamous cell carcinoma in situ | ||
| Thyroid |  | ATC: Anaplastic thyroid cancer |
| HT: Hashimoto's thyroiditis | ||
| PTC: Papillary thyroid cancer |
| ∗log2FC in expression of this searched gene in stem-like cells from each diseased tissue sample relative to stem-like cells in normal samples in each tissue plotted against the malignancy continuum. Samples are colored based on if they are from different disease stage. |
Top |
Malignant transformation related pathway analysis |
| Find out the enriched GO biological processes and KEGG pathways involved in transition from healthy to precancer to cancer |
| Tissue | Disease Stage | Enriched GO biological Processes |
| Colorectum | AD |  |
| Colorectum | SER |  |
| Colorectum | MSS |  |
| Colorectum | MSI-H |  |
| Colorectum | FAP |  |
| ∗Top 15 enriched GO BP terms are showed in the bar plot of each disease state in each tissue. Each row represents a significant GO biological process which is colored according to the -log10(p.adjust). |
| Page: 1 2 3 4 5 6 7 8 9 |
| GO ID | Tissue | Disease Stage | Description | Gene Ratio | Bg Ratio | pvalue | p.adjust | Count |
| GO:003447015 | Esophagus | ESCC | ncRNA processing | 300/8552 | 395/18723 | 3.09e-35 | 3.26e-32 | 300 |
| GO:003466012 | Esophagus | ESCC | ncRNA metabolic process | 346/8552 | 485/18723 | 4.35e-31 | 2.51e-28 | 346 |
| GO:00434143 | Esophagus | ESCC | macromolecule methylation | 199/8552 | 316/18723 | 3.44e-10 | 9.57e-09 | 199 |
| GO:00080333 | Esophagus | ESCC | tRNA processing | 92/8552 | 127/18723 | 7.83e-10 | 1.93e-08 | 92 |
| GO:00063992 | Esophagus | ESCC | tRNA metabolic process | 122/8552 | 179/18723 | 9.03e-10 | 2.19e-08 | 122 |
| GO:00322592 | Esophagus | ESCC | methylation | 222/8552 | 364/18723 | 2.26e-09 | 5.09e-08 | 222 |
| GO:00094512 | Esophagus | ESCC | RNA modification | 114/8552 | 167/18723 | 2.76e-09 | 6.04e-08 | 114 |
| GO:00015101 | Esophagus | ESCC | RNA methylation | 58/8552 | 83/18723 | 6.87e-06 | 6.94e-05 | 58 |
| GO:00064002 | Esophagus | ESCC | tRNA modification | 62/8552 | 90/18723 | 7.02e-06 | 7.04e-05 | 62 |
| GO:00304881 | Esophagus | ESCC | tRNA methylation | 30/8552 | 41/18723 | 3.27e-04 | 1.93e-03 | 30 |
| GO:00344702 | Liver | HCC | ncRNA processing | 293/7958 | 395/18723 | 4.26e-38 | 6.76e-35 | 293 |
| GO:00346601 | Liver | HCC | ncRNA metabolic process | 332/7958 | 485/18723 | 1.48e-31 | 7.80e-29 | 332 |
| GO:0008033 | Liver | HCC | tRNA processing | 87/7958 | 127/18723 | 2.66e-09 | 7.23e-08 | 87 |
| GO:00434141 | Liver | HCC | macromolecule methylation | 183/7958 | 316/18723 | 2.00e-08 | 4.72e-07 | 183 |
| GO:0032259 | Liver | HCC | methylation | 206/7958 | 364/18723 | 3.35e-08 | 7.53e-07 | 206 |
| GO:0006399 | Liver | HCC | tRNA metabolic process | 108/7958 | 179/18723 | 1.07e-06 | 1.59e-05 | 108 |
| GO:0009451 | Liver | HCC | RNA modification | 101/7958 | 167/18723 | 2.02e-06 | 2.78e-05 | 101 |
| GO:0006400 | Liver | HCC | tRNA modification | 60/7958 | 90/18723 | 3.09e-06 | 4.09e-05 | 60 |
| GO:0001510 | Liver | HCC | RNA methylation | 53/7958 | 83/18723 | 6.96e-05 | 6.29e-04 | 53 |
| GO:0030488 | Liver | HCC | tRNA methylation | 29/7958 | 41/18723 | 2.38e-04 | 1.79e-03 | 29 |
| Page: 1 2 3 |
| Pathway ID | Tissue | Disease Stage | Description | Gene Ratio | Bg Ratio | pvalue | p.adjust | qvalue | Count |
| Page: 1 |
Top |
Cell-cell communication analysis |
| Identification of potential cell-cell interactions between two cell types and their ligand-receptor pairs for different disease states |
| Ligand | Receptor | LRpair | Pathway | Tissue | Disease Stage |
| Page: 1 |
Top |
Single-cell gene regulatory network inference analysis |
| Find out the significant the regulons (TFs) and the target genes of each regulon across cell types for different disease states |
| TF | Cell Type | Tissue | Disease Stage | Target Gene | RSS | Regulon Activity |
| ∗The dot plots of a searched regulon are shown for all cell subpopulations in each disease state of each tissue based on the regulon specific score inferred using pySCENIC and by calculating the average expression. |
| Page: 1 |
Top |
Somatic mutation of malignant transformation related genes |
| Annotation of somatic variants for genes involved in malignant transformation |
| Hugo Symbol | Variant Class | Variant Classification | dbSNP RS | HGVSc | HGVSp | HGVSp Short | SWISSPROT | BIOTYPE | SIFT | PolyPhen | Tumor Sample Barcode | Tissue | Histology | Sex | Age | Stage | Therapy Types | Drugs | Outcome |
| TYW3 | SNV | Missense_Mutation | c.589G>A | p.Glu197Lys | p.E197K | Q6IPR3 | protein_coding | tolerated(0.17) | benign(0.015) | TCGA-AO-A0JB-01 | Breast | breast invasive carcinoma | Female | <65 | III/IV | Chemotherapy | cyclophosphamide | SD | |
| TYW3 | SNV | Missense_Mutation | novel | c.48N>A | p.Ser16Arg | p.S16R | Q6IPR3 | protein_coding | tolerated(0.16) | benign(0.1) | TCGA-D8-A27G-01 | Breast | breast invasive carcinoma | Female | >=65 | I/II | Unknown | Unknown | SD |
| TYW3 | SNV | Missense_Mutation | c.624N>G | p.Ile208Met | p.I208M | Q6IPR3 | protein_coding | tolerated(0.11) | benign(0.339) | TCGA-E2-A1AZ-01 | Breast | breast invasive carcinoma | Female | <65 | I/II | Chemotherapy | adriamycin | SD | |
| TYW3 | SNV | Missense_Mutation | c.64N>T | p.Arg22Trp | p.R22W | Q6IPR3 | protein_coding | deleterious(0) | probably_damaging(0.994) | TCGA-EW-A2FW-01 | Breast | breast invasive carcinoma | Female | <65 | I/II | Hormone Therapy | exemestane | SD | |
| TYW3 | insertion | Frame_Shift_Ins | rs746460438 | c.664dupA | p.Arg222LysfsTer13 | p.R222Kfs*13 | Q6IPR3 | protein_coding | TCGA-AN-A046-01 | Breast | breast invasive carcinoma | Female | >=65 | I/II | Unknown | Unknown | SD | ||
| TYW3 | SNV | Missense_Mutation | novel | c.490N>C | p.Glu164Gln | p.E164Q | Q6IPR3 | protein_coding | tolerated(0.06) | benign(0.288) | TCGA-R2-A69V-01 | Cervix | cervical & endocervical cancer | Female | <65 | I/II | Chemotherapy | cisplatin | SD |
| TYW3 | SNV | Missense_Mutation | rs369783452 | c.398N>T | p.Thr133Met | p.T133M | Q6IPR3 | protein_coding | deleterious(0) | probably_damaging(0.937) | TCGA-AD-A5EJ-01 | Colorectum | colon adenocarcinoma | Female | >=65 | I/II | Unknown | Unknown | SD |
| TYW3 | insertion | Frame_Shift_Ins | novel | c.532dupA | p.Met178AsnfsTer9 | p.M178Nfs*9 | Q6IPR3 | protein_coding | TCGA-A6-5661-01 | Colorectum | colon adenocarcinoma | Female | >=65 | I/II | Unknown | Unknown | SD | ||
| TYW3 | deletion | Frame_Shift_Del | c.131delT | p.Phe44SerfsTer17 | p.F44Sfs*17 | Q6IPR3 | protein_coding | TCGA-AD-6964-01 | Colorectum | colon adenocarcinoma | Male | <65 | III/IV | Chemotherapy | folfox | PD | |||
| TYW3 | SNV | Missense_Mutation | novel | c.364N>A | p.Ala122Thr | p.A122T | Q6IPR3 | protein_coding | deleterious(0) | probably_damaging(0.996) | TCGA-A5-A0G1-01 | Endometrium | uterine corpus endometrioid carcinoma | Female | >=65 | I/II | Unknown | Unknown | SD |
| Page: 1 2 3 4 |
Top |
Related drugs of malignant transformation related genes |
| Identification of chemicals and drugs interact with genes involved in malignant transfromation |
| (DGIdb 4.0) |
| Entrez ID | Symbol | Category | Interaction Types | Drug Claim Name | Drug Name | PMIDs |
| Page: 1 |

Copyright 2023-Present -The University of Texas Health Science Center at Houston |