
|
|||||
|
 | |
| |
| |
| |
| |
| |
|
Gene: TYSND1 |
Gene summary for TYSND1 |
| Gene information | Species | Human | Gene symbol | TYSND1 | Gene ID | 219743 |
| Gene name | trypsin like peroxisomal matrix peptidase 1 | |
| Gene Alias | NET41 | |
| Cytomap | 10q22.1 | |
| Gene Type | protein-coding | GO ID | GO:0006082 | UniProtAcc | Q2T9J0 |
Top |
Malignant transformation analysis |
| Identification of the aberrant gene expression in precancerous and cancerous lesions by comparing the gene expression of stem-like cells in diseased tissues with normal stem cells |
| Entrez ID | Symbol | Replicates | Species | Organ | Tissue | Adj P-value | Log2FC | Malignancy |
| 219743 | TYSND1 | LZE24T | Human | Esophagus | ESCC | 1.45e-16 | 5.88e-01 | 0.0596 |
| 219743 | TYSND1 | LZE21T | Human | Esophagus | ESCC | 8.18e-04 | 2.20e-01 | 0.0655 |
| 219743 | TYSND1 | P1T-E | Human | Esophagus | ESCC | 4.74e-06 | 3.42e-01 | 0.0875 |
| 219743 | TYSND1 | P2T-E | Human | Esophagus | ESCC | 3.52e-30 | 5.28e-01 | 0.1177 |
| 219743 | TYSND1 | P4T-E | Human | Esophagus | ESCC | 5.02e-21 | 5.23e-01 | 0.1323 |
| 219743 | TYSND1 | P5T-E | Human | Esophagus | ESCC | 1.63e-04 | 9.61e-02 | 0.1327 |
| 219743 | TYSND1 | P8T-E | Human | Esophagus | ESCC | 9.53e-07 | 1.16e-01 | 0.0889 |
| 219743 | TYSND1 | P9T-E | Human | Esophagus | ESCC | 1.46e-11 | 2.52e-01 | 0.1131 |
| 219743 | TYSND1 | P10T-E | Human | Esophagus | ESCC | 7.11e-11 | 2.10e-01 | 0.116 |
| 219743 | TYSND1 | P11T-E | Human | Esophagus | ESCC | 1.14e-10 | 4.46e-01 | 0.1426 |
| 219743 | TYSND1 | P12T-E | Human | Esophagus | ESCC | 6.82e-38 | 6.72e-01 | 0.1122 |
| 219743 | TYSND1 | P15T-E | Human | Esophagus | ESCC | 1.95e-22 | 4.65e-01 | 0.1149 |
| 219743 | TYSND1 | P16T-E | Human | Esophagus | ESCC | 6.22e-20 | 3.93e-01 | 0.1153 |
| 219743 | TYSND1 | P17T-E | Human | Esophagus | ESCC | 5.40e-03 | 2.28e-01 | 0.1278 |
| 219743 | TYSND1 | P20T-E | Human | Esophagus | ESCC | 9.77e-22 | 5.05e-01 | 0.1124 |
| 219743 | TYSND1 | P21T-E | Human | Esophagus | ESCC | 2.61e-39 | 7.26e-01 | 0.1617 |
| 219743 | TYSND1 | P22T-E | Human | Esophagus | ESCC | 2.32e-16 | 3.29e-01 | 0.1236 |
| 219743 | TYSND1 | P23T-E | Human | Esophagus | ESCC | 6.55e-19 | 4.11e-01 | 0.108 |
| 219743 | TYSND1 | P24T-E | Human | Esophagus | ESCC | 3.84e-25 | 5.53e-01 | 0.1287 |
| 219743 | TYSND1 | P26T-E | Human | Esophagus | ESCC | 2.25e-27 | 4.58e-01 | 0.1276 |
| Page: 1 2 3 4 5 |
| Tissue | Expression Dynamics | Abbreviation |
| Esophagus | 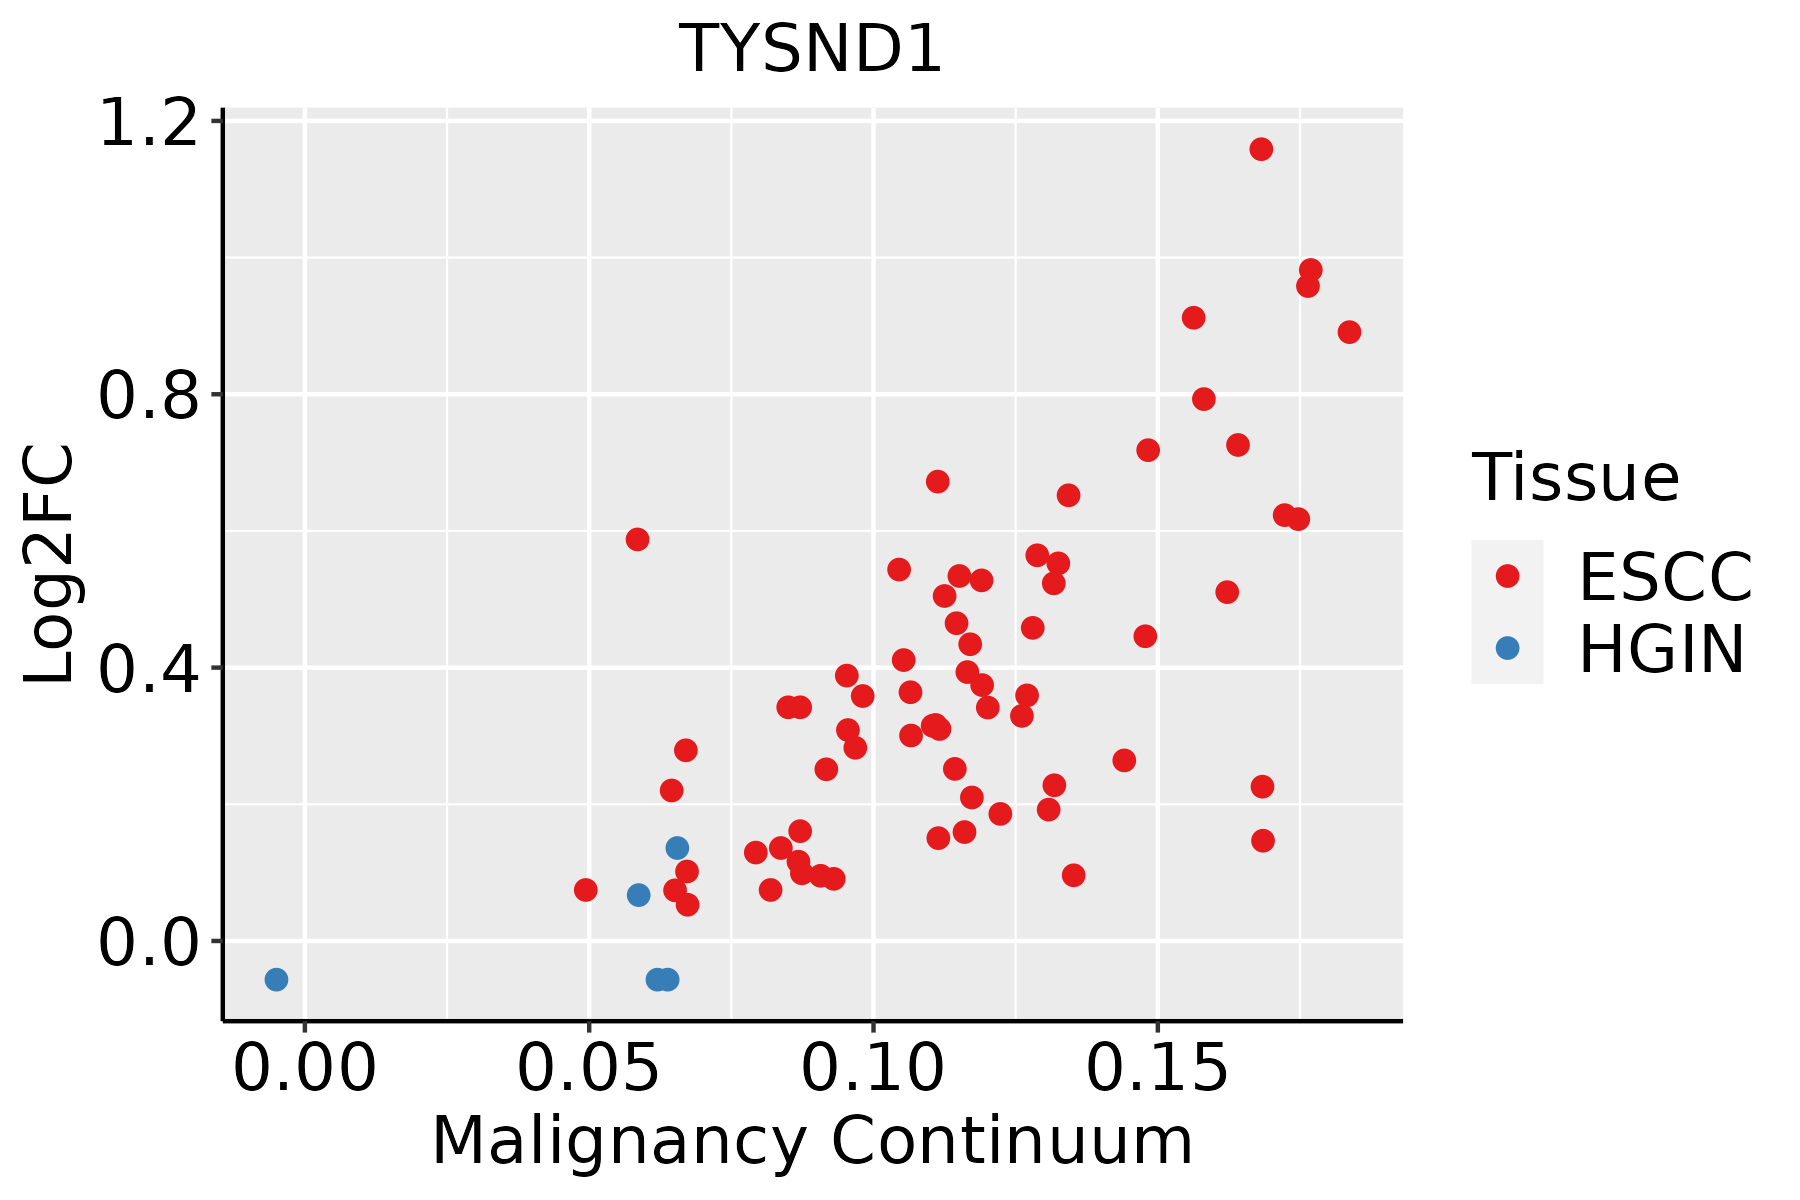 | ESCC: Esophageal squamous cell carcinoma |
| HGIN: High-grade intraepithelial neoplasias | ||
| LGIN: Low-grade intraepithelial neoplasias | ||
| Liver | 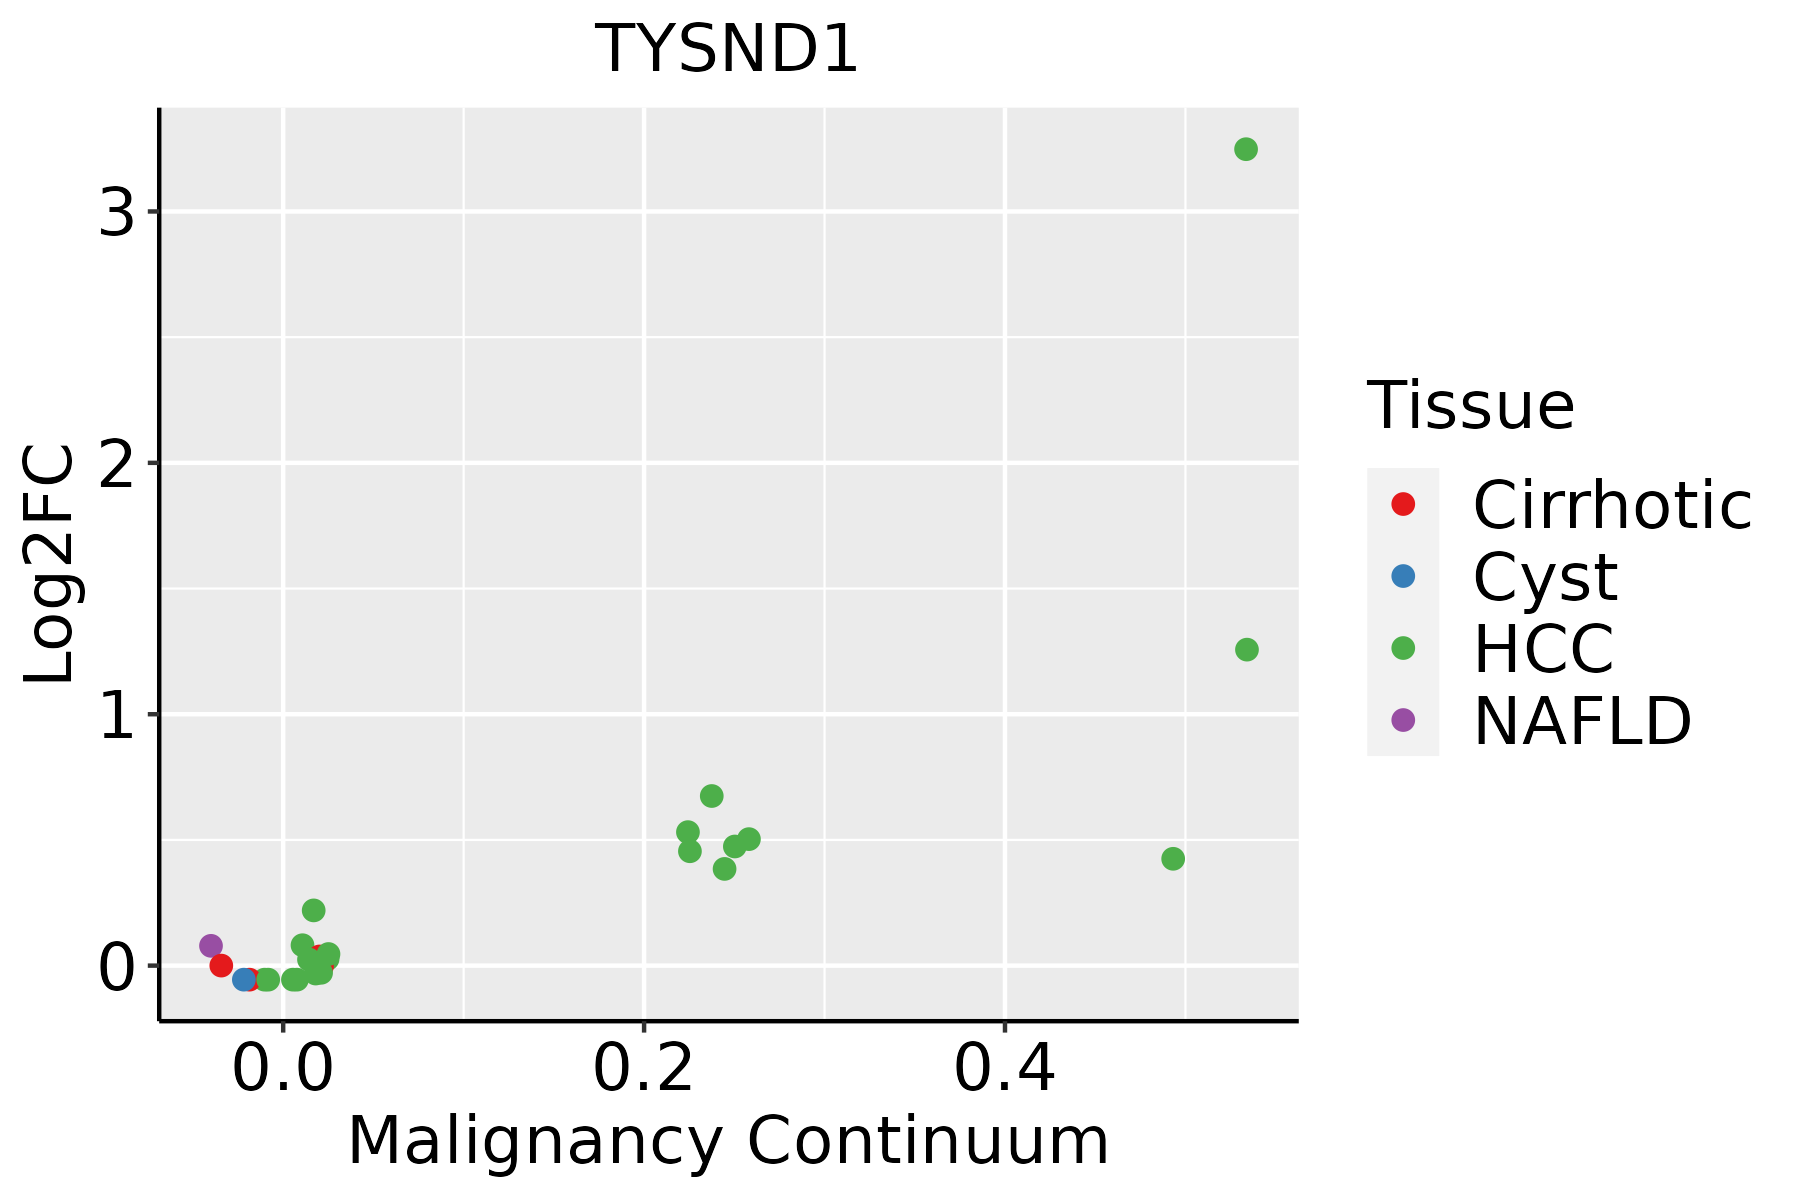 | HCC: Hepatocellular carcinoma |
| NAFLD: Non-alcoholic fatty liver disease | ||
| Oral Cavity | 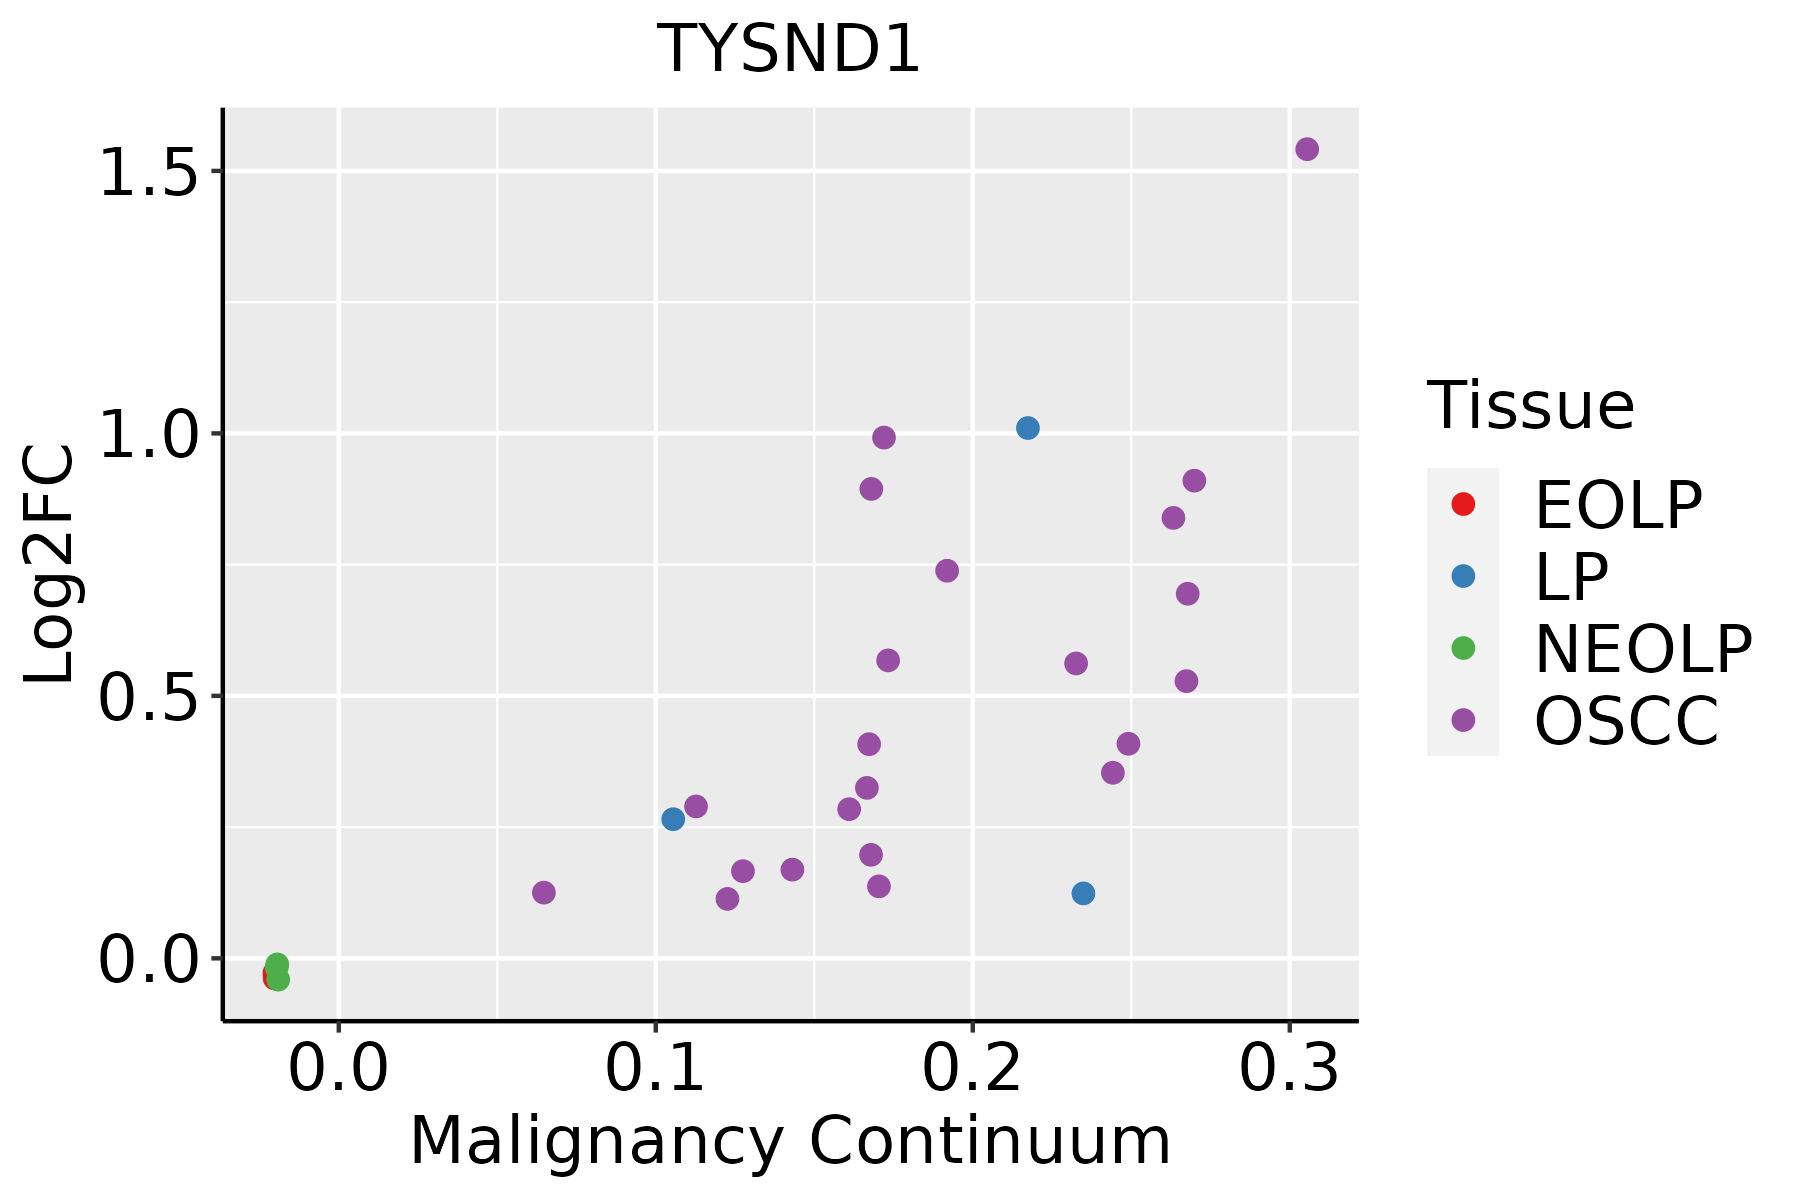 | EOLP: Erosive Oral lichen planus |
| LP: leukoplakia | ||
| NEOLP: Non-erosive oral lichen planus | ||
| OSCC: Oral squamous cell carcinoma | ||
| Skin | 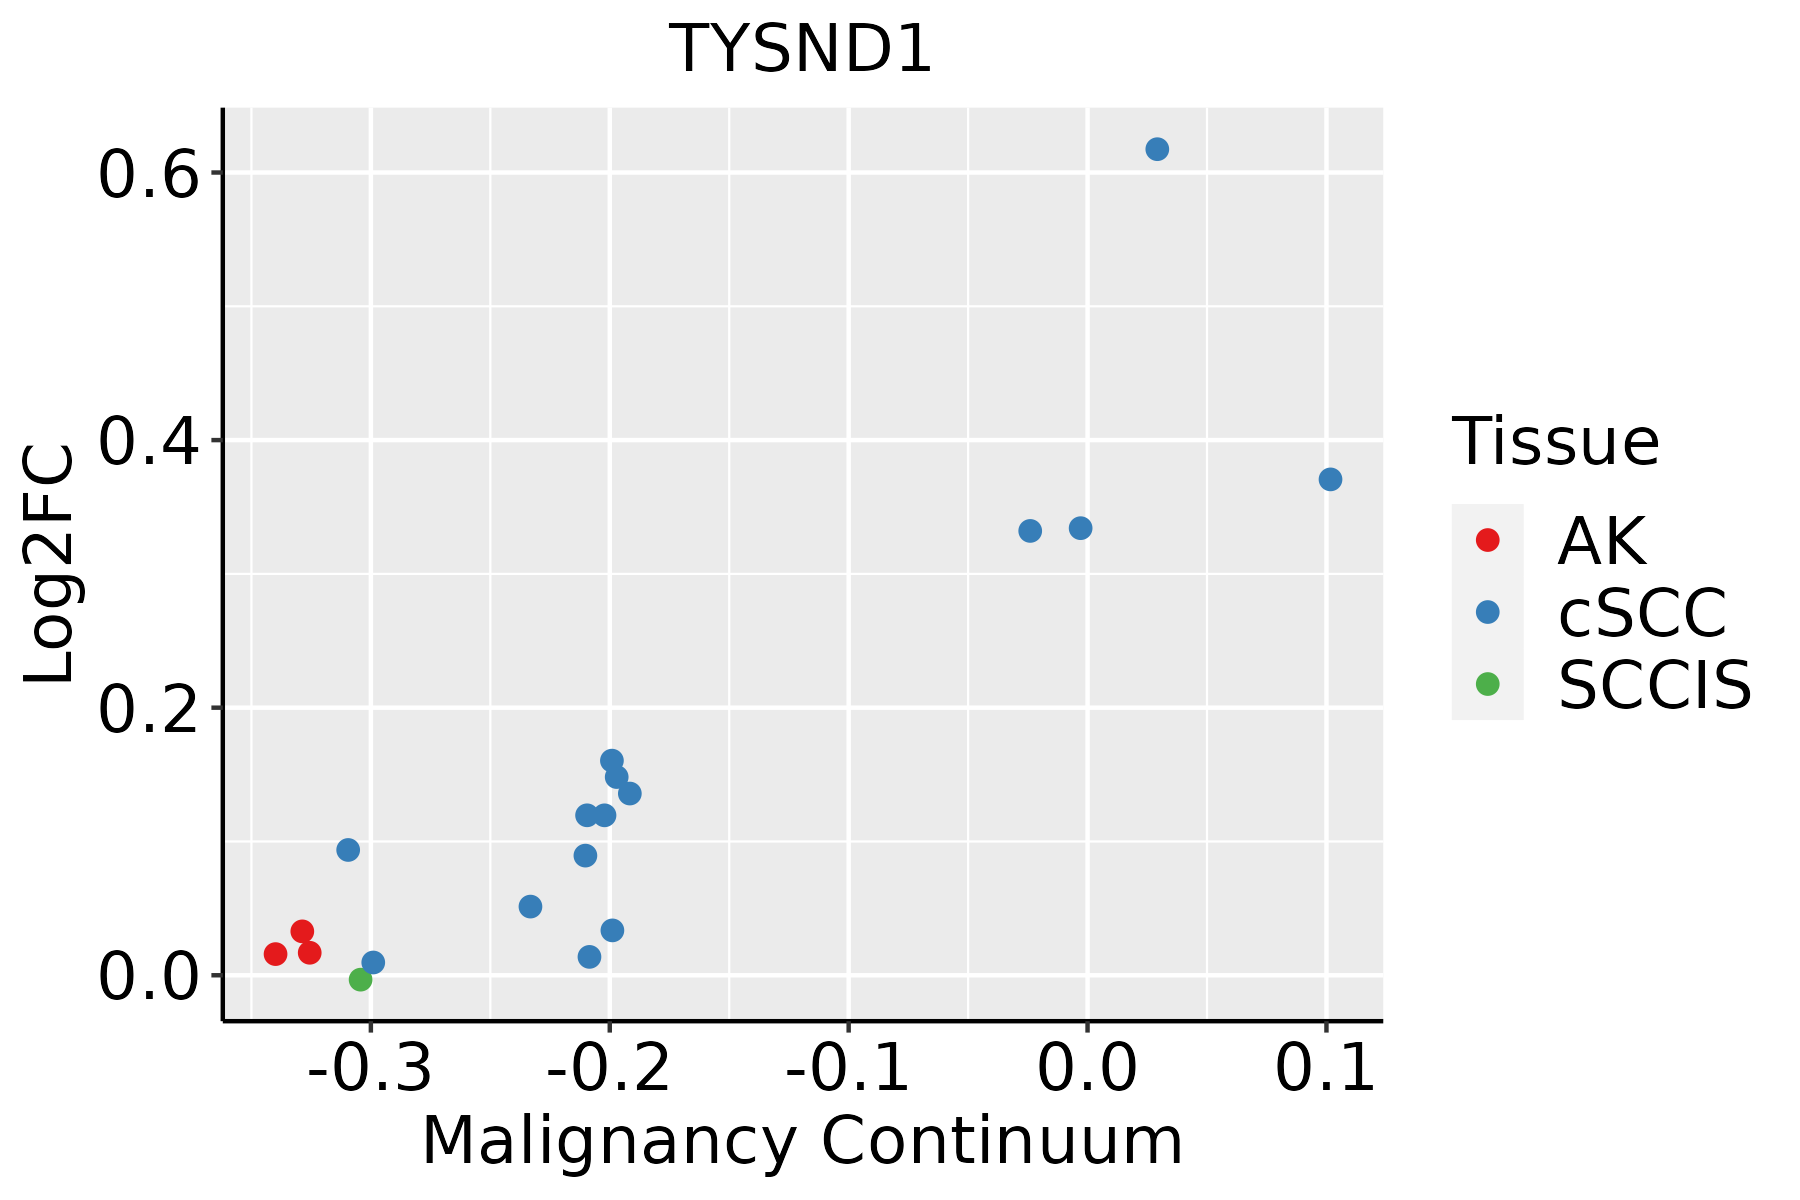 | AK: Actinic keratosis |
| cSCC: Cutaneous squamous cell carcinoma | ||
| SCCIS:squamous cell carcinoma in situ |
| ∗log2FC in expression of this searched gene in stem-like cells from each diseased tissue sample relative to stem-like cells in normal samples in each tissue plotted against the malignancy continuum. Samples are colored based on if they are from different disease stage. |
Top |
Malignant transformation related pathway analysis |
| Find out the enriched GO biological processes and KEGG pathways involved in transition from healthy to precancer to cancer |
| Tissue | Disease Stage | Enriched GO biological Processes |
| Colorectum | AD |  |
| Colorectum | SER |  |
| Colorectum | MSS |  |
| Colorectum | MSI-H |  |
| Colorectum | FAP |  |
| ∗Top 15 enriched GO BP terms are showed in the bar plot of each disease state in each tissue. Each row represents a significant GO biological process which is colored according to the -log10(p.adjust). |
| Page: 1 2 3 4 5 6 7 8 9 |
| GO ID | Tissue | Disease Stage | Description | Gene Ratio | Bg Ratio | pvalue | p.adjust | Count |
| GO:005160418 | Esophagus | ESCC | protein maturation | 189/8552 | 294/18723 | 7.64e-11 | 2.39e-09 | 189 |
| GO:00193958 | Esophagus | ESCC | fatty acid oxidation | 69/8552 | 103/18723 | 9.95e-06 | 9.44e-05 | 69 |
| GO:001648514 | Esophagus | ESCC | protein processing | 134/8552 | 225/18723 | 1.81e-05 | 1.60e-04 | 134 |
| GO:00344407 | Esophagus | ESCC | lipid oxidation | 71/8552 | 108/18723 | 2.00e-05 | 1.74e-04 | 71 |
| GO:00090628 | Esophagus | ESCC | fatty acid catabolic process | 66/8552 | 100/18723 | 3.21e-05 | 2.66e-04 | 66 |
| GO:00066318 | Esophagus | ESCC | fatty acid metabolic process | 217/8552 | 390/18723 | 4.21e-05 | 3.39e-04 | 217 |
| GO:00066358 | Esophagus | ESCC | fatty acid beta-oxidation | 50/8552 | 74/18723 | 1.16e-04 | 8.04e-04 | 50 |
| GO:00620129 | Esophagus | ESCC | regulation of small molecule metabolic process | 184/8552 | 334/18723 | 3.11e-04 | 1.85e-03 | 184 |
| GO:00723297 | Esophagus | ESCC | monocarboxylic acid catabolic process | 74/8552 | 122/18723 | 6.03e-04 | 3.27e-03 | 74 |
| GO:00421805 | Esophagus | ESCC | cellular ketone metabolic process | 120/8552 | 211/18723 | 6.70e-04 | 3.55e-03 | 120 |
| GO:00442427 | Esophagus | ESCC | cellular lipid catabolic process | 121/8552 | 214/18723 | 8.63e-04 | 4.43e-03 | 121 |
| GO:00442827 | Esophagus | ESCC | small molecule catabolic process | 201/8552 | 376/18723 | 1.35e-03 | 6.41e-03 | 201 |
| GO:00302586 | Esophagus | ESCC | lipid modification | 116/8552 | 212/18723 | 4.90e-03 | 1.89e-02 | 116 |
| GO:00160427 | Esophagus | ESCC | lipid catabolic process | 168/8552 | 320/18723 | 7.97e-03 | 2.84e-02 | 168 |
| GO:00192168 | Esophagus | ESCC | regulation of lipid metabolic process | 172/8552 | 331/18723 | 1.20e-02 | 4.02e-02 | 172 |
| GO:000663122 | Liver | HCC | fatty acid metabolic process | 238/7958 | 390/18723 | 8.24e-14 | 4.84e-12 | 238 |
| GO:004428221 | Liver | HCC | small molecule catabolic process | 225/7958 | 376/18723 | 6.50e-12 | 2.80e-10 | 225 |
| GO:001605421 | Liver | HCC | organic acid catabolic process | 152/7958 | 240/18723 | 5.11e-11 | 1.92e-09 | 152 |
| GO:00463952 | Liver | HCC | carboxylic acid catabolic process | 149/7958 | 236/18723 | 1.11e-10 | 3.87e-09 | 149 |
| GO:004424222 | Liver | HCC | cellular lipid catabolic process | 134/7958 | 214/18723 | 2.07e-09 | 5.79e-08 | 134 |
| Page: 1 2 3 |
| Pathway ID | Tissue | Disease Stage | Description | Gene Ratio | Bg Ratio | pvalue | p.adjust | qvalue | Count |
| Page: 1 |
Top |
Cell-cell communication analysis |
| Identification of potential cell-cell interactions between two cell types and their ligand-receptor pairs for different disease states |
| Ligand | Receptor | LRpair | Pathway | Tissue | Disease Stage |
| Page: 1 |
Top |
Single-cell gene regulatory network inference analysis |
| Find out the significant the regulons (TFs) and the target genes of each regulon across cell types for different disease states |
| TF | Cell Type | Tissue | Disease Stage | Target Gene | RSS | Regulon Activity |
| ∗The dot plots of a searched regulon are shown for all cell subpopulations in each disease state of each tissue based on the regulon specific score inferred using pySCENIC and by calculating the average expression. |
| Page: 1 |
Top |
Somatic mutation of malignant transformation related genes |
| Annotation of somatic variants for genes involved in malignant transformation |
| Hugo Symbol | Variant Class | Variant Classification | dbSNP RS | HGVSc | HGVSp | HGVSp Short | SWISSPROT | BIOTYPE | SIFT | PolyPhen | Tumor Sample Barcode | Tissue | Histology | Sex | Age | Stage | Therapy Types | Drugs | Outcome |
| TYSND1 | SNV | Missense_Mutation | c.512N>T | p.Ser171Leu | p.S171L | Q2T9J0 | protein_coding | tolerated(0.31) | benign(0.001) | TCGA-A1-A0SG-01 | Breast | breast invasive carcinoma | Female | <65 | I/II | Chemotherapy | SD | ||
| TYSND1 | deletion | Frame_Shift_Del | novel | c.1615delC | p.Arg539ValfsTer47 | p.R539Vfs*47 | Q2T9J0 | protein_coding | TCGA-D8-A27V-01 | Breast | breast invasive carcinoma | Female | <65 | I/II | Hormone Therapy | tamoxiphen | SD | ||
| TYSND1 | SNV | Missense_Mutation | c.1545N>G | p.Phe515Leu | p.F515L | Q2T9J0 | protein_coding | deleterious(0) | probably_damaging(0.994) | TCGA-C5-A1MK-01 | Cervix | cervical & endocervical cancer | Female | >=65 | III/IV | Chemotherapy | carboplatin | PD | |
| TYSND1 | SNV | Missense_Mutation | c.1174N>A | p.Ala392Thr | p.A392T | Q2T9J0 | protein_coding | tolerated(0.72) | benign(0.006) | TCGA-A6-2686-01 | Colorectum | colon adenocarcinoma | Female | >=65 | I/II | Unknown | Unknown | SD | |
| TYSND1 | SNV | Missense_Mutation | c.614T>C | p.Met205Thr | p.M205T | Q2T9J0 | protein_coding | tolerated(0.07) | benign(0) | TCGA-WS-AB45-01 | Colorectum | colon adenocarcinoma | Female | <65 | I/II | Unknown | Unknown | SD | |
| TYSND1 | SNV | Missense_Mutation | novel | c.1245N>T | p.Glu415Asp | p.E415D | Q2T9J0 | protein_coding | tolerated(0.05) | benign(0.01) | TCGA-A5-A0G1-01 | Endometrium | uterine corpus endometrioid carcinoma | Female | >=65 | I/II | Unknown | Unknown | SD |
| TYSND1 | SNV | Missense_Mutation | novel | c.1245G>T | p.Glu415Asp | p.E415D | Q2T9J0 | protein_coding | tolerated(0.05) | benign(0.01) | TCGA-A5-A0GG-01 | Endometrium | uterine corpus endometrioid carcinoma | Female | >=65 | I/II | Unknown | Unknown | SD |
| TYSND1 | SNV | Missense_Mutation | novel | c.1244N>T | p.Glu415Val | p.E415V | Q2T9J0 | protein_coding | deleterious(0) | possibly_damaging(0.683) | TCGA-AJ-A3EK-01 | Endometrium | uterine corpus endometrioid carcinoma | Female | <65 | I/II | Chemotherapy | carboplatin | CR |
| TYSND1 | SNV | Missense_Mutation | rs750932595 | c.1628G>A | p.Arg543His | p.R543H | Q2T9J0 | protein_coding | tolerated(0.38) | benign(0) | TCGA-AP-A1DK-01 | Endometrium | uterine corpus endometrioid carcinoma | Female | <65 | I/II | Unknown | Unknown | SD |
| TYSND1 | SNV | Missense_Mutation | novel | c.1228G>A | p.Ala410Thr | p.A410T | Q2T9J0 | protein_coding | deleterious(0) | probably_damaging(0.999) | TCGA-AP-A1DV-01 | Endometrium | uterine corpus endometrioid carcinoma | Female | <65 | I/II | Unknown | Unknown | SD |
| Page: 1 2 |
Top |
Related drugs of malignant transformation related genes |
| Identification of chemicals and drugs interact with genes involved in malignant transfromation |
| (DGIdb 4.0) |
| Entrez ID | Symbol | Category | Interaction Types | Drug Claim Name | Drug Name | PMIDs |
| Page: 1 |

Copyright 2023-Present -The University of Texas Health Science Center at Houston |