
|
|||||
|
 | |
| |
| |
| |
| |
| |
|
Gene: TYMS |
Gene summary for TYMS |
| Gene information | Species | Human | Gene symbol | TYMS | Gene ID | 7298 |
| Gene name | thymidylate synthetase | |
| Gene Alias | HST422 | |
| Cytomap | 18p11.32 | |
| Gene Type | protein-coding | GO ID | GO:0001501 | UniProtAcc | P04818 |
Top |
Malignant transformation analysis |
| Identification of the aberrant gene expression in precancerous and cancerous lesions by comparing the gene expression of stem-like cells in diseased tissues with normal stem cells |
| Entrez ID | Symbol | Replicates | Species | Organ | Tissue | Adj P-value | Log2FC | Malignancy |
| 7298 | TYMS | GSM4909281 | Human | Breast | IDC | 4.26e-13 | 4.04e-01 | 0.21 |
| 7298 | TYMS | GSM4909282 | Human | Breast | IDC | 3.33e-61 | 1.00e+00 | -0.0288 |
| 7298 | TYMS | GSM4909287 | Human | Breast | IDC | 2.16e-23 | 6.13e-01 | 0.2057 |
| 7298 | TYMS | GSM4909288 | Human | Breast | IDC | 5.53e-04 | 4.83e-01 | 0.0988 |
| 7298 | TYMS | M2 | Human | Breast | IDC | 6.15e-03 | 4.18e-01 | 0.21 |
| 7298 | TYMS | HTA11_78_2000001011 | Human | Colorectum | AD | 1.20e-04 | 3.47e-01 | -0.1088 |
| 7298 | TYMS | HTA11_347_2000001011 | Human | Colorectum | AD | 4.99e-02 | 1.87e-01 | -0.1954 |
| 7298 | TYMS | HTA11_1391_2000001011 | Human | Colorectum | AD | 1.91e-03 | 2.74e-01 | -0.059 |
| 7298 | TYMS | HTA11_7663_2000001011 | Human | Colorectum | SER | 2.96e-03 | 2.89e-01 | 0.0131 |
| 7298 | TYMS | HTA11_10623_2000001011 | Human | Colorectum | AD | 4.39e-02 | 3.17e-01 | -0.0177 |
| 7298 | TYMS | HTA11_6818_2000001021 | Human | Colorectum | AD | 2.33e-04 | 2.85e-01 | 0.0588 |
| 7298 | TYMS | HTA11_99999970781_79442 | Human | Colorectum | MSS | 1.84e-05 | 2.84e-01 | 0.294 |
| 7298 | TYMS | HTA11_99999965062_69753 | Human | Colorectum | MSI-H | 5.52e-03 | 6.96e-01 | 0.3487 |
| 7298 | TYMS | LZE2T | Human | Esophagus | ESCC | 5.50e-08 | 1.25e+00 | 0.082 |
| 7298 | TYMS | LZE7T | Human | Esophagus | ESCC | 1.43e-02 | 1.44e-01 | 0.0667 |
| 7298 | TYMS | LZE6T | Human | Esophagus | ESCC | 3.94e-02 | 1.23e-01 | 0.0845 |
| 7298 | TYMS | P2T-E | Human | Esophagus | ESCC | 1.28e-24 | 1.51e+00 | 0.1177 |
| 7298 | TYMS | P4T-E | Human | Esophagus | ESCC | 5.39e-32 | 1.12e+00 | 0.1323 |
| 7298 | TYMS | P5T-E | Human | Esophagus | ESCC | 1.20e-42 | 1.24e+00 | 0.1327 |
| 7298 | TYMS | P8T-E | Human | Esophagus | ESCC | 4.87e-07 | 5.17e-01 | 0.0889 |
| Page: 1 2 3 4 5 |
| Tissue | Expression Dynamics | Abbreviation |
| Breast | 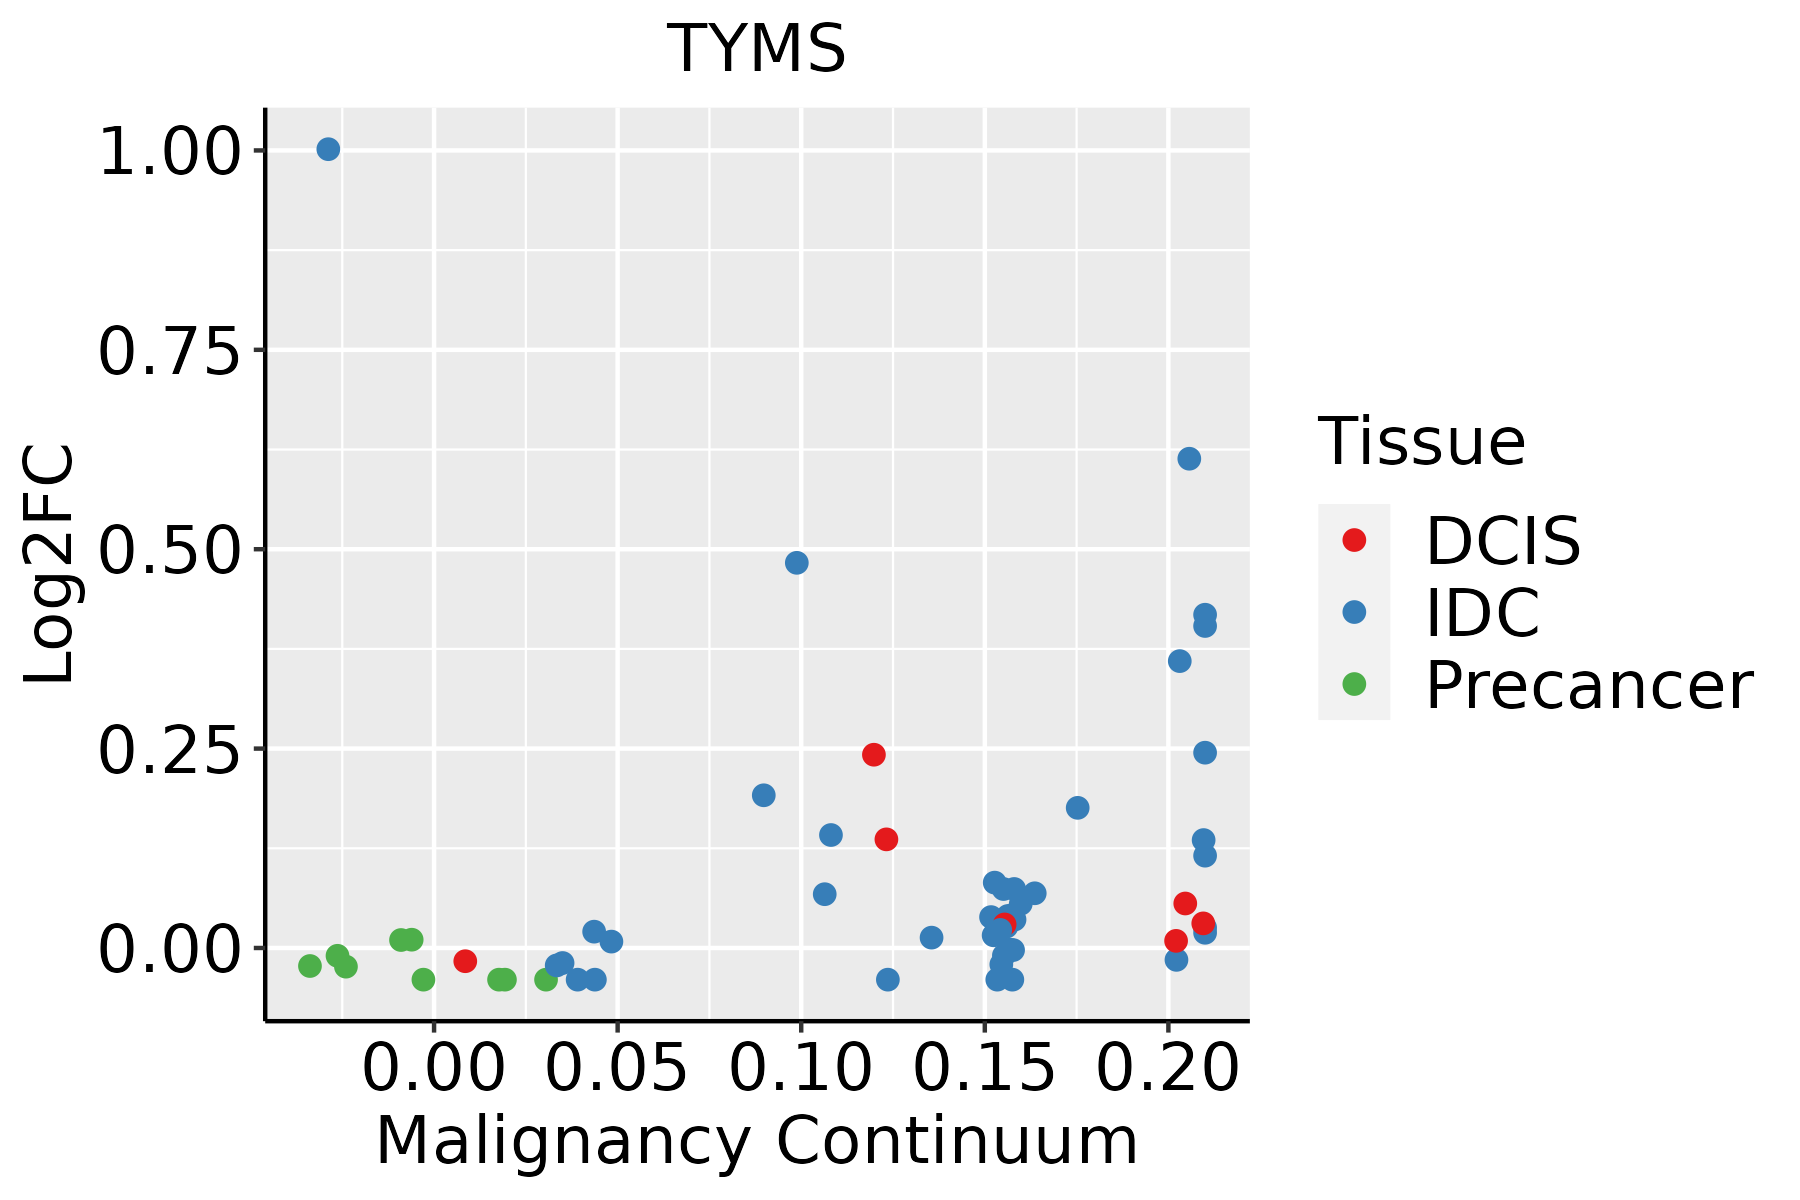 | IDC: Invasive ductal carcinoma |
| DCIS: Ductal carcinoma in situ | ||
| Precancer(BRCA1-mut): Precancerous lesion from BRCA1 mutation carriers | ||
| Colorectum (GSE201348) |  | FAP: Familial adenomatous polyposis |
| CRC: Colorectal cancer | ||
| Colorectum (HTA11) |  | AD: Adenomas |
| SER: Sessile serrated lesions | ||
| MSI-H: Microsatellite-high colorectal cancer | ||
| MSS: Microsatellite stable colorectal cancer | ||
| Esophagus | 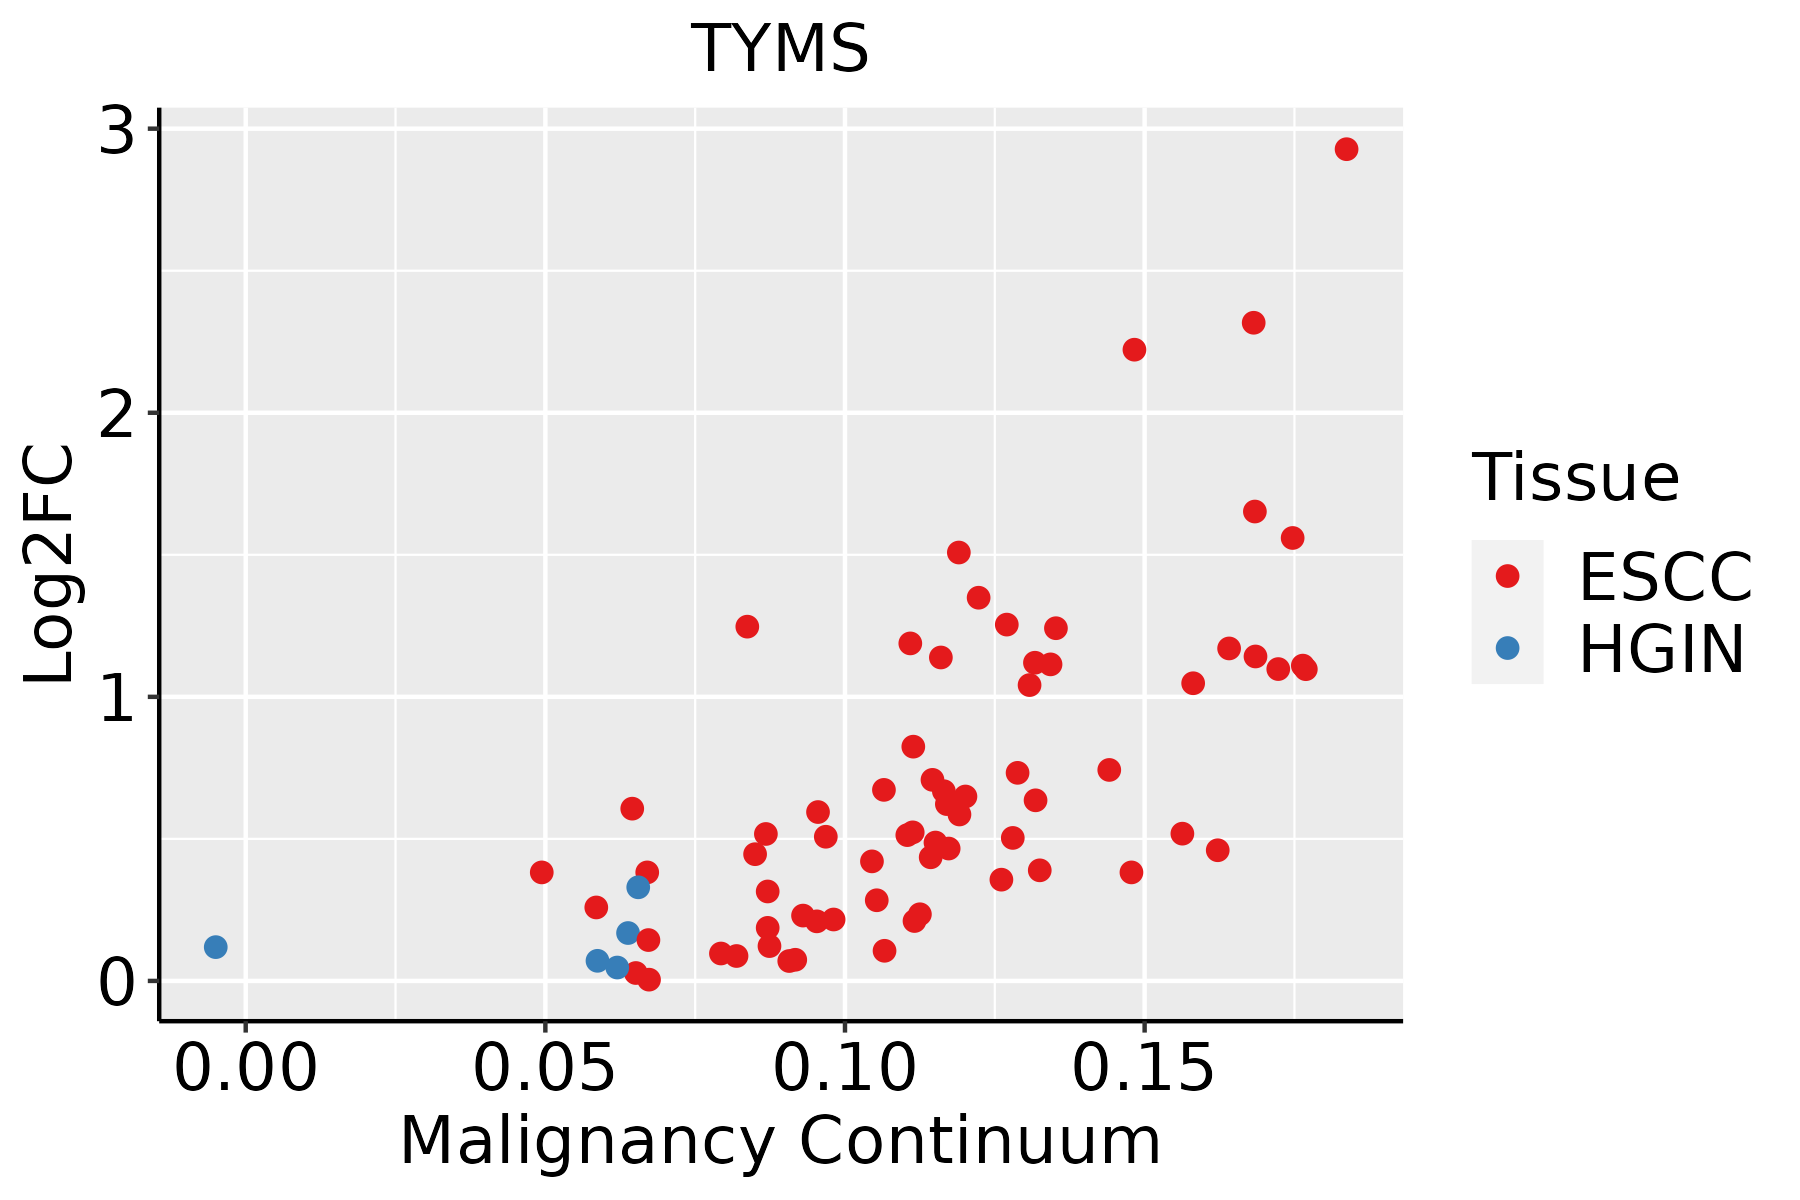 | ESCC: Esophageal squamous cell carcinoma |
| HGIN: High-grade intraepithelial neoplasias | ||
| LGIN: Low-grade intraepithelial neoplasias | ||
| Liver | 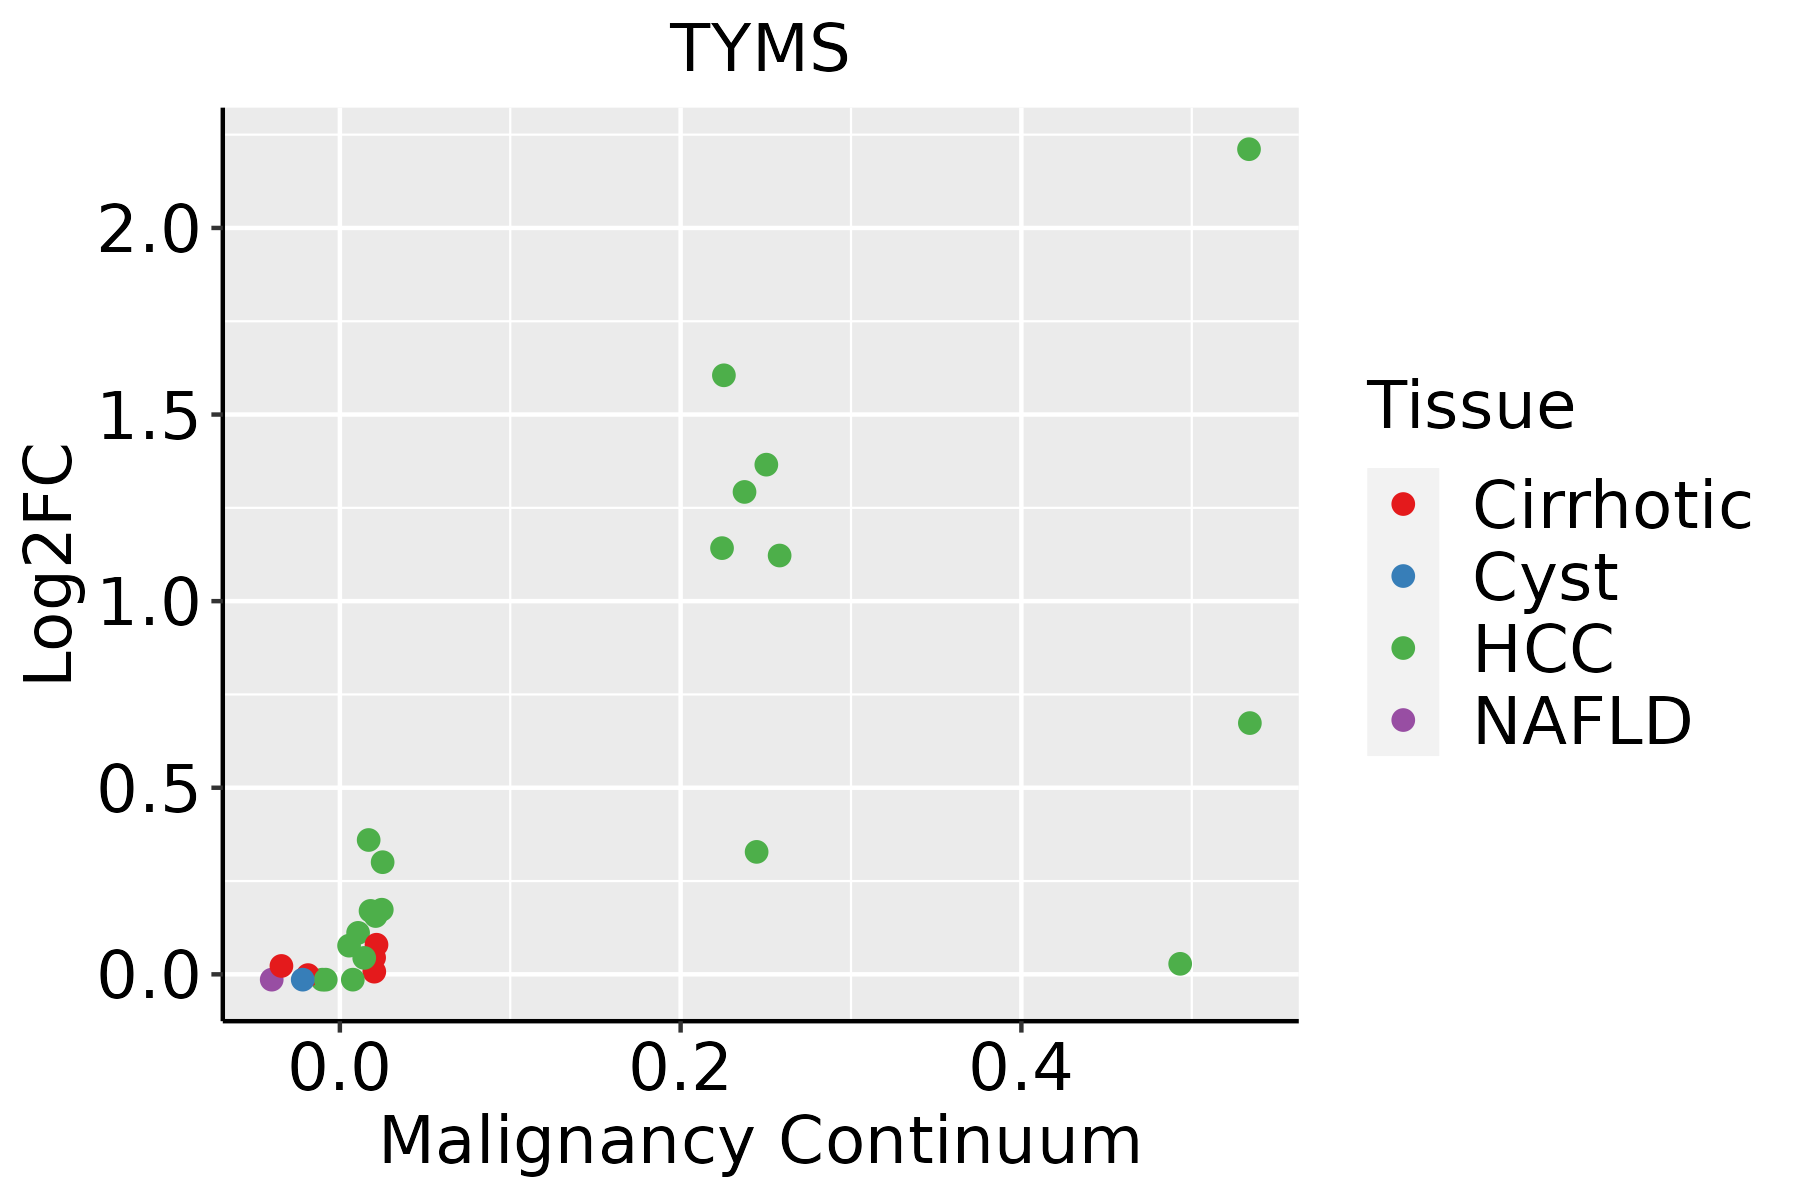 | HCC: Hepatocellular carcinoma |
| NAFLD: Non-alcoholic fatty liver disease | ||
| Oral Cavity | 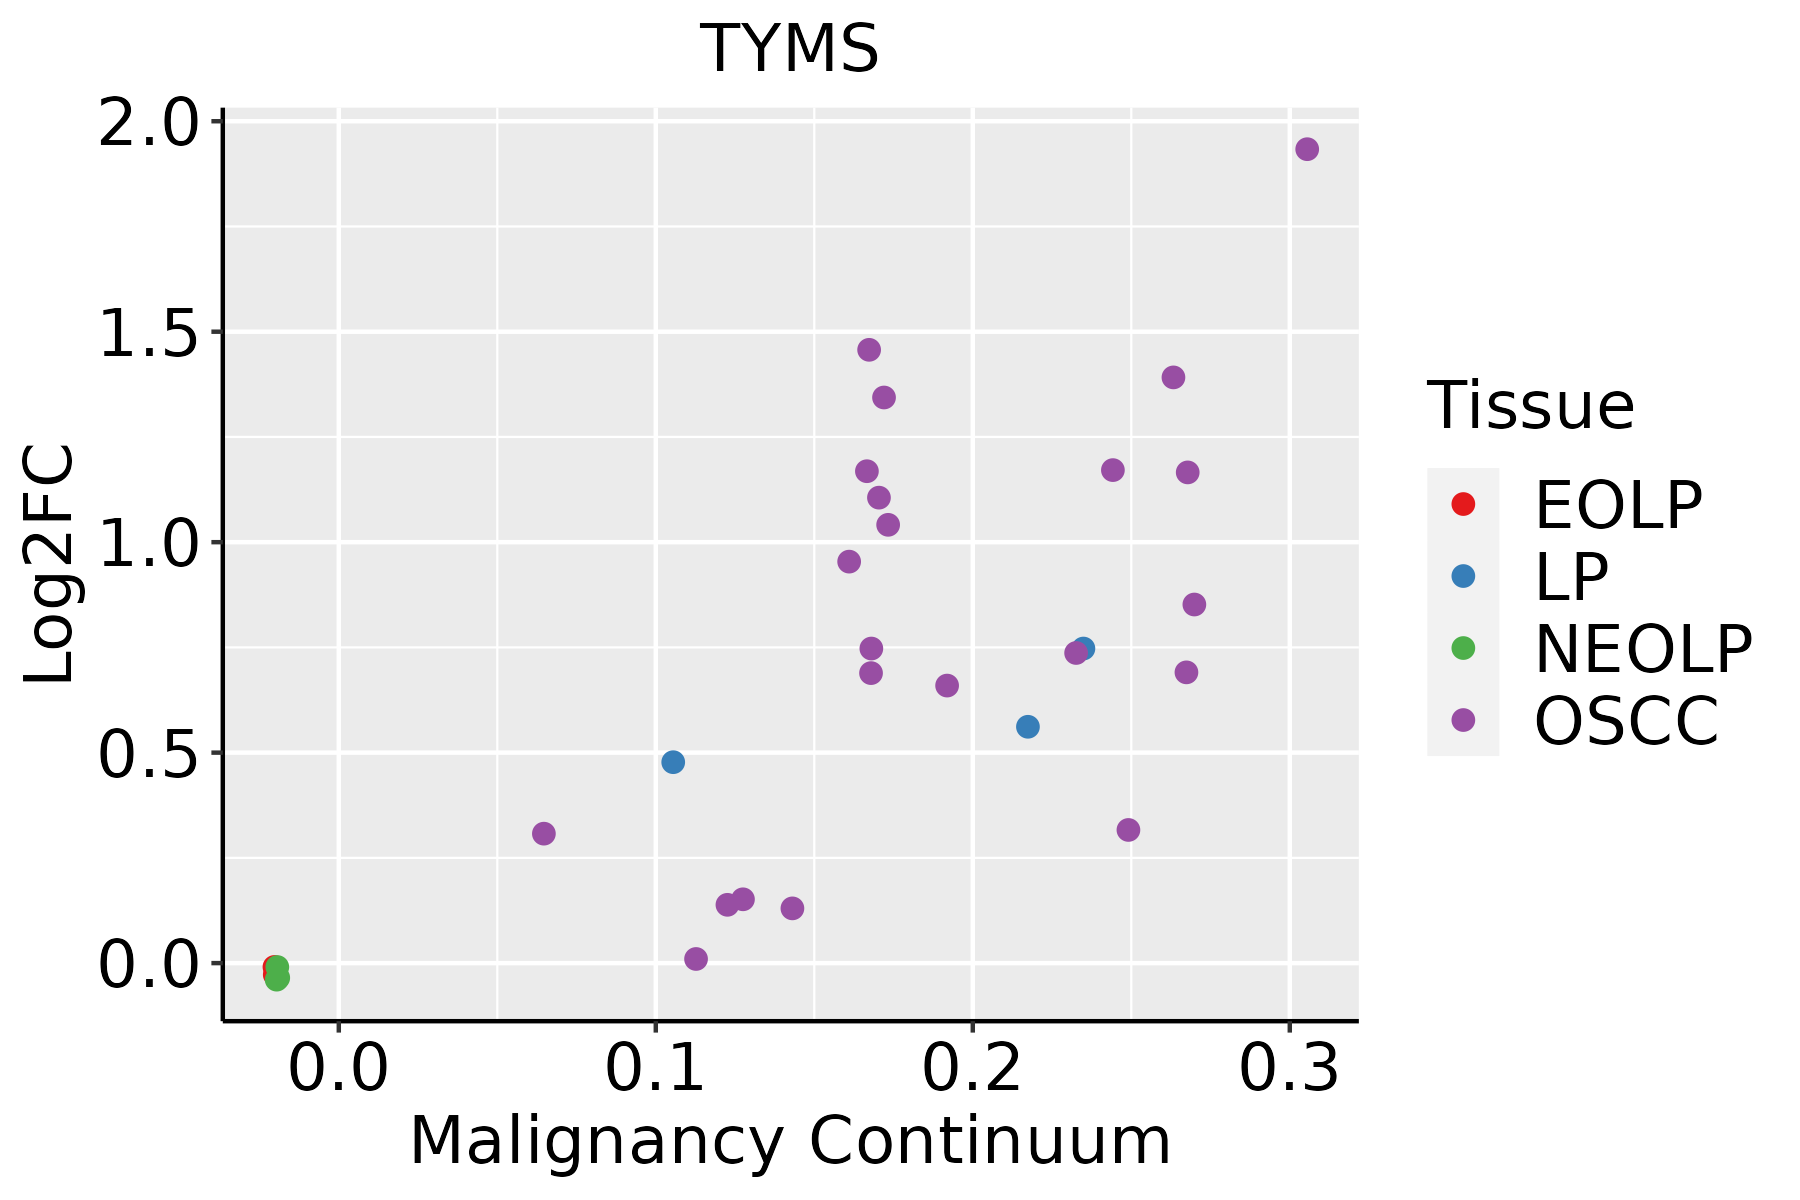 | EOLP: Erosive Oral lichen planus |
| LP: leukoplakia | ||
| NEOLP: Non-erosive oral lichen planus | ||
| OSCC: Oral squamous cell carcinoma | ||
| Skin | 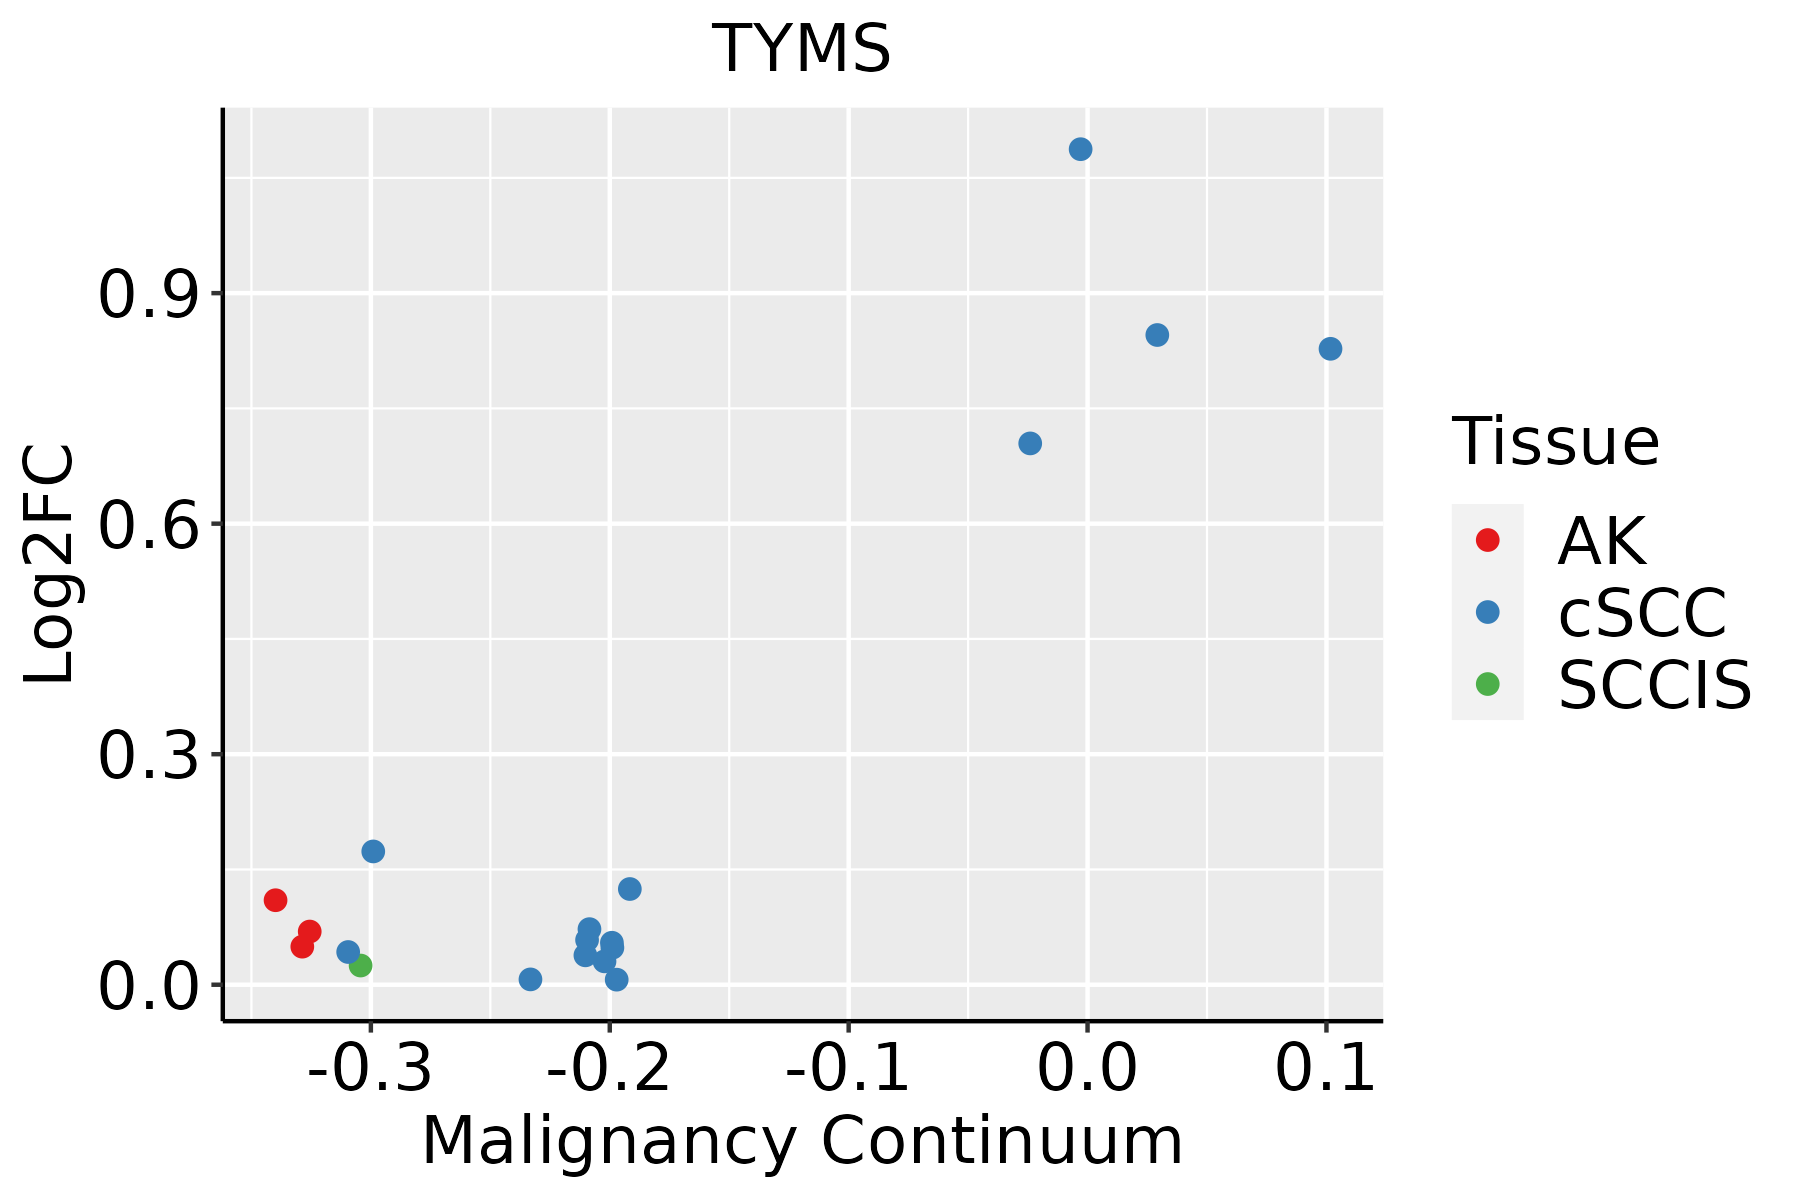 | AK: Actinic keratosis |
| cSCC: Cutaneous squamous cell carcinoma | ||
| SCCIS:squamous cell carcinoma in situ | ||
| Thyroid |  | ATC: Anaplastic thyroid cancer |
| HT: Hashimoto's thyroiditis | ||
| PTC: Papillary thyroid cancer |
| ∗log2FC in expression of this searched gene in stem-like cells from each diseased tissue sample relative to stem-like cells in normal samples in each tissue plotted against the malignancy continuum. Samples are colored based on if they are from different disease stage. |
Top |
Malignant transformation related pathway analysis |
| Find out the enriched GO biological processes and KEGG pathways involved in transition from healthy to precancer to cancer |
| Tissue | Disease Stage | Enriched GO biological Processes |
| Colorectum | AD |  |
| Colorectum | SER |  |
| Colorectum | MSS |  |
| Colorectum | MSI-H |  |
| Colorectum | FAP |  |
| ∗Top 15 enriched GO BP terms are showed in the bar plot of each disease state in each tissue. Each row represents a significant GO biological process which is colored according to the -log10(p.adjust). |
| Page: 1 2 3 4 5 6 7 8 9 |
| GO ID | Tissue | Disease Stage | Description | Gene Ratio | Bg Ratio | pvalue | p.adjust | Count |
| GO:004854514 | Breast | IDC | response to steroid hormone | 70/1434 | 339/18723 | 1.34e-14 | 4.23e-12 | 70 |
| GO:000914214 | Breast | IDC | nucleoside triphosphate biosynthetic process | 26/1434 | 85/18723 | 4.72e-10 | 5.06e-08 | 26 |
| GO:000641714 | Breast | IDC | regulation of translation | 74/1434 | 468/18723 | 1.67e-09 | 1.53e-07 | 74 |
| GO:003196013 | Breast | IDC | response to corticosteroid | 37/1434 | 167/18723 | 3.10e-09 | 2.63e-07 | 37 |
| GO:000914114 | Breast | IDC | nucleoside triphosphate metabolic process | 29/1434 | 112/18723 | 3.68e-09 | 3.03e-07 | 29 |
| GO:005138413 | Breast | IDC | response to glucocorticoid | 32/1434 | 148/18723 | 6.52e-08 | 4.07e-06 | 32 |
| GO:004873214 | Breast | IDC | gland development | 64/1434 | 436/18723 | 3.47e-07 | 1.74e-05 | 64 |
| GO:000963613 | Breast | IDC | response to toxic substance | 44/1434 | 262/18723 | 6.33e-07 | 3.00e-05 | 44 |
| GO:000756813 | Breast | IDC | aging | 52/1434 | 339/18723 | 1.14e-06 | 5.10e-05 | 52 |
| GO:000675313 | Breast | IDC | nucleoside phosphate metabolic process | 68/1434 | 497/18723 | 2.01e-06 | 8.23e-05 | 68 |
| GO:000911713 | Breast | IDC | nucleotide metabolic process | 67/1434 | 489/18723 | 2.28e-06 | 9.05e-05 | 67 |
| GO:190129313 | Breast | IDC | nucleoside phosphate biosynthetic process | 41/1434 | 256/18723 | 5.15e-06 | 1.73e-04 | 41 |
| GO:000916513 | Breast | IDC | nucleotide biosynthetic process | 40/1434 | 254/18723 | 1.01e-05 | 2.81e-04 | 40 |
| GO:000941013 | Breast | IDC | response to xenobiotic stimulus | 62/1434 | 462/18723 | 1.05e-05 | 2.88e-04 | 62 |
| GO:190165414 | Breast | IDC | response to ketone | 33/1434 | 194/18723 | 1.17e-05 | 3.13e-04 | 33 |
| GO:003166714 | Breast | IDC | response to nutrient levels | 62/1434 | 474/18723 | 2.33e-05 | 5.57e-04 | 62 |
| GO:003110012 | Breast | IDC | animal organ regeneration | 17/1434 | 76/18723 | 4.85e-05 | 1.07e-03 | 17 |
| GO:004668312 | Breast | IDC | response to organophosphorus | 24/1434 | 131/18723 | 5.22e-05 | 1.12e-03 | 24 |
| GO:000758412 | Breast | IDC | response to nutrient | 29/1434 | 174/18723 | 5.69e-05 | 1.20e-03 | 29 |
| GO:003109912 | Breast | IDC | regeneration | 31/1434 | 198/18723 | 1.08e-04 | 2.03e-03 | 31 |
| Page: 1 2 3 4 5 6 7 8 9 10 11 12 13 14 15 16 17 18 19 20 21 22 23 24 |
| Pathway ID | Tissue | Disease Stage | Description | Gene Ratio | Bg Ratio | pvalue | p.adjust | qvalue | Count |
| hsa012325 | Esophagus | ESCC | Nucleotide metabolism | 59/4205 | 85/8465 | 1.67e-04 | 6.58e-04 | 3.37e-04 | 59 |
| hsa002405 | Esophagus | ESCC | Pyrimidine metabolism | 41/4205 | 58/8465 | 9.14e-04 | 2.92e-03 | 1.49e-03 | 41 |
| hsa015232 | Esophagus | ESCC | Antifolate resistance | 22/4205 | 30/8465 | 7.23e-03 | 1.76e-02 | 8.99e-03 | 22 |
| hsa0123212 | Esophagus | ESCC | Nucleotide metabolism | 59/4205 | 85/8465 | 1.67e-04 | 6.58e-04 | 3.37e-04 | 59 |
| hsa0024012 | Esophagus | ESCC | Pyrimidine metabolism | 41/4205 | 58/8465 | 9.14e-04 | 2.92e-03 | 1.49e-03 | 41 |
| hsa0152311 | Esophagus | ESCC | Antifolate resistance | 22/4205 | 30/8465 | 7.23e-03 | 1.76e-02 | 8.99e-03 | 22 |
| hsa002402 | Liver | HCC | Pyrimidine metabolism | 44/4020 | 58/8465 | 9.34e-06 | 7.11e-05 | 3.95e-05 | 44 |
| hsa012322 | Liver | HCC | Nucleotide metabolism | 59/4020 | 85/8465 | 3.30e-05 | 1.88e-04 | 1.04e-04 | 59 |
| hsa002403 | Liver | HCC | Pyrimidine metabolism | 44/4020 | 58/8465 | 9.34e-06 | 7.11e-05 | 3.95e-05 | 44 |
| hsa012323 | Liver | HCC | Nucleotide metabolism | 59/4020 | 85/8465 | 3.30e-05 | 1.88e-04 | 1.04e-04 | 59 |
| hsa012324 | Oral cavity | OSCC | Nucleotide metabolism | 54/3704 | 85/8465 | 1.78e-04 | 5.95e-04 | 3.03e-04 | 54 |
| hsa002404 | Oral cavity | OSCC | Pyrimidine metabolism | 37/3704 | 58/8465 | 1.62e-03 | 4.45e-03 | 2.26e-03 | 37 |
| hsa0123211 | Oral cavity | OSCC | Nucleotide metabolism | 54/3704 | 85/8465 | 1.78e-04 | 5.95e-04 | 3.03e-04 | 54 |
| hsa0024011 | Oral cavity | OSCC | Pyrimidine metabolism | 37/3704 | 58/8465 | 1.62e-03 | 4.45e-03 | 2.26e-03 | 37 |
| Page: 1 |
Top |
Cell-cell communication analysis |
| Identification of potential cell-cell interactions between two cell types and their ligand-receptor pairs for different disease states |
| Ligand | Receptor | LRpair | Pathway | Tissue | Disease Stage |
| Page: 1 |
Top |
Single-cell gene regulatory network inference analysis |
| Find out the significant the regulons (TFs) and the target genes of each regulon across cell types for different disease states |
| TF | Cell Type | Tissue | Disease Stage | Target Gene | RSS | Regulon Activity |
| ∗The dot plots of a searched regulon are shown for all cell subpopulations in each disease state of each tissue based on the regulon specific score inferred using pySCENIC and by calculating the average expression. |
| Page: 1 |
Top |
Somatic mutation of malignant transformation related genes |
| Annotation of somatic variants for genes involved in malignant transformation |
| Hugo Symbol | Variant Class | Variant Classification | dbSNP RS | HGVSc | HGVSp | HGVSp Short | SWISSPROT | BIOTYPE | SIFT | PolyPhen | Tumor Sample Barcode | Tissue | Histology | Sex | Age | Stage | Therapy Types | Drugs | Outcome |
| TYMS | SNV | Missense_Mutation | c.604N>C | p.Tyr202His | p.Y202H | P04818 | protein_coding | deleterious(0.03) | possibly_damaging(0.83) | TCGA-EW-A1PD-01 | Breast | breast invasive carcinoma | Male | <65 | I/II | Chemotherapy | docetaxel | SD | |
| TYMS | insertion | Nonsense_Mutation | novel | c.576_577insGGCTGGAGTGCAGTGGTGTGATCTCCGCTCACGGCAA | p.Pro193GlyfsTer7 | p.P193Gfs*7 | P04818 | protein_coding | TCGA-BH-A0B8-01 | Breast | breast invasive carcinoma | Female | <65 | I/II | Hormone Therapy | arimidex | SD | ||
| TYMS | SNV | Missense_Mutation | c.687N>G | p.Ser229Arg | p.S229R | P04818 | protein_coding | deleterious(0) | probably_damaging(1) | TCGA-AA-3811-01 | Colorectum | colon adenocarcinoma | Female | >=65 | III/IV | Unknown | Unknown | PD | |
| TYMS | SNV | Missense_Mutation | c.700N>G | p.Thr234Ala | p.T234A | P04818 | protein_coding | deleterious(0.04) | benign(0.356) | TCGA-CA-6719-01 | Colorectum | colon adenocarcinoma | Male | >=65 | I/II | Unknown | Unknown | PD | |
| TYMS | SNV | Missense_Mutation | c.197N>A | p.Ser66Asn | p.S66N | P04818 | protein_coding | tolerated(0.37) | benign(0.003) | TCGA-G4-6588-01 | Colorectum | colon adenocarcinoma | Female | <65 | I/II | Unknown | Unknown | SD | |
| TYMS | SNV | Missense_Mutation | c.527N>A | p.Arg176Lys | p.R176K | P04818 | protein_coding | deleterious(0) | possibly_damaging(0.805) | TCGA-AH-6544-01 | Colorectum | rectum adenocarcinoma | Male | <65 | III/IV | Chemotherapy | oxaliplatin | SD | |
| TYMS | deletion | Frame_Shift_Del | c.486_487delAA | p.Arg163SerfsTer3 | p.R163Sfs*3 | P04818 | protein_coding | TCGA-A6-2686-01 | Colorectum | colon adenocarcinoma | Female | >=65 | I/II | Unknown | Unknown | SD | |||
| TYMS | SNV | Missense_Mutation | novel | c.724N>A | p.Gly242Ser | p.G242S | P04818 | protein_coding | deleterious(0.02) | benign(0.395) | TCGA-AX-A06F-01 | Endometrium | uterine corpus endometrioid carcinoma | Female | <65 | III/IV | Chemotherapy | carboplatin | SD |
| TYMS | SNV | Missense_Mutation | novel | c.233G>A | p.Arg78His | p.R78H | P04818 | protein_coding | deleterious(0) | probably_damaging(0.972) | TCGA-AX-A2HC-01 | Endometrium | uterine corpus endometrioid carcinoma | Female | <65 | III/IV | Chemotherapy | paclitaxel | PD |
| TYMS | SNV | Missense_Mutation | novel | c.369C>A | p.Phe123Leu | p.F123L | P04818 | protein_coding | tolerated(1) | benign(0.017) | TCGA-AX-A2HC-01 | Endometrium | uterine corpus endometrioid carcinoma | Female | <65 | III/IV | Chemotherapy | paclitaxel | PD |
| Page: 1 2 |
Top |
Related drugs of malignant transformation related genes |
| Identification of chemicals and drugs interact with genes involved in malignant transfromation |
| (DGIdb 4.0) |
| Entrez ID | Symbol | Category | Interaction Types | Drug Claim Name | Drug Name | PMIDs |
| 7298 | TYMS | ENZYME, DRUGGABLE GENOME, CLINICALLY ACTIONABLE, DRUG RESISTANCE | inhibitor | CHEMBL1200373 | ||
| 7298 | TYMS | ENZYME, DRUGGABLE GENOME, CLINICALLY ACTIONABLE, DRUG RESISTANCE | CAPECITABINE | CAPECITABINE | ||
| 7298 | TYMS | ENZYME, DRUGGABLE GENOME, CLINICALLY ACTIONABLE, DRUG RESISTANCE | OSI-7904L | OSI-7904 | ||
| 7298 | TYMS | ENZYME, DRUGGABLE GENOME, CLINICALLY ACTIONABLE, DRUG RESISTANCE | irinotecan | IRINOTECAN | 21273624,16456808 | |
| 7298 | TYMS | ENZYME, DRUGGABLE GENOME, CLINICALLY ACTIONABLE, DRUG RESISTANCE | HYDROCORTISONE | HYDROCORTISONE | 2707640 | |
| 7298 | TYMS | ENZYME, DRUGGABLE GENOME, CLINICALLY ACTIONABLE, DRUG RESISTANCE | METHOTREXATE | METHOTREXATE | 23652803 | |
| 7298 | TYMS | ENZYME, DRUGGABLE GENOME, CLINICALLY ACTIONABLE, DRUG RESISTANCE | FLUOROURACIL | FLUOROURACIL | 24450514 | |
| 7298 | TYMS | ENZYME, DRUGGABLE GENOME, CLINICALLY ACTIONABLE, DRUG RESISTANCE | TEGAFUR | TEGAFUR | ||
| 7298 | TYMS | ENZYME, DRUGGABLE GENOME, CLINICALLY ACTIONABLE, DRUG RESISTANCE | PEMETREXED | PEMETREXED | ||
| 7298 | TYMS | ENZYME, DRUGGABLE GENOME, CLINICALLY ACTIONABLE, DRUG RESISTANCE | INDOMETHACIN | INDOMETHACIN | 2707640 |
| Page: 1 2 3 4 5 6 7 |

Copyright 2023-Present -The University of Texas Health Science Center at Houston |