
|
|||||
|
 | |
| |
| |
| |
| |
| |
|
Gene: TYMP |
Gene summary for TYMP |
| Gene information | Species | Human | Gene symbol | TYMP | Gene ID | 1890 |
| Gene name | thymidine phosphorylase | |
| Gene Alias | ECGF | |
| Cytomap | 22q13.33 | |
| Gene Type | protein-coding | GO ID | GO:0000002 | UniProtAcc | B2RBL3 |
Top |
Malignant transformation analysis |
| Identification of the aberrant gene expression in precancerous and cancerous lesions by comparing the gene expression of stem-like cells in diseased tissues with normal stem cells |
| Entrez ID | Symbol | Replicates | Species | Organ | Tissue | Adj P-value | Log2FC | Malignancy |
| 1890 | TYMP | GSM4909285 | Human | Breast | IDC | 1.67e-05 | -3.49e-01 | 0.21 |
| 1890 | TYMP | GSM4909286 | Human | Breast | IDC | 3.23e-26 | -5.84e-01 | 0.1081 |
| 1890 | TYMP | GSM4909290 | Human | Breast | IDC | 1.01e-08 | 5.28e-01 | 0.2096 |
| 1890 | TYMP | GSM4909293 | Human | Breast | IDC | 2.39e-04 | -2.31e-01 | 0.1581 |
| 1890 | TYMP | GSM4909296 | Human | Breast | IDC | 2.89e-26 | -5.51e-01 | 0.1524 |
| 1890 | TYMP | GSM4909297 | Human | Breast | IDC | 1.38e-11 | -2.52e-01 | 0.1517 |
| 1890 | TYMP | GSM4909298 | Human | Breast | IDC | 1.95e-17 | -5.10e-01 | 0.1551 |
| 1890 | TYMP | GSM4909299 | Human | Breast | IDC | 6.11e-03 | -2.03e-01 | 0.035 |
| 1890 | TYMP | GSM4909301 | Human | Breast | IDC | 1.85e-02 | -2.74e-01 | 0.1577 |
| 1890 | TYMP | GSM4909302 | Human | Breast | IDC | 2.16e-02 | -2.85e-01 | 0.1545 |
| 1890 | TYMP | GSM4909311 | Human | Breast | IDC | 1.28e-31 | -4.24e-01 | 0.1534 |
| 1890 | TYMP | GSM4909312 | Human | Breast | IDC | 3.69e-14 | -3.38e-01 | 0.1552 |
| 1890 | TYMP | GSM4909315 | Human | Breast | IDC | 4.31e-06 | -3.59e-01 | 0.21 |
| 1890 | TYMP | GSM4909319 | Human | Breast | IDC | 3.65e-33 | -2.55e-01 | 0.1563 |
| 1890 | TYMP | GSM4909321 | Human | Breast | IDC | 3.71e-11 | 2.92e-01 | 0.1559 |
| 1890 | TYMP | brca1 | Human | Breast | Precancer | 6.78e-24 | 7.23e-01 | -0.0338 |
| 1890 | TYMP | brca2 | Human | Breast | Precancer | 1.40e-25 | 6.44e-01 | -0.024 |
| 1890 | TYMP | brca3 | Human | Breast | Precancer | 2.33e-18 | 4.98e-01 | -0.0263 |
| 1890 | TYMP | NCCBC14 | Human | Breast | DCIS | 4.00e-02 | -3.33e-02 | 0.2021 |
| 1890 | TYMP | NCCBC5 | Human | Breast | DCIS | 5.94e-21 | 4.86e-01 | 0.2046 |
| Page: 1 2 3 4 5 6 7 8 9 10 |
| Tissue | Expression Dynamics | Abbreviation |
| Breast | 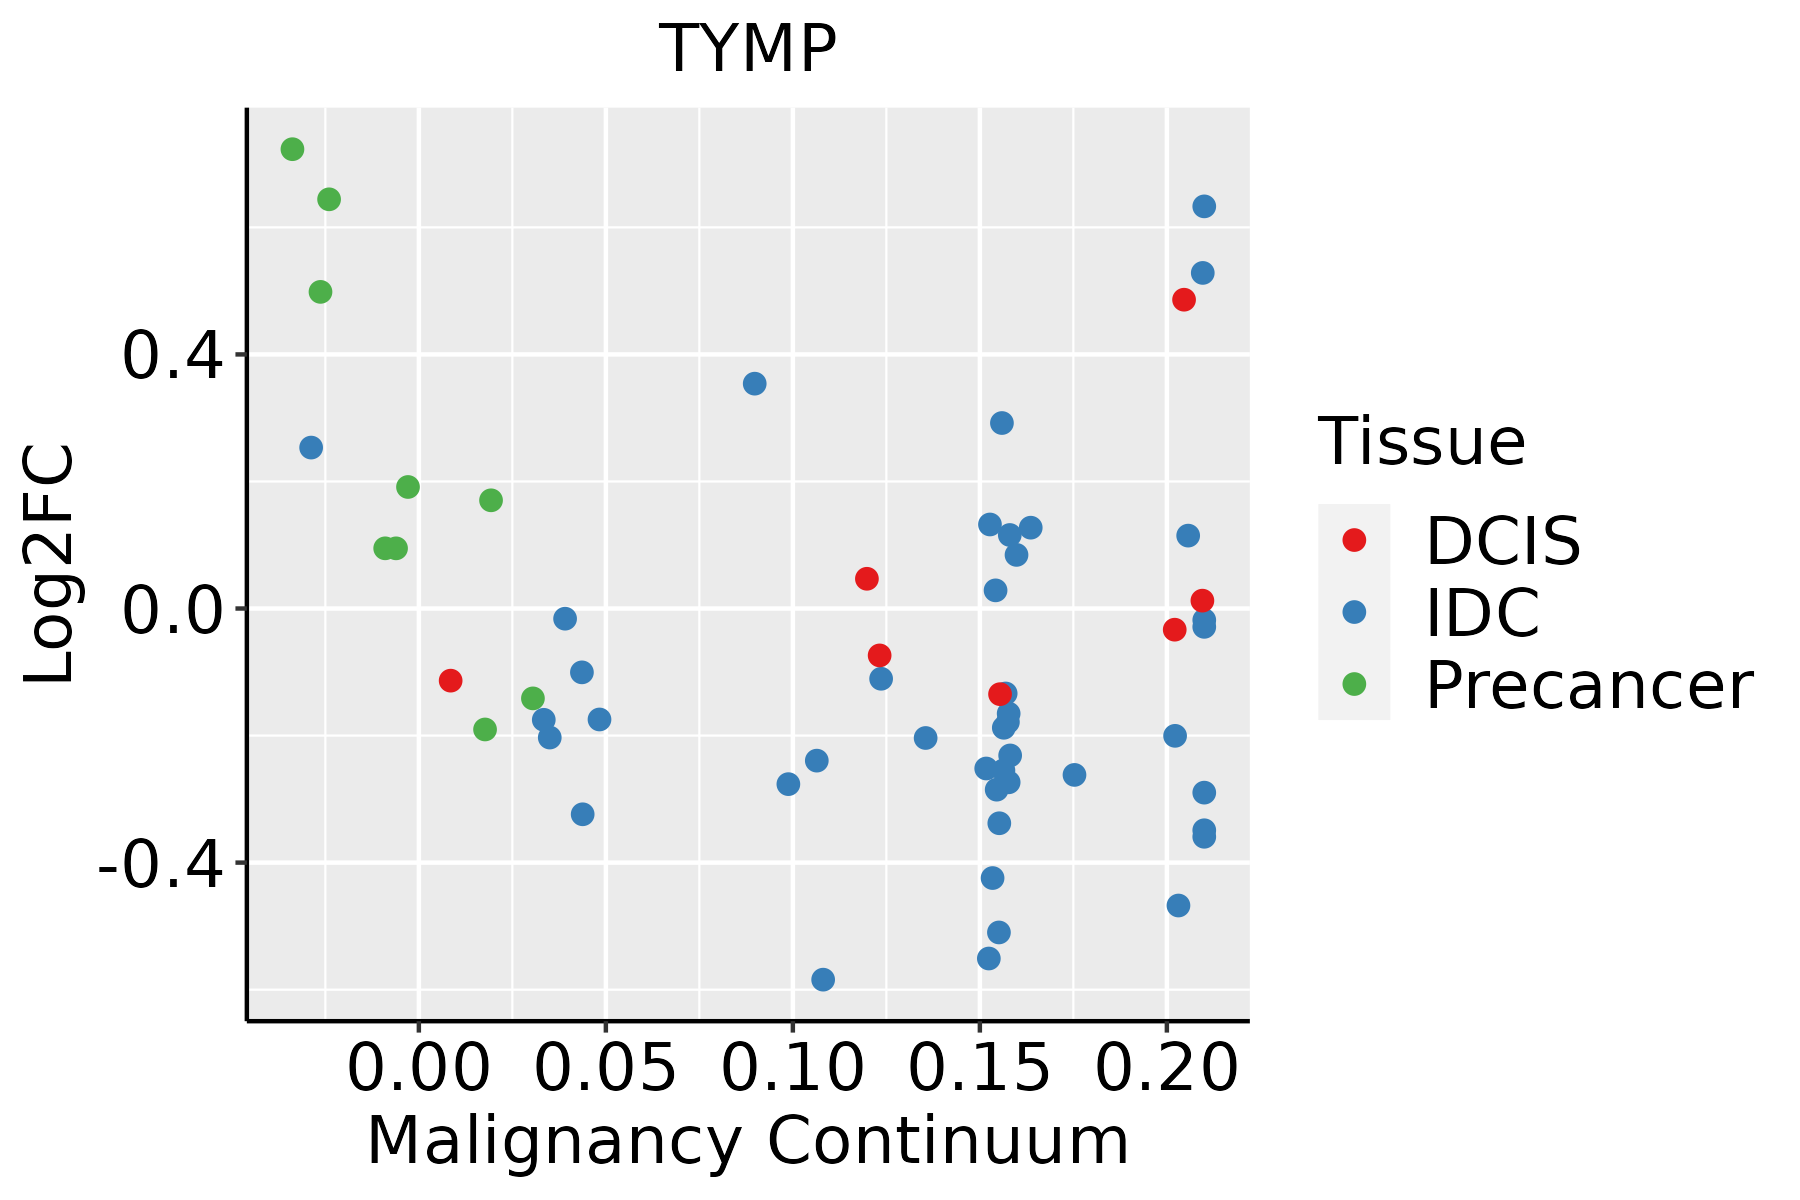 | IDC: Invasive ductal carcinoma |
| DCIS: Ductal carcinoma in situ | ||
| Precancer(BRCA1-mut): Precancerous lesion from BRCA1 mutation carriers | ||
| Cervix | 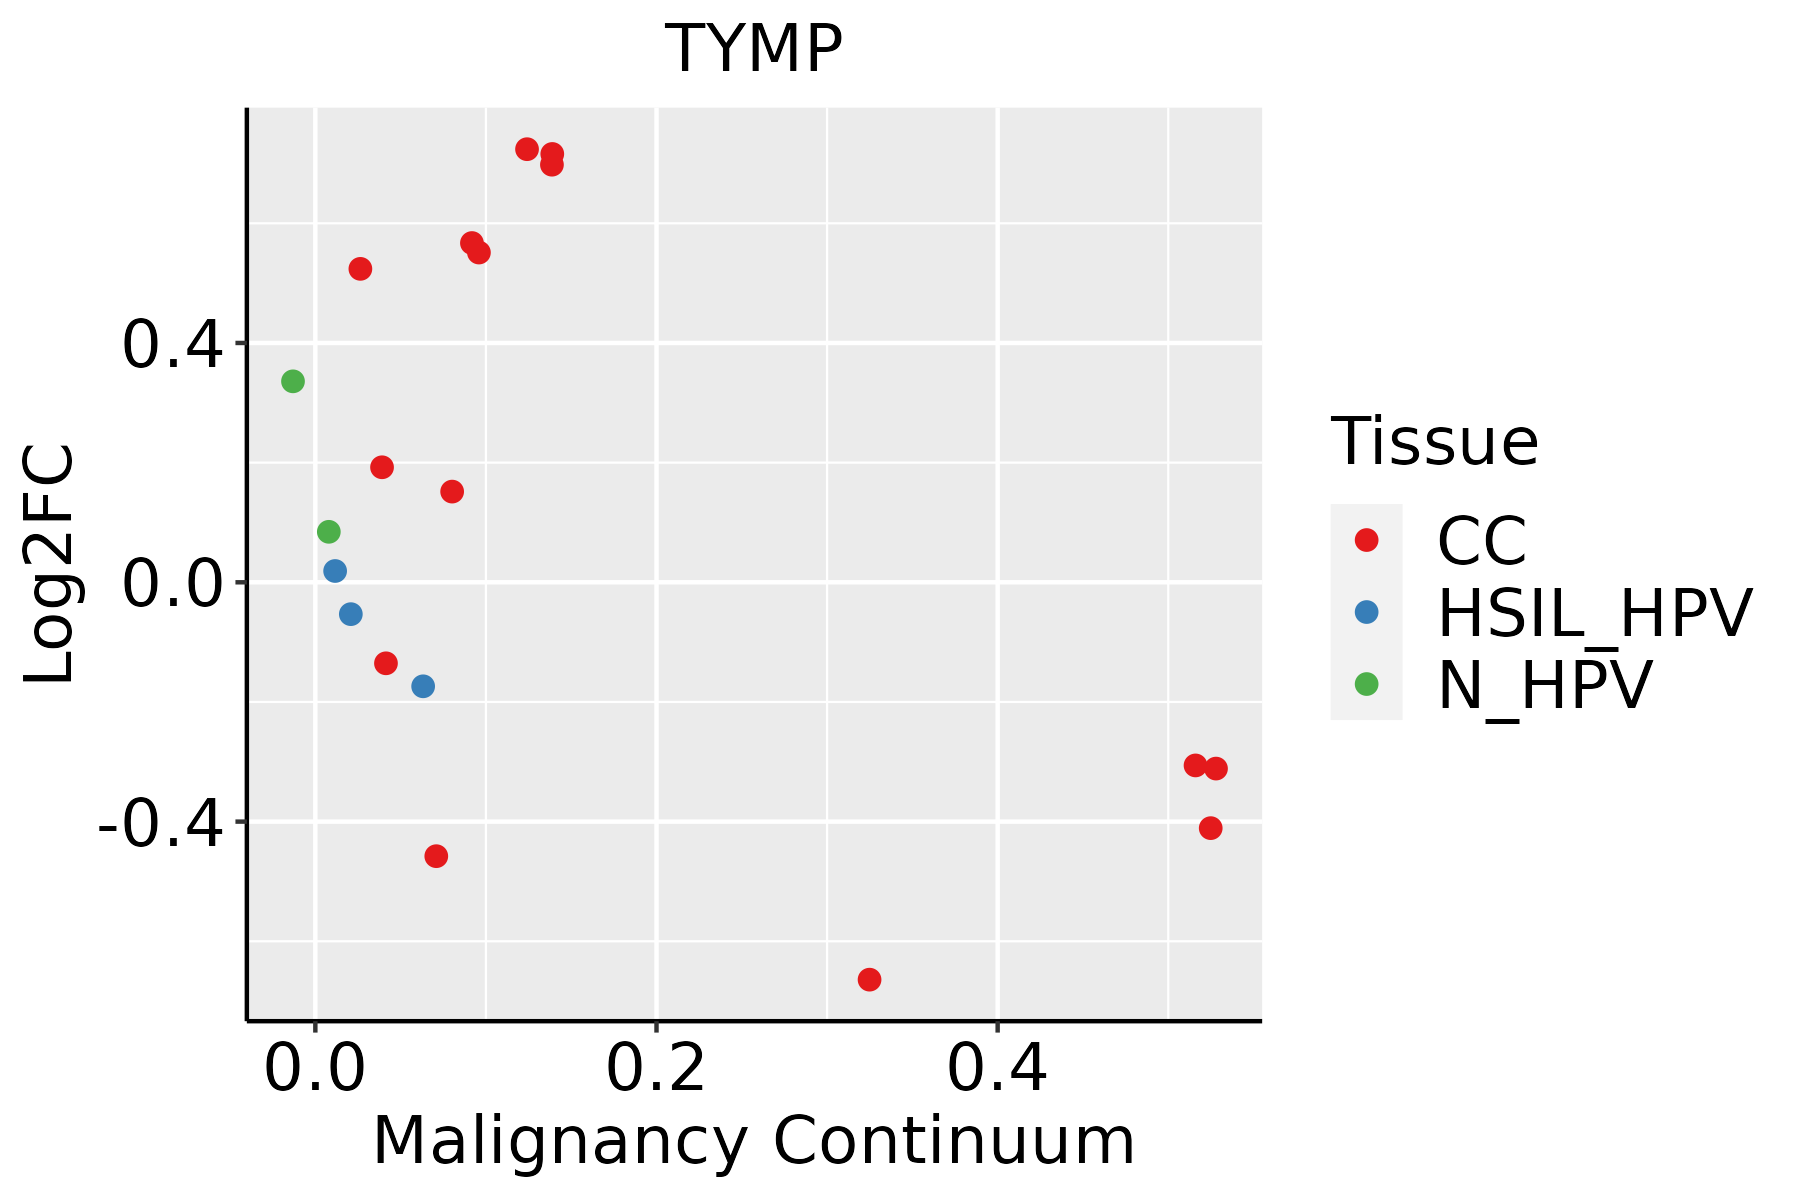 | CC: Cervix cancer |
| HSIL_HPV: HPV-infected high-grade squamous intraepithelial lesions | ||
| N_HPV: HPV-infected normal cervix | ||
| Esophagus | 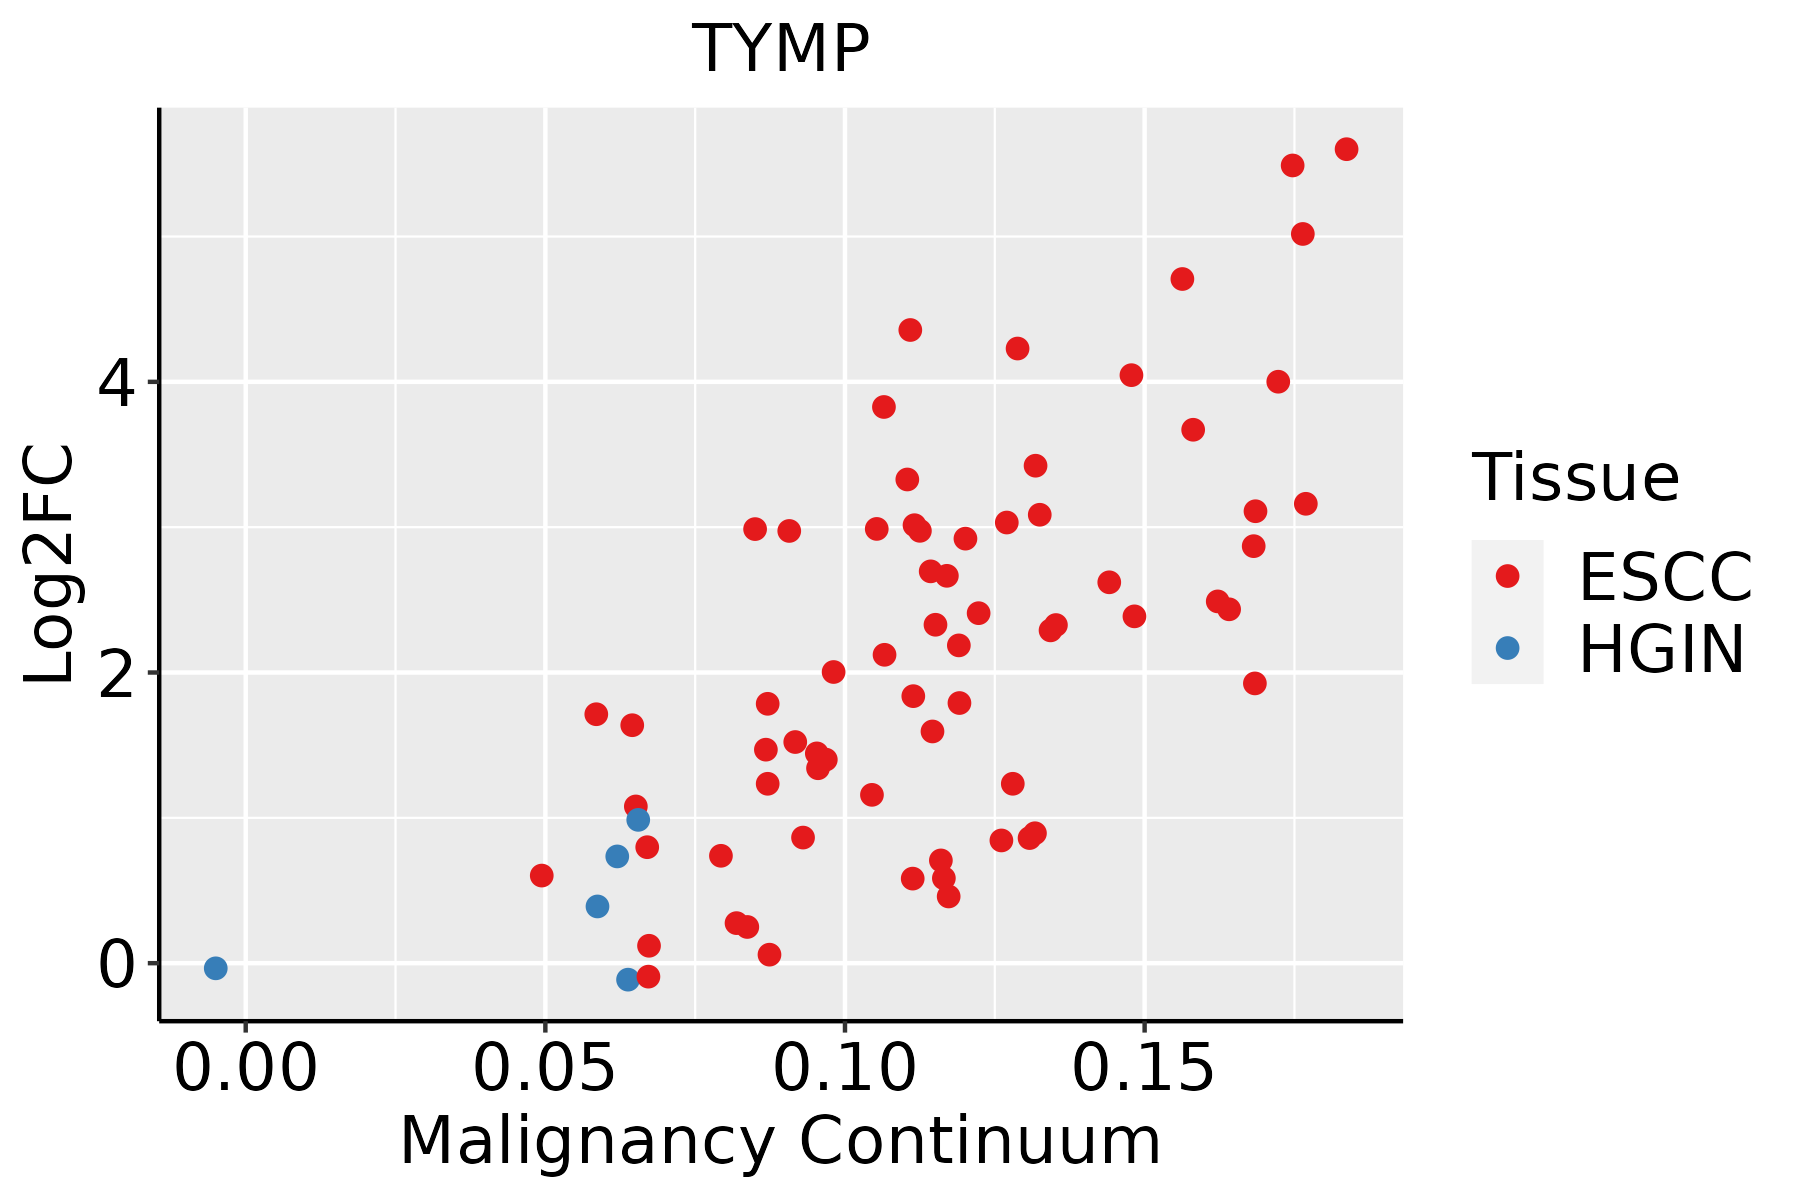 | ESCC: Esophageal squamous cell carcinoma |
| HGIN: High-grade intraepithelial neoplasias | ||
| LGIN: Low-grade intraepithelial neoplasias | ||
| GC |  | CAG: Chronic atrophic gastritis |
| CAG with IM: Chronic atrophic gastritis with intestinal metaplasia | ||
| CSG: Chronic superficial gastritis | ||
| GC: Gastric cancer | ||
| SIM: Severe intestinal metaplasia | ||
| WIM: Wild intestinal metaplasia | ||
| Liver | 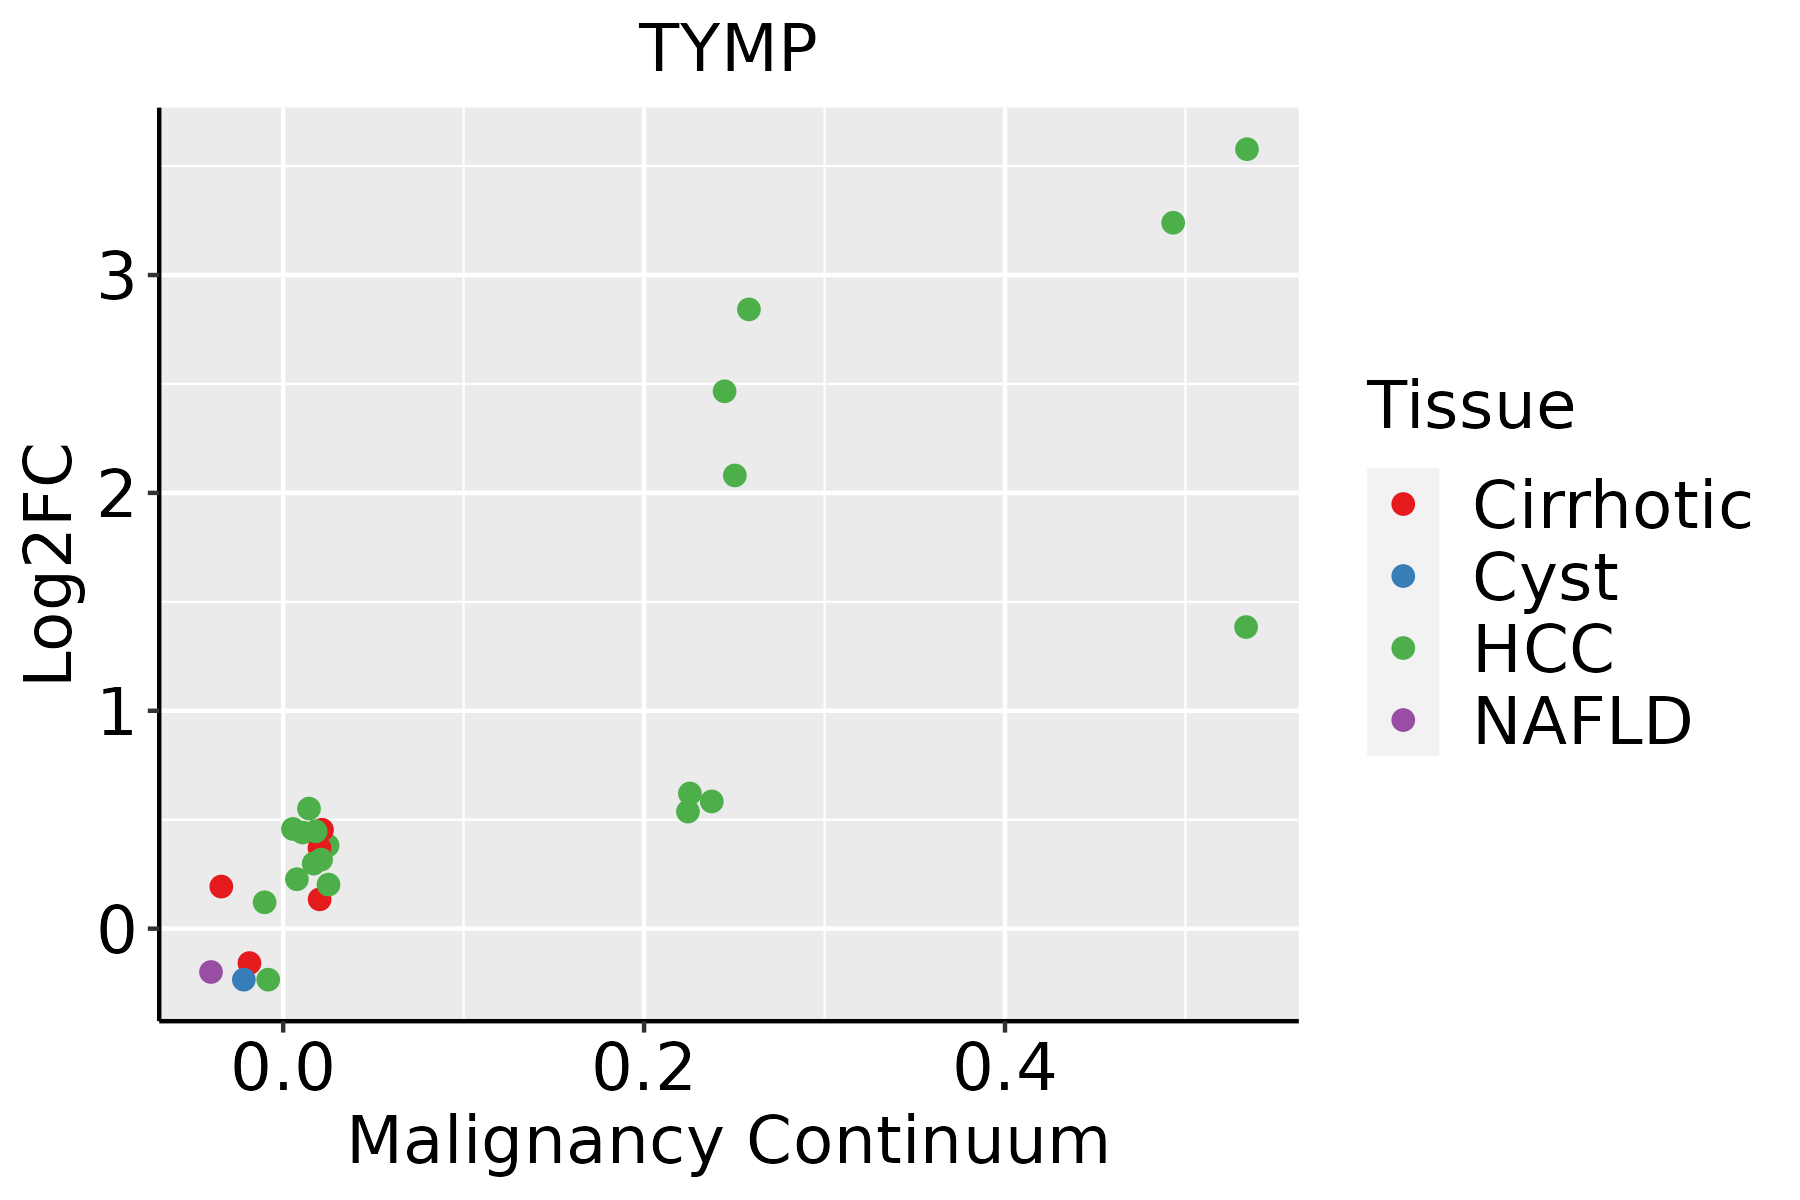 | HCC: Hepatocellular carcinoma |
| NAFLD: Non-alcoholic fatty liver disease | ||
| Lung |  | AAH: Atypical adenomatous hyperplasia |
| AIS: Adenocarcinoma in situ | ||
| IAC: Invasive lung adenocarcinoma | ||
| MIA: Minimally invasive adenocarcinoma | ||
| Oral Cavity |  | EOLP: Erosive Oral lichen planus |
| LP: leukoplakia | ||
| NEOLP: Non-erosive oral lichen planus | ||
| OSCC: Oral squamous cell carcinoma | ||
| Skin | 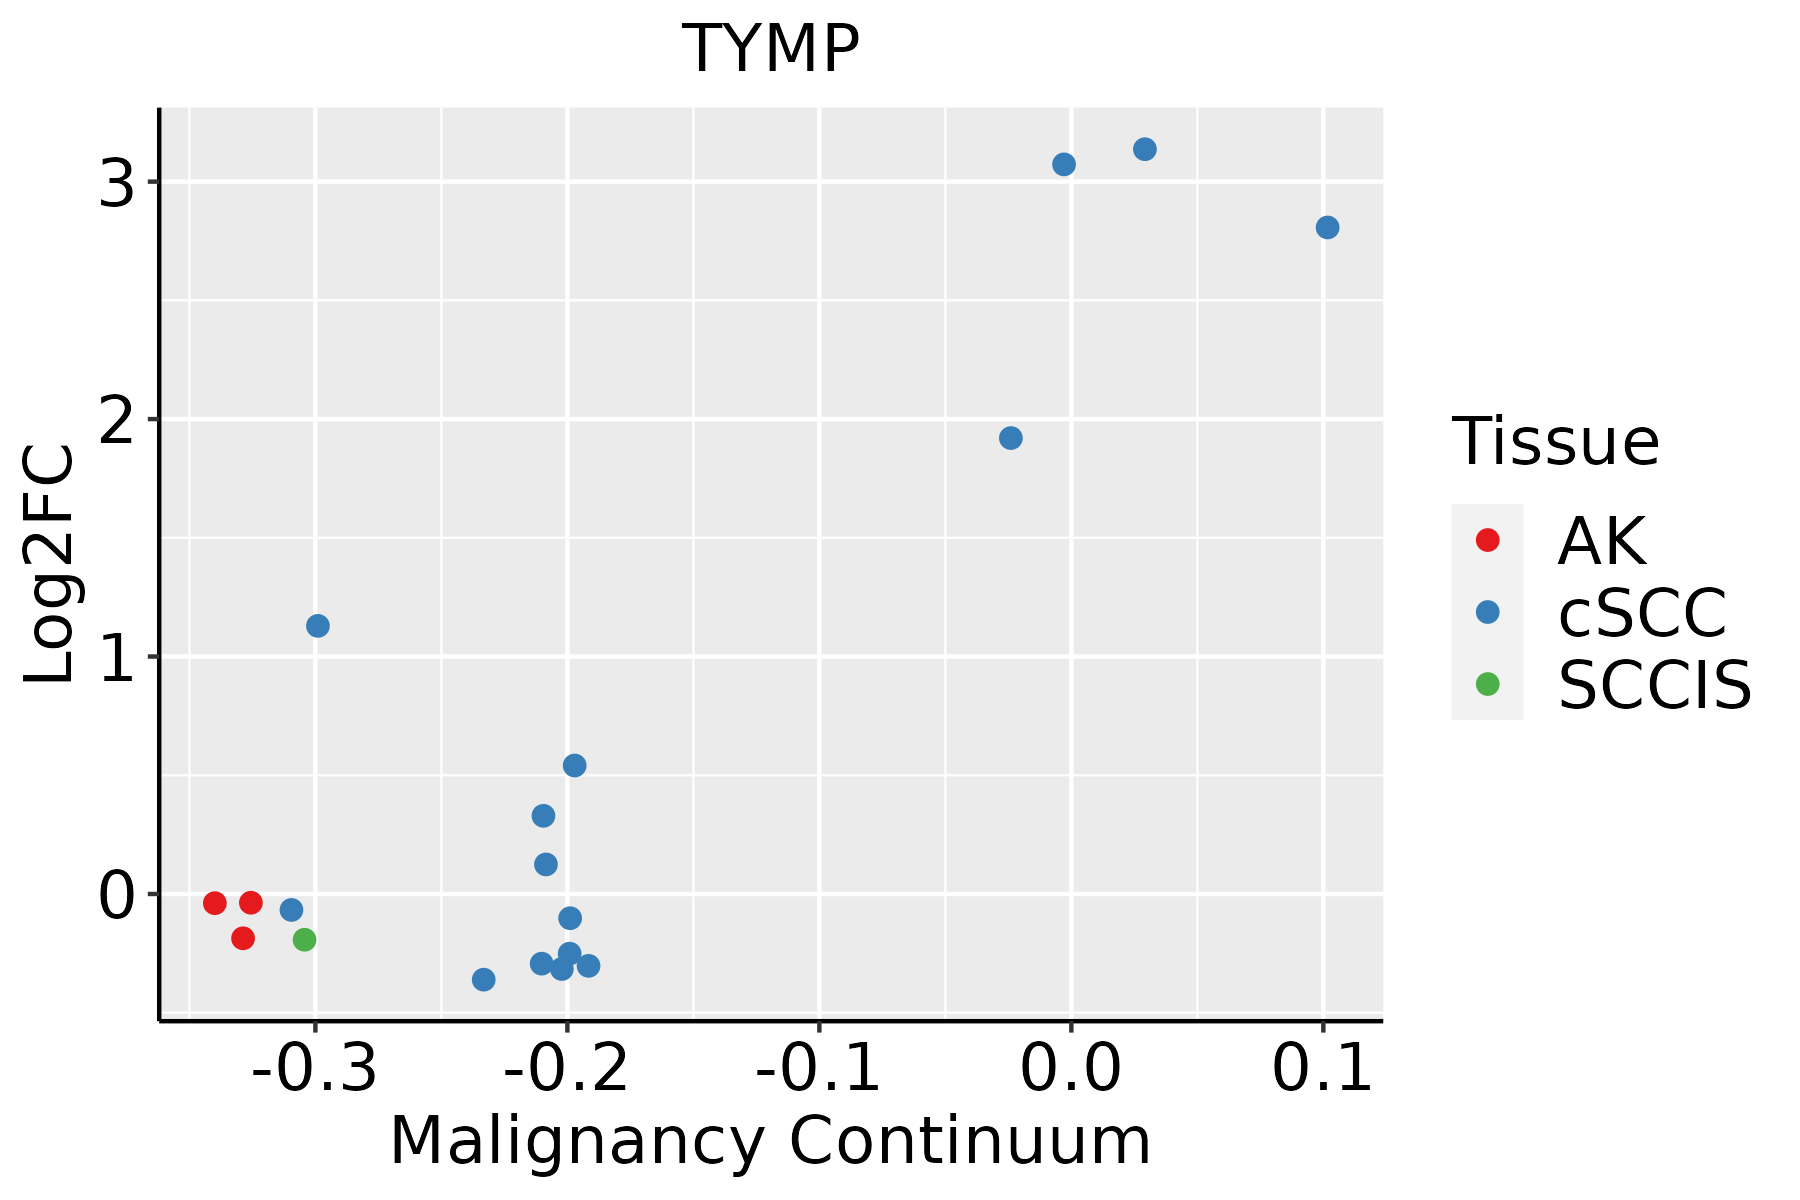 | AK: Actinic keratosis |
| cSCC: Cutaneous squamous cell carcinoma | ||
| SCCIS:squamous cell carcinoma in situ | ||
| Thyroid | 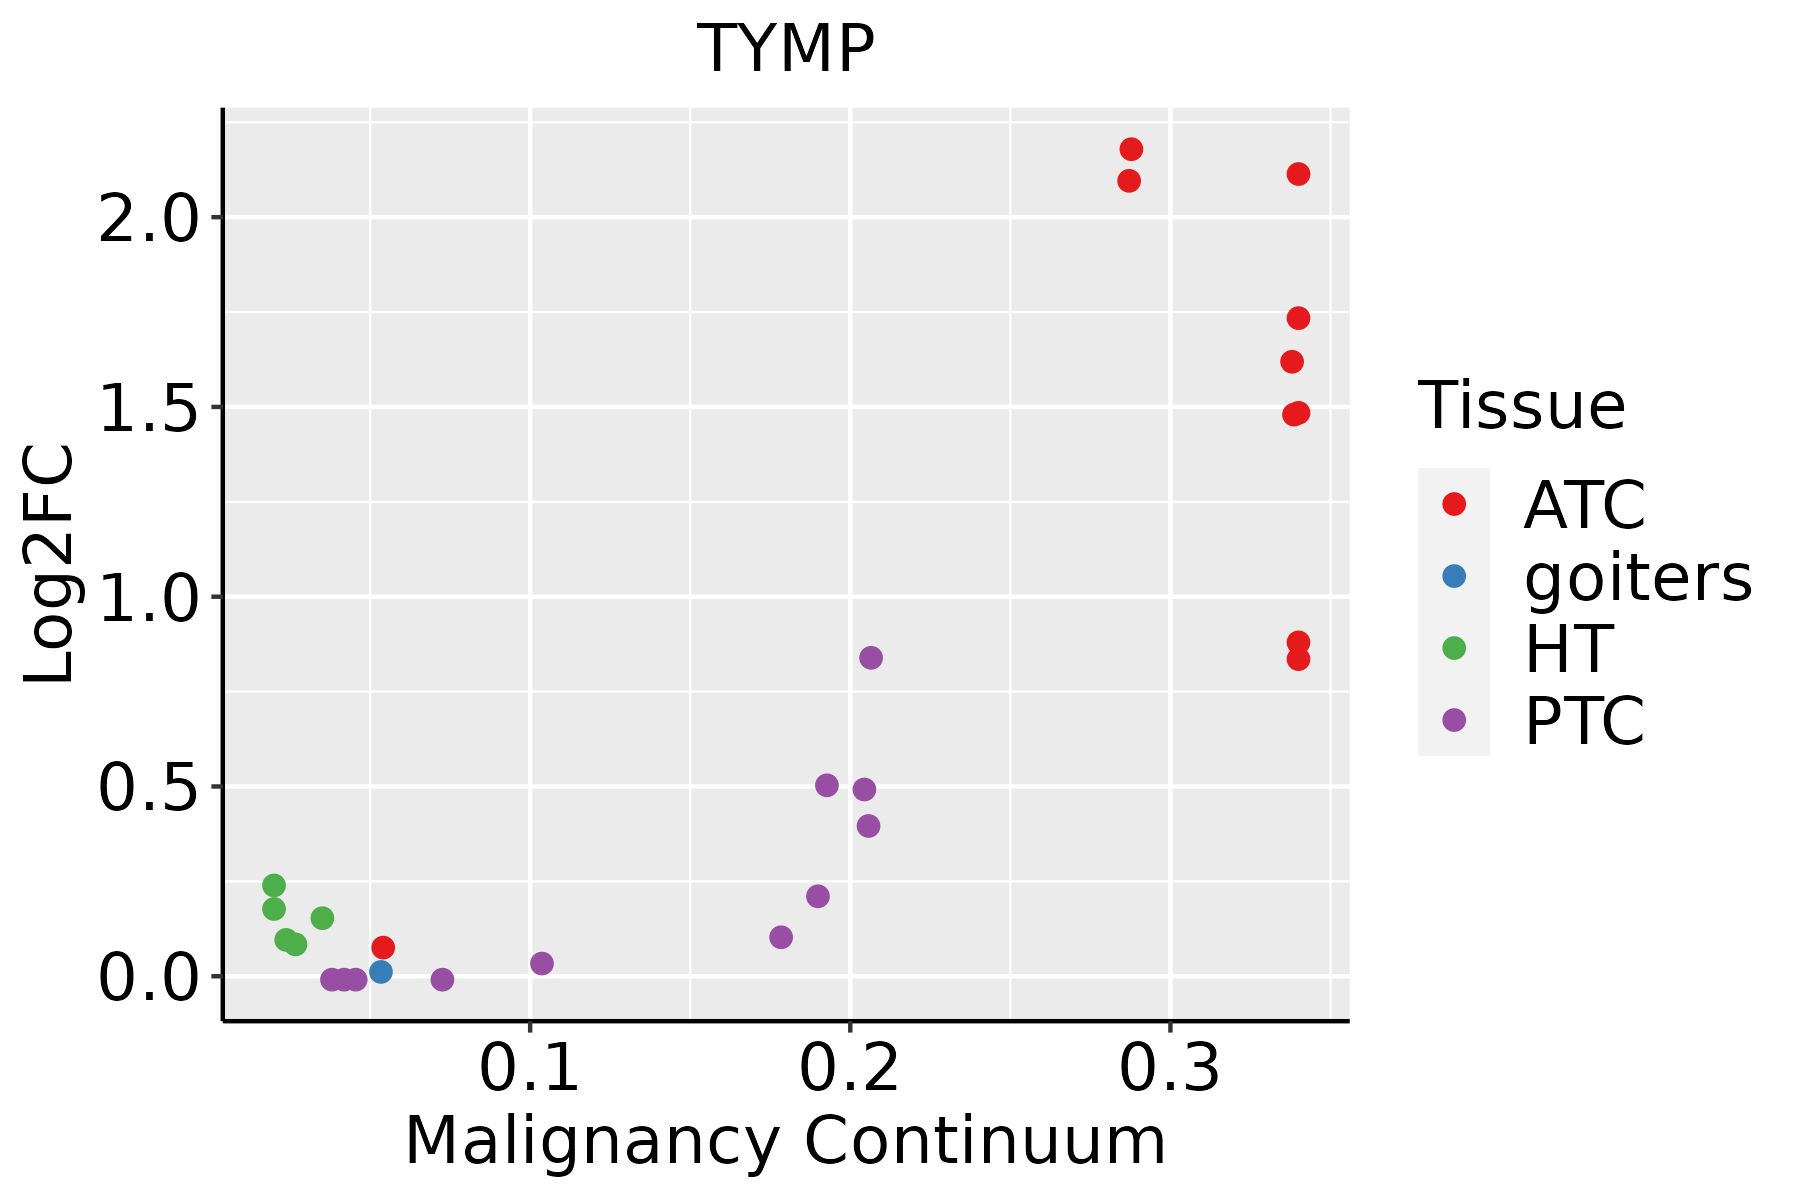 | ATC: Anaplastic thyroid cancer |
| HT: Hashimoto's thyroiditis | ||
| PTC: Papillary thyroid cancer |
| ∗log2FC in expression of this searched gene in stem-like cells from each diseased tissue sample relative to stem-like cells in normal samples in each tissue plotted against the malignancy continuum. Samples are colored based on if they are from different disease stage. |
Top |
Malignant transformation related pathway analysis |
| Find out the enriched GO biological processes and KEGG pathways involved in transition from healthy to precancer to cancer |
| Tissue | Disease Stage | Enriched GO biological Processes |
| Colorectum | AD |  |
| Colorectum | SER |  |
| Colorectum | MSS |  |
| Colorectum | MSI-H |  |
| Colorectum | FAP |  |
| ∗Top 15 enriched GO BP terms are showed in the bar plot of each disease state in each tissue. Each row represents a significant GO biological process which is colored according to the -log10(p.adjust). |
| Page: 1 2 3 4 5 6 7 8 9 |
| GO ID | Tissue | Disease Stage | Description | Gene Ratio | Bg Ratio | pvalue | p.adjust | Count |
| GO:00091179 | Breast | Precancer | nucleotide metabolic process | 56/1080 | 489/18723 | 7.40e-07 | 3.00e-05 | 56 |
| GO:00067539 | Breast | Precancer | nucleoside phosphate metabolic process | 56/1080 | 497/18723 | 1.24e-06 | 4.70e-05 | 56 |
| GO:00346558 | Breast | Precancer | nucleobase-containing compound catabolic process | 42/1080 | 407/18723 | 1.91e-04 | 3.06e-03 | 42 |
| GO:00467007 | Breast | Precancer | heterocycle catabolic process | 44/1080 | 445/18723 | 3.49e-04 | 4.88e-03 | 44 |
| GO:00442708 | Breast | Precancer | cellular nitrogen compound catabolic process | 44/1080 | 451/18723 | 4.64e-04 | 6.12e-03 | 44 |
| GO:00194397 | Breast | Precancer | aromatic compound catabolic process | 44/1080 | 467/18723 | 9.55e-04 | 1.07e-02 | 44 |
| GO:19013617 | Breast | Precancer | organic cyclic compound catabolic process | 45/1080 | 495/18723 | 1.73e-03 | 1.74e-02 | 45 |
| GO:000675313 | Breast | IDC | nucleoside phosphate metabolic process | 68/1434 | 497/18723 | 2.01e-06 | 8.23e-05 | 68 |
| GO:000911713 | Breast | IDC | nucleotide metabolic process | 67/1434 | 489/18723 | 2.28e-06 | 9.05e-05 | 67 |
| GO:190136112 | Breast | IDC | organic cyclic compound catabolic process | 56/1434 | 495/18723 | 2.12e-03 | 1.99e-02 | 56 |
| GO:004670012 | Breast | IDC | heterocycle catabolic process | 51/1434 | 445/18723 | 2.51e-03 | 2.25e-02 | 51 |
| GO:003465513 | Breast | IDC | nucleobase-containing compound catabolic process | 47/1434 | 407/18723 | 3.12e-03 | 2.63e-02 | 47 |
| GO:004427012 | Breast | IDC | cellular nitrogen compound catabolic process | 50/1434 | 451/18723 | 5.29e-03 | 3.93e-02 | 50 |
| GO:001943912 | Breast | IDC | aromatic compound catabolic process | 51/1434 | 467/18723 | 6.54e-03 | 4.59e-02 | 51 |
| GO:000911723 | Breast | DCIS | nucleotide metabolic process | 65/1390 | 489/18723 | 3.19e-06 | 1.03e-04 | 65 |
| GO:000675323 | Breast | DCIS | nucleoside phosphate metabolic process | 65/1390 | 497/18723 | 5.51e-06 | 1.59e-04 | 65 |
| GO:003465522 | Breast | DCIS | nucleobase-containing compound catabolic process | 47/1390 | 407/18723 | 1.69e-03 | 1.68e-02 | 47 |
| GO:190136122 | Breast | DCIS | organic cyclic compound catabolic process | 55/1390 | 495/18723 | 1.75e-03 | 1.71e-02 | 55 |
| GO:004670022 | Breast | DCIS | heterocycle catabolic process | 50/1390 | 445/18723 | 2.19e-03 | 2.03e-02 | 50 |
| GO:001943922 | Breast | DCIS | aromatic compound catabolic process | 51/1390 | 467/18723 | 3.58e-03 | 2.92e-02 | 51 |
| Page: 1 2 3 4 5 6 7 8 9 10 11 12 |
| Pathway ID | Tissue | Disease Stage | Description | Gene Ratio | Bg Ratio | pvalue | p.adjust | qvalue | Count |
| hsa052196 | Breast | Precancer | Bladder cancer | 9/684 | 41/8465 | 4.65e-03 | 2.72e-02 | 2.08e-02 | 9 |
| hsa0521913 | Breast | Precancer | Bladder cancer | 9/684 | 41/8465 | 4.65e-03 | 2.72e-02 | 2.08e-02 | 9 |
| hsa0521921 | Breast | IDC | Bladder cancer | 10/867 | 41/8465 | 7.07e-03 | 3.54e-02 | 2.65e-02 | 10 |
| hsa0521931 | Breast | IDC | Bladder cancer | 10/867 | 41/8465 | 7.07e-03 | 3.54e-02 | 2.65e-02 | 10 |
| hsa0521941 | Breast | DCIS | Bladder cancer | 10/846 | 41/8465 | 5.96e-03 | 3.01e-02 | 2.21e-02 | 10 |
| hsa0521951 | Breast | DCIS | Bladder cancer | 10/846 | 41/8465 | 5.96e-03 | 3.01e-02 | 2.21e-02 | 10 |
| hsa052197 | Cervix | CC | Bladder cancer | 16/1267 | 41/8465 | 1.45e-04 | 9.05e-04 | 5.35e-04 | 16 |
| hsa0521914 | Cervix | CC | Bladder cancer | 16/1267 | 41/8465 | 1.45e-04 | 9.05e-04 | 5.35e-04 | 16 |
| hsa0521910 | Esophagus | ESCC | Bladder cancer | 35/4205 | 41/8465 | 1.91e-06 | 1.15e-05 | 5.87e-06 | 35 |
| hsa012325 | Esophagus | ESCC | Nucleotide metabolism | 59/4205 | 85/8465 | 1.67e-04 | 6.58e-04 | 3.37e-04 | 59 |
| hsa002405 | Esophagus | ESCC | Pyrimidine metabolism | 41/4205 | 58/8465 | 9.14e-04 | 2.92e-03 | 1.49e-03 | 41 |
| hsa0521917 | Esophagus | ESCC | Bladder cancer | 35/4205 | 41/8465 | 1.91e-06 | 1.15e-05 | 5.87e-06 | 35 |
| hsa0123212 | Esophagus | ESCC | Nucleotide metabolism | 59/4205 | 85/8465 | 1.67e-04 | 6.58e-04 | 3.37e-04 | 59 |
| hsa0024012 | Esophagus | ESCC | Pyrimidine metabolism | 41/4205 | 58/8465 | 9.14e-04 | 2.92e-03 | 1.49e-03 | 41 |
| hsa052194 | Liver | Cirrhotic | Bladder cancer | 25/2530 | 41/8465 | 3.48e-05 | 2.57e-04 | 1.59e-04 | 25 |
| hsa01232 | Liver | Cirrhotic | Nucleotide metabolism | 39/2530 | 85/8465 | 1.27e-03 | 6.73e-03 | 4.15e-03 | 39 |
| hsa00240 | Liver | Cirrhotic | Pyrimidine metabolism | 27/2530 | 58/8465 | 5.31e-03 | 1.88e-02 | 1.16e-02 | 27 |
| hsa00983 | Liver | Cirrhotic | Drug metabolism - other enzymes | 34/2530 | 80/8465 | 1.08e-02 | 3.57e-02 | 2.20e-02 | 34 |
| hsa0521911 | Liver | Cirrhotic | Bladder cancer | 25/2530 | 41/8465 | 3.48e-05 | 2.57e-04 | 1.59e-04 | 25 |
| hsa012321 | Liver | Cirrhotic | Nucleotide metabolism | 39/2530 | 85/8465 | 1.27e-03 | 6.73e-03 | 4.15e-03 | 39 |
| Page: 1 2 3 |
Top |
Cell-cell communication analysis |
| Identification of potential cell-cell interactions between two cell types and their ligand-receptor pairs for different disease states |
| Ligand | Receptor | LRpair | Pathway | Tissue | Disease Stage |
| Page: 1 |
Top |
Single-cell gene regulatory network inference analysis |
| Find out the significant the regulons (TFs) and the target genes of each regulon across cell types for different disease states |
| TF | Cell Type | Tissue | Disease Stage | Target Gene | RSS | Regulon Activity |
| ∗The dot plots of a searched regulon are shown for all cell subpopulations in each disease state of each tissue based on the regulon specific score inferred using pySCENIC and by calculating the average expression. |
| Page: 1 |
Top |
Somatic mutation of malignant transformation related genes |
| Annotation of somatic variants for genes involved in malignant transformation |
| Hugo Symbol | Variant Class | Variant Classification | dbSNP RS | HGVSc | HGVSp | HGVSp Short | SWISSPROT | BIOTYPE | SIFT | PolyPhen | Tumor Sample Barcode | Tissue | Histology | Sex | Age | Stage | Therapy Types | Drugs | Outcome |
| TYMP | SNV | Missense_Mutation | novel | c.293C>G | p.Ser98Trp | p.S98W | P19971 | protein_coding | deleterious(0) | probably_damaging(1) | TCGA-GI-A2C9-01 | Breast | breast invasive carcinoma | Female | <65 | I/II | Unspecific | SD | |
| TYMP | SNV | Missense_Mutation | rs776356925 | c.196N>A | p.Ala66Thr | p.A66T | P19971 | protein_coding | tolerated(0.11) | possibly_damaging(0.649) | TCGA-2W-A8YY-01 | Cervix | cervical & endocervical cancer | Female | <65 | I/II | Chemotherapy | cisplatin | CR |
| TYMP | SNV | Missense_Mutation | rs768461642 | c.151N>A | p.Glu51Lys | p.E51K | P19971 | protein_coding | tolerated(0.55) | benign(0.007) | TCGA-C5-A3HD-01 | Cervix | cervical & endocervical cancer | Female | <65 | I/II | Chemotherapy | cisplatin | SD |
| TYMP | SNV | Missense_Mutation | rs201513101 | c.316G>C | p.Glu106Gln | p.E106Q | P19971 | protein_coding | tolerated(0.15) | benign(0.037) | TCGA-MY-A5BD-01 | Cervix | cervical & endocervical cancer | Female | <65 | I/II | Chemotherapy | cisplatin | CR |
| TYMP | SNV | Missense_Mutation | c.426G>A | p.Met142Ile | p.M142I | P19971 | protein_coding | deleterious(0) | probably_damaging(0.999) | TCGA-AA-3864-01 | Colorectum | colon adenocarcinoma | Male | >=65 | I/II | Unknown | Unknown | SD | |
| TYMP | SNV | Missense_Mutation | novel | c.581N>T | p.Ala194Val | p.A194V | P19971 | protein_coding | deleterious(0.02) | probably_damaging(0.974) | TCGA-AA-A00N-01 | Colorectum | colon adenocarcinoma | Male | >=65 | I/II | Unknown | Unknown | PD |
| TYMP | SNV | Missense_Mutation | novel | c.239N>G | p.Leu80Arg | p.L80R | P19971 | protein_coding | deleterious(0.01) | probably_damaging(0.999) | TCGA-AA-A010-01 | Colorectum | colon adenocarcinoma | Female | <65 | I/II | Chemotherapy | folinic | CR |
| TYMP | SNV | Missense_Mutation | c.383T>A | p.Val128Asp | p.V128D | P19971 | protein_coding | deleterious(0.01) | probably_damaging(0.91) | TCGA-AD-6964-01 | Colorectum | colon adenocarcinoma | Male | <65 | III/IV | Chemotherapy | folfox | PD | |
| TYMP | SNV | Missense_Mutation | c.413N>T | p.Cys138Phe | p.C138F | P19971 | protein_coding | tolerated(0.11) | probably_damaging(1) | TCGA-DM-A28C-01 | Colorectum | colon adenocarcinoma | Male | >=65 | I/II | Unknown | Unknown | PD | |
| TYMP | SNV | Missense_Mutation | c.249N>T | p.Met83Ile | p.M83I | P19971 | protein_coding | deleterious(0.01) | probably_damaging(0.997) | TCGA-G4-6588-01 | Colorectum | colon adenocarcinoma | Female | <65 | I/II | Unknown | Unknown | SD |
| Page: 1 2 3 |
Top |
Related drugs of malignant transformation related genes |
| Identification of chemicals and drugs interact with genes involved in malignant transfromation |
| (DGIdb 4.0) |
| Entrez ID | Symbol | Category | Interaction Types | Drug Claim Name | Drug Name | PMIDs |
| 1890 | TYMP | GROWTH FACTOR, DRUGGABLE GENOME | FLUOROURACIL | FLUOROURACIL | 11205264 | |
| 1890 | TYMP | GROWTH FACTOR, DRUGGABLE GENOME | S-1 | 16685374 | ||
| 1890 | TYMP | GROWTH FACTOR, DRUGGABLE GENOME | fluorouracil | FLUOROURACIL | 24167597 | |
| 1890 | TYMP | GROWTH FACTOR, DRUGGABLE GENOME | capecitabine | CAPECITABINE | 24167597 | |
| 1890 | TYMP | GROWTH FACTOR, DRUGGABLE GENOME | inhibitor | CHEMBL65375 | TIPIRACIL HYDROCHLORIDE | |
| 1890 | TYMP | GROWTH FACTOR, DRUGGABLE GENOME | MPA | PROGESTERONE | 12711006 | |
| 1890 | TYMP | GROWTH FACTOR, DRUGGABLE GENOME | SULFASALAZINE | SULFASALAZINE | 15269287 | |
| 1890 | TYMP | GROWTH FACTOR, DRUGGABLE GENOME | Uridine | URIDINE | ||
| 1890 | TYMP | GROWTH FACTOR, DRUGGABLE GENOME | 5-DEOXY-5-FLUOROURIDINE | 11956613 |
| Page: 1 |

Copyright 2023-Present -The University of Texas Health Science Center at Houston |