
|
|||||
|
 | |
| |
| |
| |
| |
| |
|
Gene: TXNRD2 |
Gene summary for TXNRD2 |
| Gene information | Species | Human | Gene symbol | TXNRD2 | Gene ID | 10587 |
| Gene name | thioredoxin reductase 2 | |
| Gene Alias | GCCD5 | |
| Cytomap | 22q11.21 | |
| Gene Type | protein-coding | GO ID | GO:0000302 | UniProtAcc | E7EWK1 |
Top |
Malignant transformation analysis |
| Identification of the aberrant gene expression in precancerous and cancerous lesions by comparing the gene expression of stem-like cells in diseased tissues with normal stem cells |
| Entrez ID | Symbol | Replicates | Species | Organ | Tissue | Adj P-value | Log2FC | Malignancy |
| 10587 | TXNRD2 | LZE20T | Human | Esophagus | ESCC | 4.21e-03 | 1.65e-01 | 0.0662 |
| 10587 | TXNRD2 | LZE24T | Human | Esophagus | ESCC | 2.03e-08 | 2.53e-01 | 0.0596 |
| 10587 | TXNRD2 | LZE21T | Human | Esophagus | ESCC | 4.30e-02 | 1.74e-01 | 0.0655 |
| 10587 | TXNRD2 | P1T-E | Human | Esophagus | ESCC | 3.37e-05 | 2.80e-01 | 0.0875 |
| 10587 | TXNRD2 | P2T-E | Human | Esophagus | ESCC | 2.14e-21 | 2.51e-01 | 0.1177 |
| 10587 | TXNRD2 | P4T-E | Human | Esophagus | ESCC | 1.73e-19 | 4.05e-01 | 0.1323 |
| 10587 | TXNRD2 | P5T-E | Human | Esophagus | ESCC | 3.42e-12 | 1.89e-01 | 0.1327 |
| 10587 | TXNRD2 | P8T-E | Human | Esophagus | ESCC | 4.12e-15 | 2.96e-01 | 0.0889 |
| 10587 | TXNRD2 | P9T-E | Human | Esophagus | ESCC | 2.09e-03 | 2.51e-01 | 0.1131 |
| 10587 | TXNRD2 | P10T-E | Human | Esophagus | ESCC | 1.06e-84 | 1.77e+00 | 0.116 |
| 10587 | TXNRD2 | P11T-E | Human | Esophagus | ESCC | 1.41e-10 | 3.30e-01 | 0.1426 |
| 10587 | TXNRD2 | P12T-E | Human | Esophagus | ESCC | 2.69e-21 | 4.28e-01 | 0.1122 |
| 10587 | TXNRD2 | P15T-E | Human | Esophagus | ESCC | 1.82e-08 | 2.52e-01 | 0.1149 |
| 10587 | TXNRD2 | P16T-E | Human | Esophagus | ESCC | 4.40e-28 | 4.27e-01 | 0.1153 |
| 10587 | TXNRD2 | P17T-E | Human | Esophagus | ESCC | 6.83e-10 | 4.10e-01 | 0.1278 |
| 10587 | TXNRD2 | P19T-E | Human | Esophagus | ESCC | 9.18e-07 | 3.43e-01 | 0.1662 |
| 10587 | TXNRD2 | P20T-E | Human | Esophagus | ESCC | 2.36e-06 | 2.00e-01 | 0.1124 |
| 10587 | TXNRD2 | P21T-E | Human | Esophagus | ESCC | 3.02e-50 | 9.69e-01 | 0.1617 |
| 10587 | TXNRD2 | P22T-E | Human | Esophagus | ESCC | 2.68e-11 | 2.16e-01 | 0.1236 |
| 10587 | TXNRD2 | P23T-E | Human | Esophagus | ESCC | 8.18e-15 | 3.80e-01 | 0.108 |
| Page: 1 2 3 4 5 |
| Tissue | Expression Dynamics | Abbreviation |
| Esophagus | 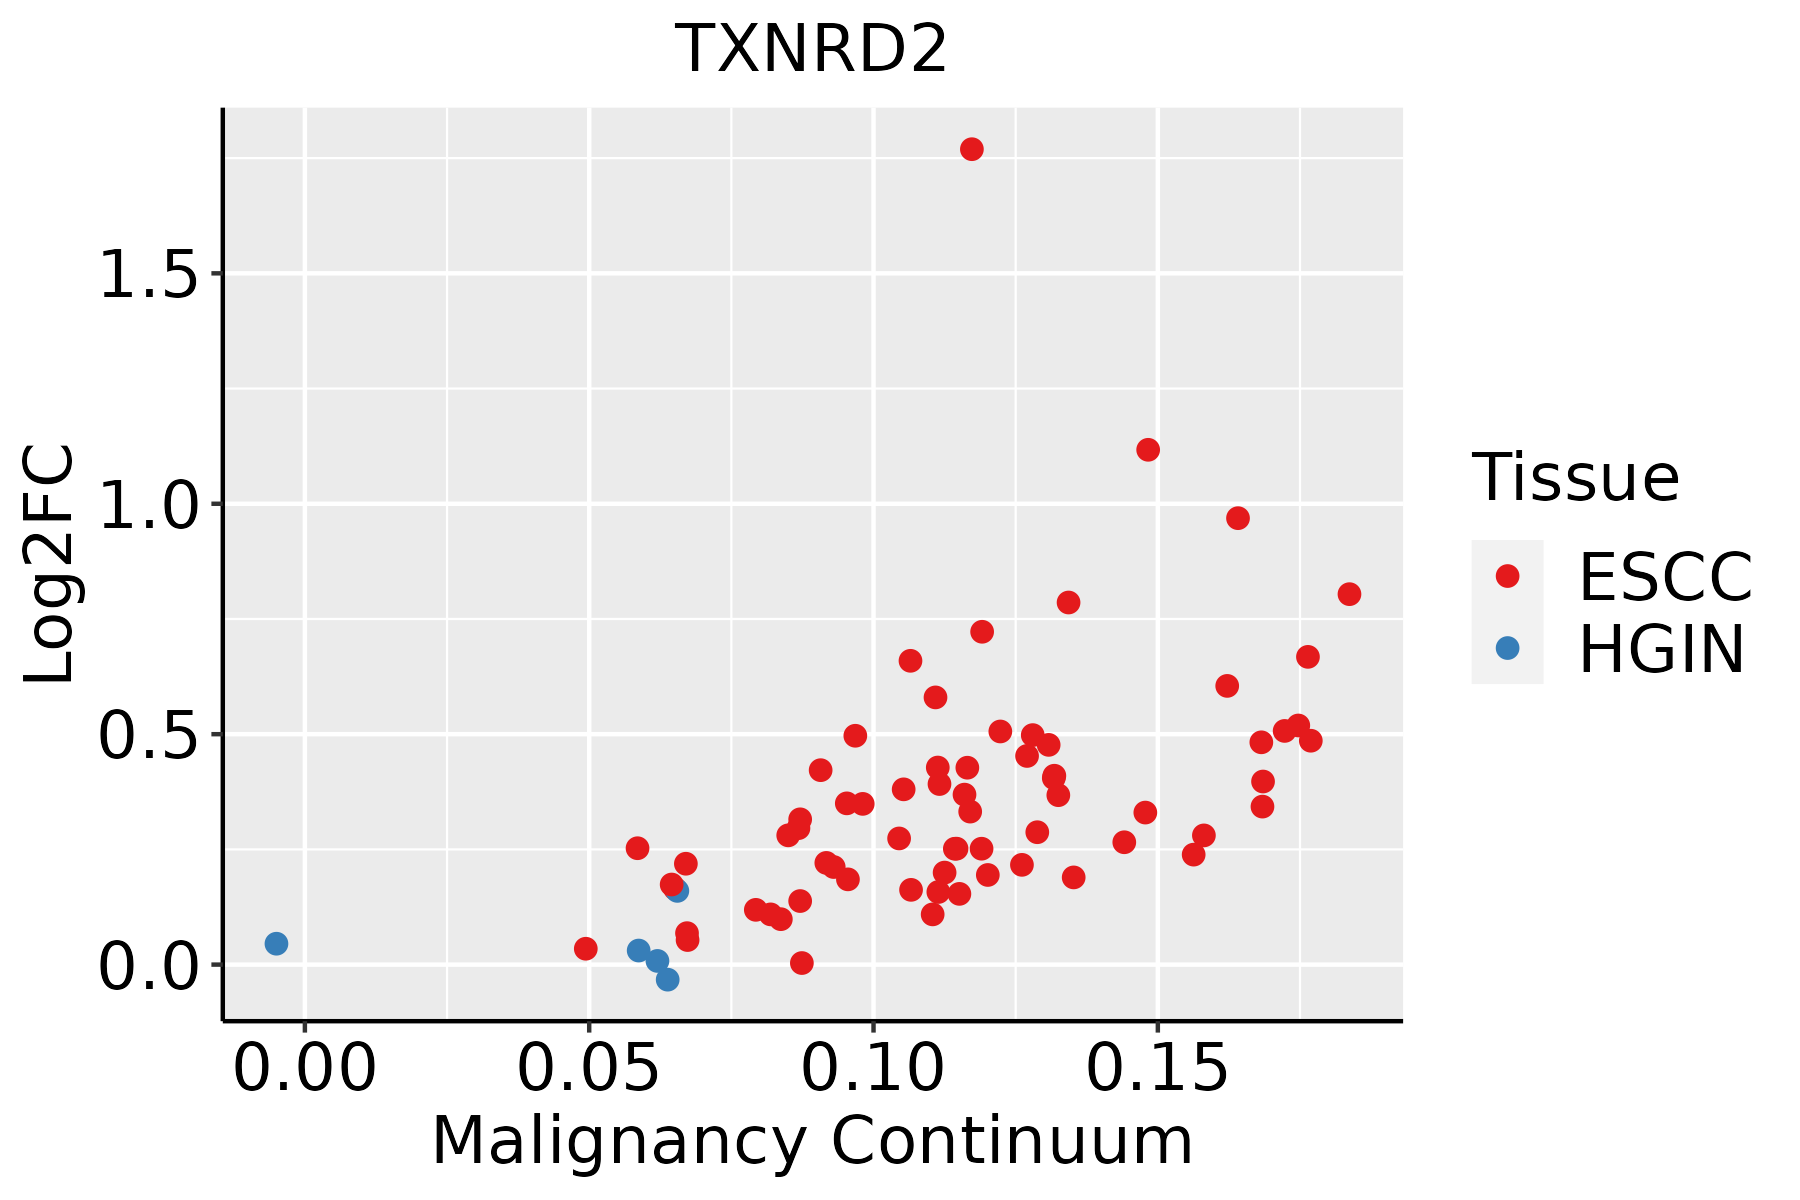 | ESCC: Esophageal squamous cell carcinoma |
| HGIN: High-grade intraepithelial neoplasias | ||
| LGIN: Low-grade intraepithelial neoplasias | ||
| Oral Cavity | 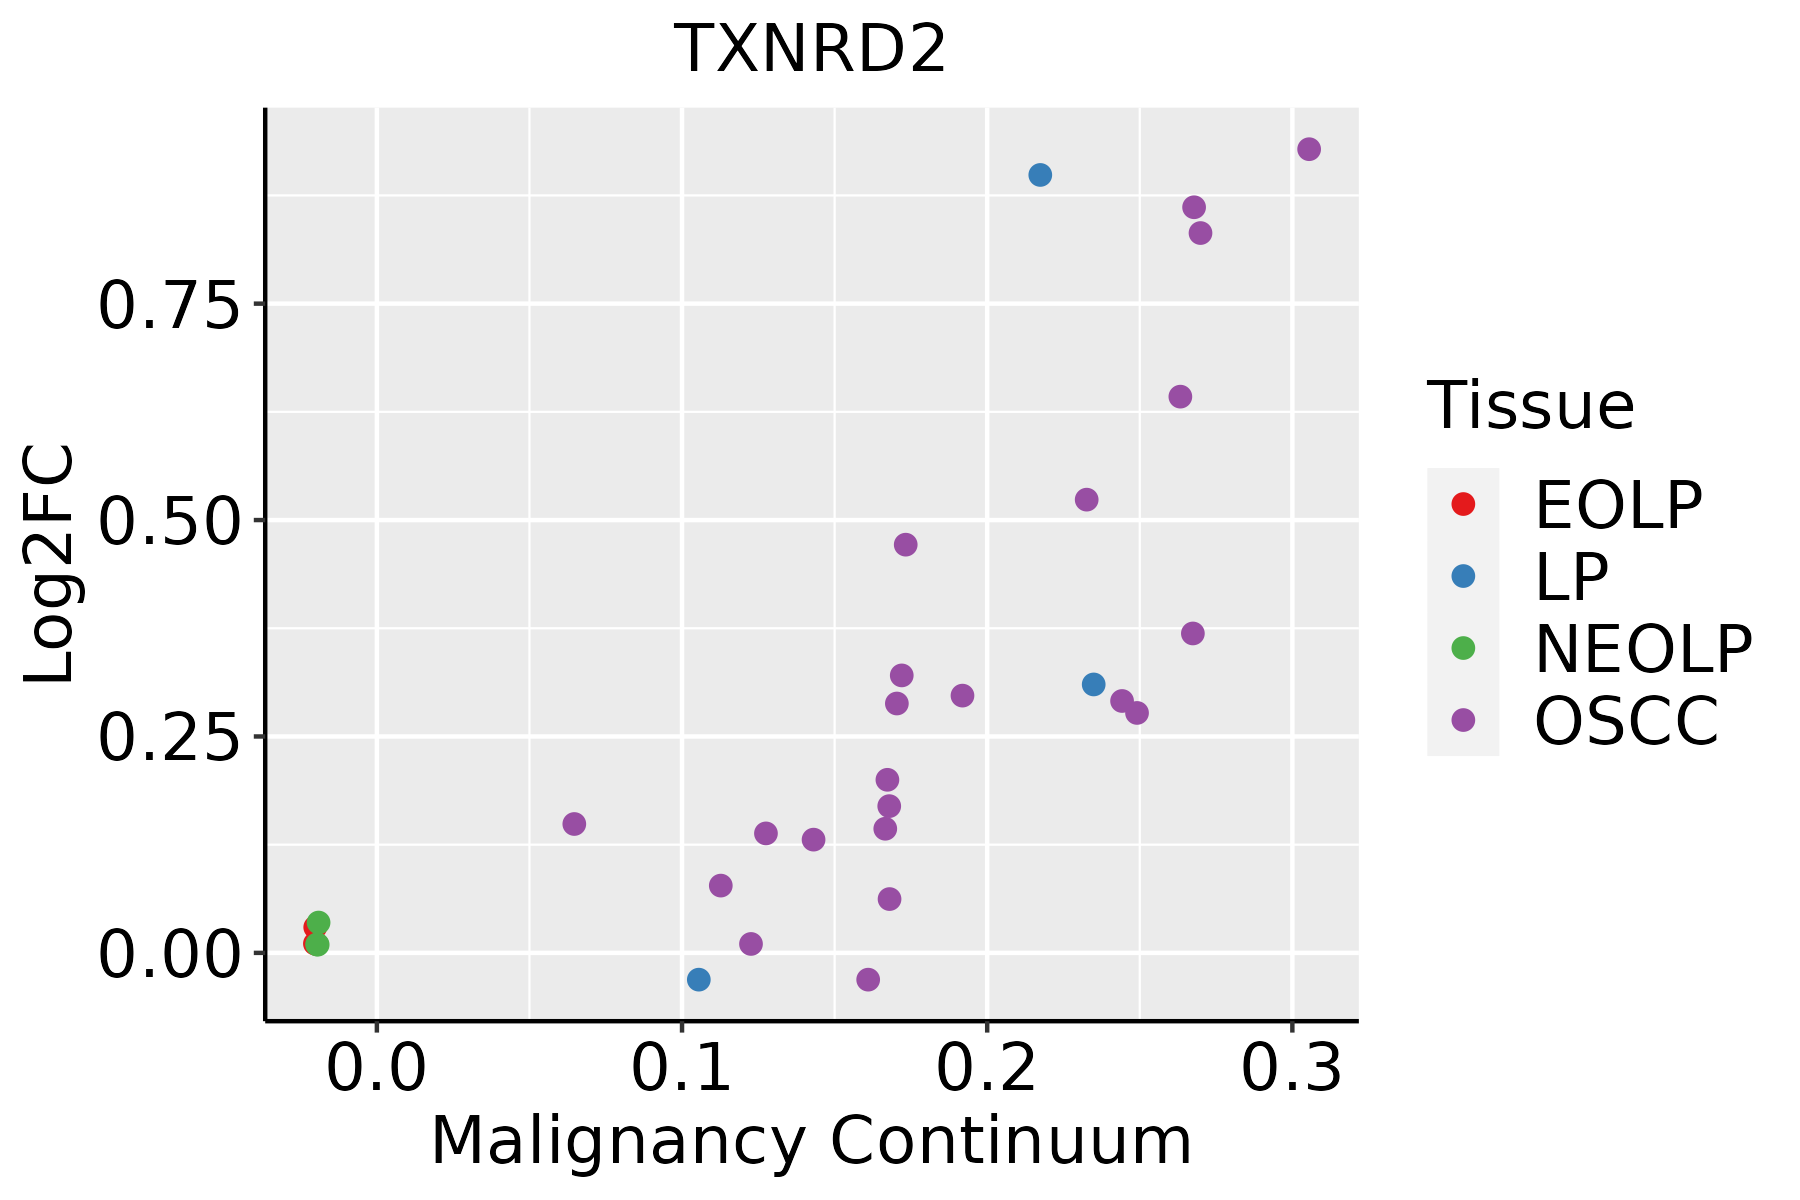 | EOLP: Erosive Oral lichen planus |
| LP: leukoplakia | ||
| NEOLP: Non-erosive oral lichen planus | ||
| OSCC: Oral squamous cell carcinoma | ||
| Thyroid | 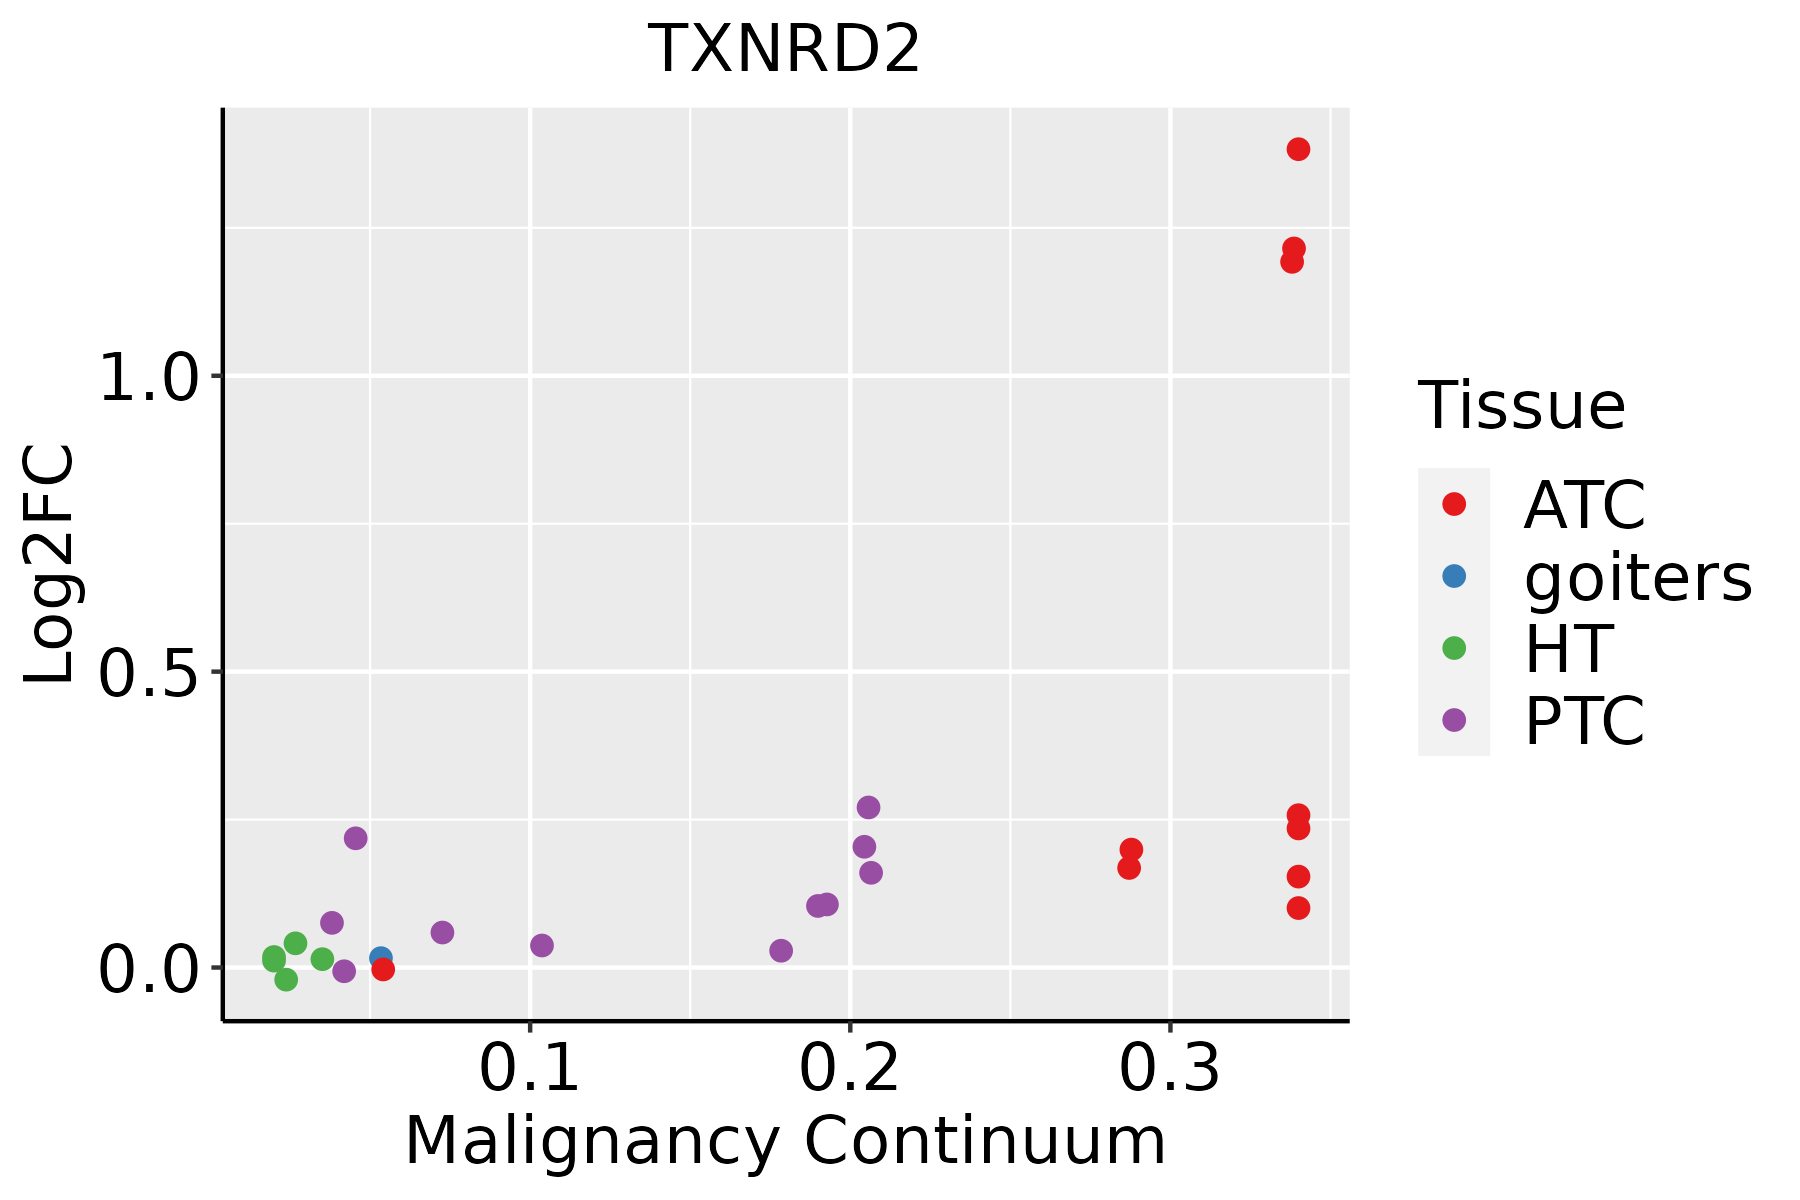 | ATC: Anaplastic thyroid cancer |
| HT: Hashimoto's thyroiditis | ||
| PTC: Papillary thyroid cancer |
| ∗log2FC in expression of this searched gene in stem-like cells from each diseased tissue sample relative to stem-like cells in normal samples in each tissue plotted against the malignancy continuum. Samples are colored based on if they are from different disease stage. |
Top |
Malignant transformation related pathway analysis |
| Find out the enriched GO biological processes and KEGG pathways involved in transition from healthy to precancer to cancer |
| Tissue | Disease Stage | Enriched GO biological Processes |
| Colorectum | AD |  |
| Colorectum | SER |  |
| Colorectum | MSS |  |
| Colorectum | MSI-H |  |
| Colorectum | FAP |  |
| ∗Top 15 enriched GO BP terms are showed in the bar plot of each disease state in each tissue. Each row represents a significant GO biological process which is colored according to the -log10(p.adjust). |
| Page: 1 2 3 4 5 6 7 8 9 |
| GO ID | Tissue | Disease Stage | Description | Gene Ratio | Bg Ratio | pvalue | p.adjust | Count |
| GO:0006979111 | Esophagus | ESCC | response to oxidative stress | 303/8552 | 446/18723 | 7.15e-22 | 1.30e-19 | 303 |
| GO:0000302111 | Esophagus | ESCC | response to reactive oxygen species | 150/8552 | 222/18723 | 3.06e-11 | 1.02e-09 | 150 |
| GO:004545419 | Esophagus | ESCC | cell redox homeostasis | 29/8552 | 35/18723 | 6.61e-06 | 6.75e-05 | 29 |
| GO:000963620 | Esophagus | ESCC | response to toxic substance | 150/8552 | 262/18723 | 1.00e-04 | 7.12e-04 | 150 |
| GO:1990748110 | Esophagus | ESCC | cellular detoxification | 70/8552 | 116/18723 | 1.02e-03 | 5.17e-03 | 70 |
| GO:0097237110 | Esophagus | ESCC | cellular response to toxic substance | 72/8552 | 124/18723 | 3.65e-03 | 1.49e-02 | 72 |
| GO:0098869110 | Esophagus | ESCC | cellular oxidant detoxification | 60/8552 | 101/18723 | 3.76e-03 | 1.53e-02 | 60 |
| GO:000697920 | Oral cavity | OSCC | response to oxidative stress | 273/7305 | 446/18723 | 8.35e-22 | 1.65e-19 | 273 |
| GO:000030220 | Oral cavity | OSCC | response to reactive oxygen species | 143/7305 | 222/18723 | 1.32e-14 | 7.88e-13 | 143 |
| GO:000963618 | Oral cavity | OSCC | response to toxic substance | 137/7305 | 262/18723 | 7.94e-06 | 8.52e-05 | 137 |
| GO:004545417 | Oral cavity | OSCC | cell redox homeostasis | 25/7305 | 35/18723 | 1.02e-04 | 7.63e-04 | 25 |
| GO:199074818 | Oral cavity | OSCC | cellular detoxification | 63/7305 | 116/18723 | 5.80e-04 | 3.31e-03 | 63 |
| GO:009886918 | Oral cavity | OSCC | cellular oxidant detoxification | 55/7305 | 101/18723 | 1.16e-03 | 5.89e-03 | 55 |
| GO:009723718 | Oral cavity | OSCC | cellular response to toxic substance | 65/7305 | 124/18723 | 1.63e-03 | 7.74e-03 | 65 |
| GO:009875418 | Oral cavity | OSCC | detoxification | 75/7305 | 152/18723 | 5.99e-03 | 2.28e-02 | 75 |
| GO:0006979110 | Oral cavity | LP | response to oxidative stress | 181/4623 | 446/18723 | 5.74e-14 | 6.10e-12 | 181 |
| GO:0000302110 | Oral cavity | LP | response to reactive oxygen species | 95/4623 | 222/18723 | 2.23e-09 | 9.98e-08 | 95 |
| GO:004545418 | Oral cavity | LP | cell redox homeostasis | 18/4623 | 35/18723 | 5.86e-04 | 5.39e-03 | 18 |
| GO:000963619 | Oral cavity | LP | response to toxic substance | 86/4623 | 262/18723 | 1.74e-03 | 1.32e-02 | 86 |
| GO:199074819 | Oral cavity | LP | cellular detoxification | 43/4623 | 116/18723 | 1.99e-03 | 1.47e-02 | 43 |
| Page: 1 2 |
| Pathway ID | Tissue | Disease Stage | Description | Gene Ratio | Bg Ratio | pvalue | p.adjust | qvalue | Count |
| hsa0522518 | Esophagus | ESCC | Hepatocellular carcinoma | 109/4205 | 168/8465 | 4.27e-05 | 1.88e-04 | 9.64e-05 | 109 |
| hsa0522519 | Esophagus | ESCC | Hepatocellular carcinoma | 109/4205 | 168/8465 | 4.27e-05 | 1.88e-04 | 9.64e-05 | 109 |
| hsa0522516 | Oral cavity | OSCC | Hepatocellular carcinoma | 97/3704 | 168/8465 | 1.63e-04 | 5.52e-04 | 2.81e-04 | 97 |
| hsa0522517 | Oral cavity | OSCC | Hepatocellular carcinoma | 97/3704 | 168/8465 | 1.63e-04 | 5.52e-04 | 2.81e-04 | 97 |
| Page: 1 |
Top |
Cell-cell communication analysis |
| Identification of potential cell-cell interactions between two cell types and their ligand-receptor pairs for different disease states |
| Ligand | Receptor | LRpair | Pathway | Tissue | Disease Stage |
| Page: 1 |
Top |
Single-cell gene regulatory network inference analysis |
| Find out the significant the regulons (TFs) and the target genes of each regulon across cell types for different disease states |
| TF | Cell Type | Tissue | Disease Stage | Target Gene | RSS | Regulon Activity |
| ∗The dot plots of a searched regulon are shown for all cell subpopulations in each disease state of each tissue based on the regulon specific score inferred using pySCENIC and by calculating the average expression. |
| Page: 1 |
Top |
Somatic mutation of malignant transformation related genes |
| Annotation of somatic variants for genes involved in malignant transformation |
| Hugo Symbol | Variant Class | Variant Classification | dbSNP RS | HGVSc | HGVSp | HGVSp Short | SWISSPROT | BIOTYPE | SIFT | PolyPhen | Tumor Sample Barcode | Tissue | Histology | Sex | Age | Stage | Therapy Types | Drugs | Outcome |
| TXNRD2 | SNV | Missense_Mutation | novel | c.1064N>T | p.Tyr355Phe | p.Y355F | Q9NNW7 | protein_coding | tolerated(0.18) | benign(0.088) | TCGA-AN-A0FF-01 | Breast | breast invasive carcinoma | Female | <65 | I/II | Unknown | Unknown | SD |
| TXNRD2 | SNV | Missense_Mutation | rs759374389 | c.1322G>A | p.Arg441Gln | p.R441Q | Q9NNW7 | protein_coding | deleterious(0.02) | benign(0.213) | TCGA-C8-A274-01 | Breast | breast invasive carcinoma | Female | <65 | I/II | Hormone Therapy | tamoxiphen | SD |
| TXNRD2 | insertion | Nonsense_Mutation | novel | c.828_829insTGGATCATGCTGCTGTGAAC | p.Arg277TrpfsTer6 | p.R277Wfs*6 | Q9NNW7 | protein_coding | TCGA-AO-A03O-01 | Breast | breast invasive carcinoma | Female | >=65 | I/II | Chemotherapy | doxorubicin | SD | ||
| TXNRD2 | deletion | Frame_Shift_Del | novel | c.790delG | p.Val264SerfsTer2 | p.V264Sfs*2 | Q9NNW7 | protein_coding | TCGA-D8-A27V-01 | Breast | breast invasive carcinoma | Female | <65 | I/II | Hormone Therapy | tamoxiphen | SD | ||
| TXNRD2 | deletion | Frame_Shift_Del | novel | c.392delC | p.Ala131ValfsTer6 | p.A131Vfs*6 | Q9NNW7 | protein_coding | TCGA-D8-A27V-01 | Breast | breast invasive carcinoma | Female | <65 | I/II | Hormone Therapy | tamoxiphen | SD | ||
| TXNRD2 | SNV | Missense_Mutation | novel | c.622N>G | p.Ser208Gly | p.S208G | Q9NNW7 | protein_coding | deleterious(0) | probably_damaging(1) | TCGA-2W-A8YY-01 | Cervix | cervical & endocervical cancer | Female | <65 | I/II | Chemotherapy | cisplatin | CR |
| TXNRD2 | SNV | Missense_Mutation | novel | c.308T>C | p.Leu103Pro | p.L103P | Q9NNW7 | protein_coding | deleterious(0) | probably_damaging(0.995) | TCGA-AA-3496-01 | Colorectum | colon adenocarcinoma | Female | >=65 | I/II | Unknown | Unknown | SD |
| TXNRD2 | SNV | Missense_Mutation | c.1310N>T | p.Thr437Met | p.T437M | Q9NNW7 | protein_coding | deleterious(0.02) | possibly_damaging(0.776) | TCGA-AA-3815-01 | Colorectum | colon adenocarcinoma | Female | >=65 | I/II | Unknown | Unknown | SD | |
| TXNRD2 | SNV | Missense_Mutation | novel | c.584N>A | p.Pro195His | p.P195H | Q9NNW7 | protein_coding | deleterious(0) | probably_damaging(1) | TCGA-AA-3949-01 | Colorectum | colon adenocarcinoma | Female | >=65 | III/IV | Unknown | Unknown | SD |
| TXNRD2 | SNV | Missense_Mutation | rs766076027 | c.1414G>A | p.Glu472Lys | p.E472K | Q9NNW7 | protein_coding | deleterious(0) | probably_damaging(0.999) | TCGA-AA-3984-01 | Colorectum | colon adenocarcinoma | Female | <65 | I/II | Unknown | Unknown | SD |
| Page: 1 2 3 4 5 |
Top |
Related drugs of malignant transformation related genes |
| Identification of chemicals and drugs interact with genes involved in malignant transfromation |
| (DGIdb 4.0) |
| Entrez ID | Symbol | Category | Interaction Types | Drug Claim Name | Drug Name | PMIDs |
| 10587 | TXNRD2 | DRUGGABLE GENOME | MOTEXAFIN GADOLINIUM | |||
| 10587 | TXNRD2 | DRUGGABLE GENOME | methadone | METHADONE | 32407152 | |
| 10587 | TXNRD2 | DRUGGABLE GENOME | Selective serotonin reuptake inhibitors | |||
| 10587 | TXNRD2 | DRUGGABLE GENOME | ARSENIC TRIOXIDE | ARSENIC TRIOXIDE | 17640917 |
| Page: 1 |

Copyright 2023-Present -The University of Texas Health Science Center at Houston |