
|
|||||
|
 | |
| |
| |
| |
| |
| |
|
Gene: TXNL4B |
Gene summary for TXNL4B |
| Gene information | Species | Human | Gene symbol | TXNL4B | Gene ID | 54957 |
| Gene name | thioredoxin like 4B | |
| Gene Alias | DLP | |
| Cytomap | 16q22.2 | |
| Gene Type | protein-coding | GO ID | GO:0000375 | UniProtAcc | Q9NX01 |
Top |
Malignant transformation analysis |
| Identification of the aberrant gene expression in precancerous and cancerous lesions by comparing the gene expression of stem-like cells in diseased tissues with normal stem cells |
| Entrez ID | Symbol | Replicates | Species | Organ | Tissue | Adj P-value | Log2FC | Malignancy |
| 54957 | TXNL4B | LZE4T | Human | Esophagus | ESCC | 1.39e-06 | 2.53e-01 | 0.0811 |
| 54957 | TXNL4B | LZE7T | Human | Esophagus | ESCC | 2.59e-04 | 2.79e-01 | 0.0667 |
| 54957 | TXNL4B | LZE24T | Human | Esophagus | ESCC | 5.96e-10 | 2.23e-01 | 0.0596 |
| 54957 | TXNL4B | P1T-E | Human | Esophagus | ESCC | 5.12e-04 | 1.48e-01 | 0.0875 |
| 54957 | TXNL4B | P2T-E | Human | Esophagus | ESCC | 8.24e-07 | 7.34e-02 | 0.1177 |
| 54957 | TXNL4B | P4T-E | Human | Esophagus | ESCC | 1.01e-05 | 1.61e-01 | 0.1323 |
| 54957 | TXNL4B | P5T-E | Human | Esophagus | ESCC | 1.31e-11 | 2.00e-01 | 0.1327 |
| 54957 | TXNL4B | P8T-E | Human | Esophagus | ESCC | 9.46e-13 | 2.06e-01 | 0.0889 |
| 54957 | TXNL4B | P9T-E | Human | Esophagus | ESCC | 9.13e-05 | 7.33e-02 | 0.1131 |
| 54957 | TXNL4B | P10T-E | Human | Esophagus | ESCC | 9.44e-14 | 1.01e-01 | 0.116 |
| 54957 | TXNL4B | P12T-E | Human | Esophagus | ESCC | 3.37e-10 | 1.16e-01 | 0.1122 |
| 54957 | TXNL4B | P15T-E | Human | Esophagus | ESCC | 1.88e-05 | 1.31e-01 | 0.1149 |
| 54957 | TXNL4B | P16T-E | Human | Esophagus | ESCC | 6.96e-08 | 1.13e-01 | 0.1153 |
| 54957 | TXNL4B | P20T-E | Human | Esophagus | ESCC | 1.33e-07 | 2.01e-01 | 0.1124 |
| 54957 | TXNL4B | P21T-E | Human | Esophagus | ESCC | 2.11e-16 | 1.68e-01 | 0.1617 |
| 54957 | TXNL4B | P22T-E | Human | Esophagus | ESCC | 4.31e-12 | 2.21e-01 | 0.1236 |
| 54957 | TXNL4B | P23T-E | Human | Esophagus | ESCC | 2.20e-12 | 2.94e-01 | 0.108 |
| 54957 | TXNL4B | P24T-E | Human | Esophagus | ESCC | 1.58e-05 | 8.08e-02 | 0.1287 |
| 54957 | TXNL4B | P26T-E | Human | Esophagus | ESCC | 4.98e-15 | 3.00e-01 | 0.1276 |
| 54957 | TXNL4B | P27T-E | Human | Esophagus | ESCC | 2.61e-04 | 1.14e-01 | 0.1055 |
| Page: 1 2 3 4 |
| Tissue | Expression Dynamics | Abbreviation |
| Esophagus |  | ESCC: Esophageal squamous cell carcinoma |
| HGIN: High-grade intraepithelial neoplasias | ||
| LGIN: Low-grade intraepithelial neoplasias | ||
| Liver |  | HCC: Hepatocellular carcinoma |
| NAFLD: Non-alcoholic fatty liver disease | ||
| Oral Cavity | 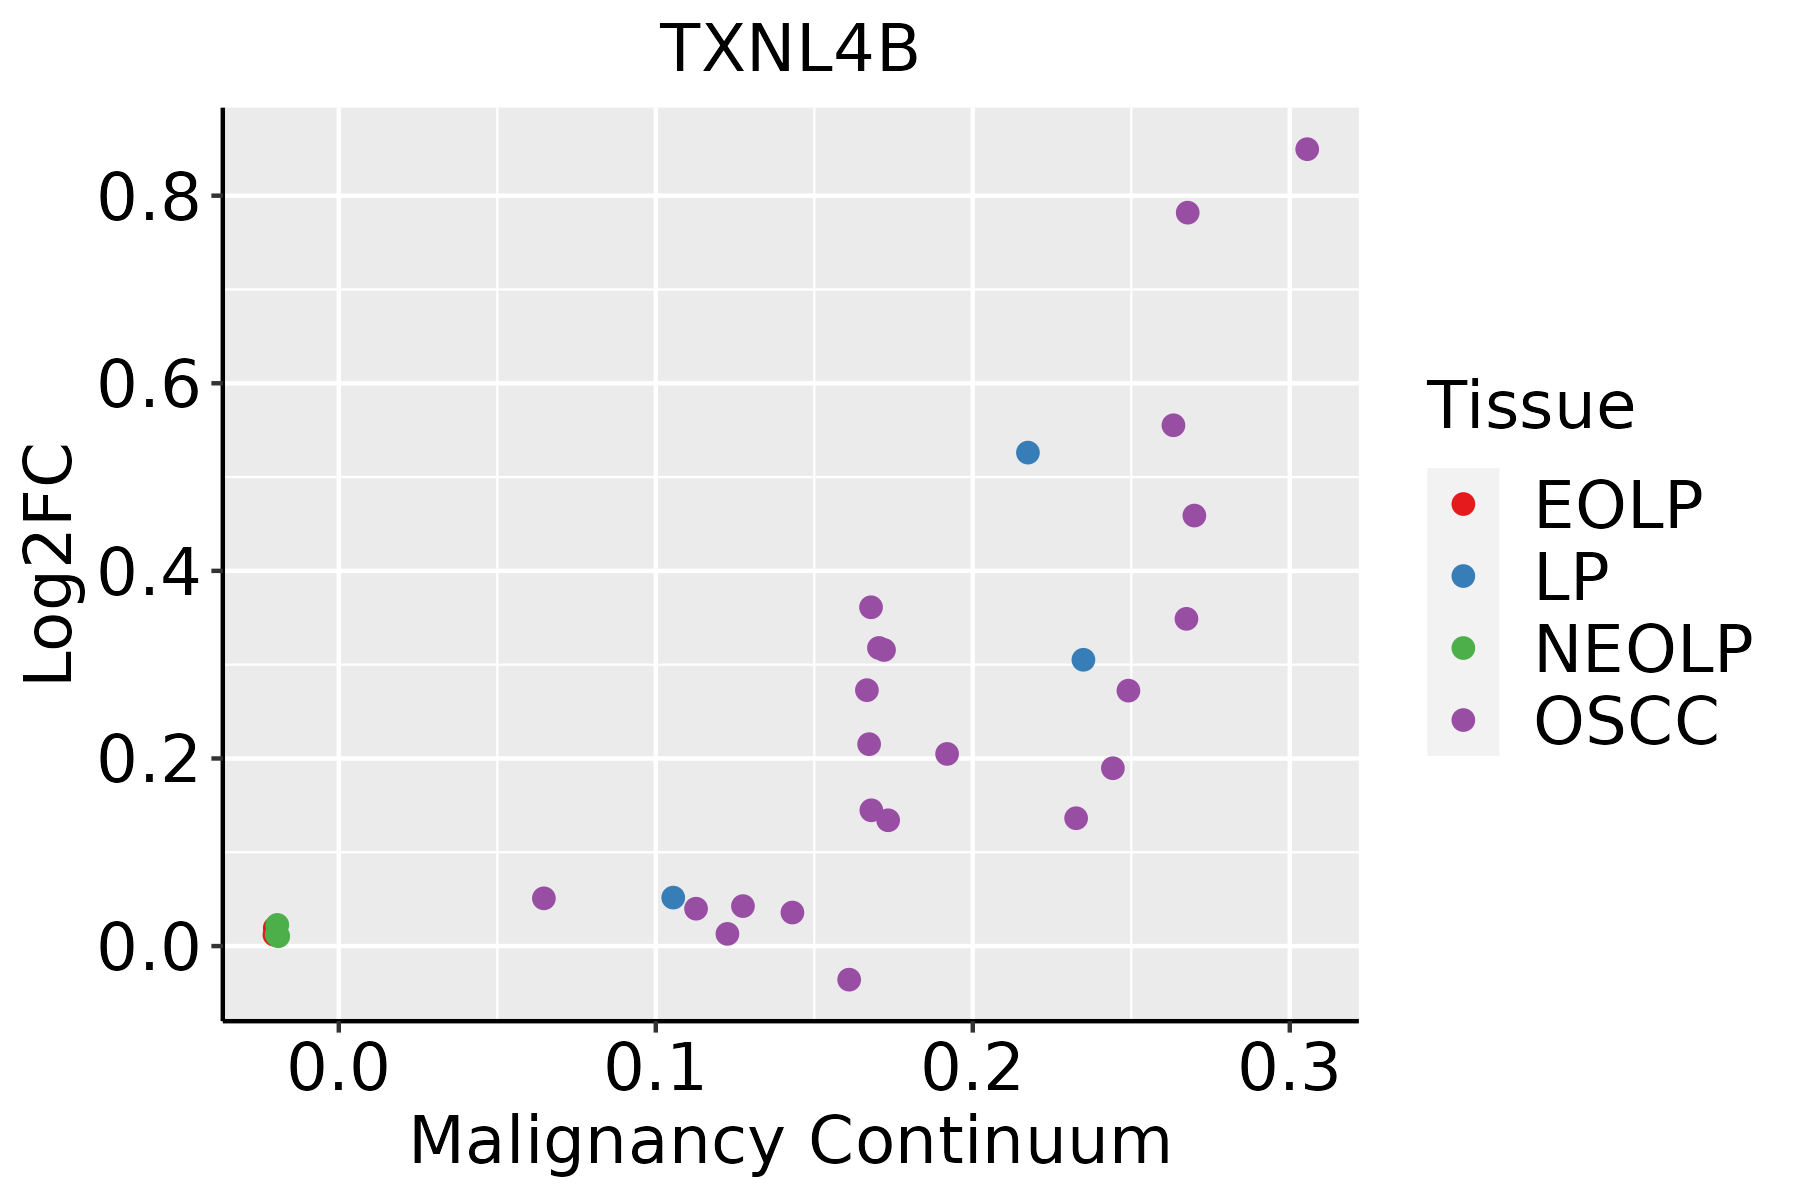 | EOLP: Erosive Oral lichen planus |
| LP: leukoplakia | ||
| NEOLP: Non-erosive oral lichen planus | ||
| OSCC: Oral squamous cell carcinoma |
| ∗log2FC in expression of this searched gene in stem-like cells from each diseased tissue sample relative to stem-like cells in normal samples in each tissue plotted against the malignancy continuum. Samples are colored based on if they are from different disease stage. |
Top |
Malignant transformation related pathway analysis |
| Find out the enriched GO biological processes and KEGG pathways involved in transition from healthy to precancer to cancer |
| Tissue | Disease Stage | Enriched GO biological Processes |
| Colorectum | AD |  |
| Colorectum | SER |  |
| Colorectum | MSS |  |
| Colorectum | MSI-H |  |
| Colorectum | FAP |  |
| ∗Top 15 enriched GO BP terms are showed in the bar plot of each disease state in each tissue. Each row represents a significant GO biological process which is colored according to the -log10(p.adjust). |
| Page: 1 2 3 4 5 6 7 8 9 |
| GO ID | Tissue | Disease Stage | Description | Gene Ratio | Bg Ratio | pvalue | p.adjust | Count |
| GO:0008380111 | Esophagus | ESCC | RNA splicing | 336/8552 | 434/18723 | 1.74e-42 | 3.67e-39 | 336 |
| GO:0000375111 | Esophagus | ESCC | RNA splicing, via transesterification reactions | 248/8552 | 324/18723 | 3.05e-30 | 1.49e-27 | 248 |
| GO:0000377111 | Esophagus | ESCC | RNA splicing, via transesterification reactions with bulged adenosine as nucleophile | 244/8552 | 320/18723 | 2.52e-29 | 1.07e-26 | 244 |
| GO:0000398111 | Esophagus | ESCC | mRNA splicing, via spliceosome | 244/8552 | 320/18723 | 2.52e-29 | 1.07e-26 | 244 |
| GO:000838022 | Liver | HCC | RNA splicing | 313/7958 | 434/18723 | 1.36e-36 | 1.73e-33 | 313 |
| GO:000037522 | Liver | HCC | RNA splicing, via transesterification reactions | 228/7958 | 324/18723 | 1.47e-24 | 4.06e-22 | 228 |
| GO:000037722 | Liver | HCC | RNA splicing, via transesterification reactions with bulged adenosine as nucleophile | 224/7958 | 320/18723 | 1.16e-23 | 2.62e-21 | 224 |
| GO:000039822 | Liver | HCC | mRNA splicing, via spliceosome | 224/7958 | 320/18723 | 1.16e-23 | 2.62e-21 | 224 |
| GO:000838020 | Oral cavity | OSCC | RNA splicing | 308/7305 | 434/18723 | 2.43e-42 | 7.70e-39 | 308 |
| GO:000037519 | Oral cavity | OSCC | RNA splicing, via transesterification reactions | 225/7305 | 324/18723 | 5.20e-29 | 2.99e-26 | 225 |
| GO:000037719 | Oral cavity | OSCC | RNA splicing, via transesterification reactions with bulged adenosine as nucleophile | 221/7305 | 320/18723 | 5.50e-28 | 2.18e-25 | 221 |
| GO:000039819 | Oral cavity | OSCC | mRNA splicing, via spliceosome | 221/7305 | 320/18723 | 5.50e-28 | 2.18e-25 | 221 |
| Page: 1 |
| Pathway ID | Tissue | Disease Stage | Description | Gene Ratio | Bg Ratio | pvalue | p.adjust | qvalue | Count |
| Page: 1 |
Top |
Cell-cell communication analysis |
| Identification of potential cell-cell interactions between two cell types and their ligand-receptor pairs for different disease states |
| Ligand | Receptor | LRpair | Pathway | Tissue | Disease Stage |
| Page: 1 |
Top |
Single-cell gene regulatory network inference analysis |
| Find out the significant the regulons (TFs) and the target genes of each regulon across cell types for different disease states |
| TF | Cell Type | Tissue | Disease Stage | Target Gene | RSS | Regulon Activity |
| ∗The dot plots of a searched regulon are shown for all cell subpopulations in each disease state of each tissue based on the regulon specific score inferred using pySCENIC and by calculating the average expression. |
| Page: 1 |
Top |
Somatic mutation of malignant transformation related genes |
| Annotation of somatic variants for genes involved in malignant transformation |
| Hugo Symbol | Variant Class | Variant Classification | dbSNP RS | HGVSc | HGVSp | HGVSp Short | SWISSPROT | BIOTYPE | SIFT | PolyPhen | Tumor Sample Barcode | Tissue | Histology | Sex | Age | Stage | Therapy Types | Drugs | Outcome |
| TXNL4B | SNV | Missense_Mutation | c.200N>A | p.Ala67Glu | p.A67E | Q9NX01 | protein_coding | tolerated(0.06) | benign(0.001) | TCGA-A2-A0CR-01 | Breast | breast invasive carcinoma | Female | <65 | I/II | Chemotherapy | adriamycin | CR | |
| TXNL4B | insertion | Nonsense_Mutation | novel | c.337_338insGATTTATTAGAAGGAGAGGGTAGGTGC | p.Ile113delinsArgPheIleArgArgArgGlyTerValLeu | p.I113delinsRFIRRRG*VL | Q9NX01 | protein_coding | TCGA-A8-A07P-01 | Breast | breast invasive carcinoma | Female | >=65 | I/II | Chemotherapy | 5-fluorouracil | SD | ||
| TXNL4B | insertion | Nonsense_Mutation | novel | c.136_137insGGAGAGAGACCTAACCCAGAA | p.Ser46delinsTrpArgGluThrTerProArgThr | p.S46delinsWRET*PRT | Q9NX01 | protein_coding | TCGA-AO-A0J9-01 | Breast | breast invasive carcinoma | Female | <65 | III/IV | Chemotherapy | cyclophosphamide | PD | ||
| TXNL4B | insertion | Frame_Shift_Ins | novel | c.136_137insGTGGAGAGAGACCTAACCCAGAA | p.Ser46CysfsTer15 | p.S46Cfs*15 | Q9NX01 | protein_coding | TCGA-BH-A0BJ-01 | Breast | breast invasive carcinoma | Female | <65 | I/II | Chemotherapy | doxorubicin | SD | ||
| TXNL4B | insertion | Nonsense_Mutation | novel | c.136_137insGGAGAGAGACCTAACCCAGAA | p.Ser46delinsTrpArgGluThrTerProArgThr | p.S46delinsWRET*PRT | Q9NX01 | protein_coding | TCGA-BH-A0EB-01 | Breast | breast invasive carcinoma | Female | >=65 | I/II | Hormone Therapy | arimidex | SD | ||
| TXNL4B | SNV | Missense_Mutation | c.202N>C | p.Val68Leu | p.V68L | Q9NX01 | protein_coding | tolerated(0.27) | benign(0.003) | TCGA-FU-A23L-01 | Cervix | cervical & endocervical cancer | Female | <65 | I/II | Chemotherapy | cisplatin | CR | |
| TXNL4B | SNV | Missense_Mutation | c.200C>T | p.Ala67Val | p.A67V | Q9NX01 | protein_coding | deleterious(0.02) | benign(0.012) | TCGA-D5-5539-01 | Colorectum | colon adenocarcinoma | Male | <65 | III/IV | Chemotherapy | 5-fu | PD | |
| TXNL4B | SNV | Missense_Mutation | c.252N>A | p.Phe84Leu | p.F84L | Q9NX01 | protein_coding | deleterious(0.01) | probably_damaging(0.997) | TCGA-AX-A05Z-01 | Endometrium | uterine corpus endometrioid carcinoma | Female | <65 | III/IV | Chemotherapy | adriamycin | SD | |
| TXNL4B | SNV | Missense_Mutation | c.263N>G | p.Gln88Arg | p.Q88R | Q9NX01 | protein_coding | tolerated(0.09) | benign(0.023) | TCGA-D1-A160-01 | Endometrium | uterine corpus endometrioid carcinoma | Female | >=65 | I/II | Unknown | Unknown | SD | |
| TXNL4B | SNV | Missense_Mutation | novel | c.371T>C | p.Met124Thr | p.M124T | Q9NX01 | protein_coding | tolerated(0.13) | benign(0.18) | TCGA-DI-A1BU-01 | Endometrium | uterine corpus endometrioid carcinoma | Female | <65 | I/II | Chemotherapy | paclitaxel | SD |
| Page: 1 2 |
Top |
Related drugs of malignant transformation related genes |
| Identification of chemicals and drugs interact with genes involved in malignant transfromation |
| (DGIdb 4.0) |
| Entrez ID | Symbol | Category | Interaction Types | Drug Claim Name | Drug Name | PMIDs |
| Page: 1 |

Copyright 2023-Present -The University of Texas Health Science Center at Houston |