
|
|||||
|
 | |
| |
| |
| |
| |
| |
|
Gene: TXNIP |
Gene summary for TXNIP |
| Gene information | Species | Human | Gene symbol | TXNIP | Gene ID | 10628 |
| Gene name | thioredoxin interacting protein | |
| Gene Alias | ARRDC6 | |
| Cytomap | 1q21.1 | |
| Gene Type | protein-coding | GO ID | GO:0000122 | UniProtAcc | Q9H3M7 |
Top |
Malignant transformation analysis |
| Identification of the aberrant gene expression in precancerous and cancerous lesions by comparing the gene expression of stem-like cells in diseased tissues with normal stem cells |
| Entrez ID | Symbol | Replicates | Species | Organ | Tissue | Adj P-value | Log2FC | Malignancy |
| 10628 | TXNIP | GSM4909285 | Human | Breast | IDC | 3.46e-09 | 3.59e-01 | 0.21 |
| 10628 | TXNIP | GSM4909286 | Human | Breast | IDC | 7.78e-06 | -1.45e-01 | 0.1081 |
| 10628 | TXNIP | GSM4909290 | Human | Breast | IDC | 6.47e-07 | -4.54e-01 | 0.2096 |
| 10628 | TXNIP | GSM4909294 | Human | Breast | IDC | 1.29e-02 | 2.07e-01 | 0.2022 |
| 10628 | TXNIP | GSM4909296 | Human | Breast | IDC | 8.46e-10 | -3.99e-01 | 0.1524 |
| 10628 | TXNIP | GSM4909297 | Human | Breast | IDC | 7.38e-06 | -4.16e-02 | 0.1517 |
| 10628 | TXNIP | GSM4909298 | Human | Breast | IDC | 3.62e-61 | 9.82e-01 | 0.1551 |
| 10628 | TXNIP | GSM4909303 | Human | Breast | IDC | 1.80e-11 | 7.60e-01 | 0.0438 |
| 10628 | TXNIP | GSM4909304 | Human | Breast | IDC | 4.28e-12 | -4.67e-01 | 0.1636 |
| 10628 | TXNIP | GSM4909305 | Human | Breast | IDC | 6.61e-04 | 3.68e-01 | 0.0436 |
| 10628 | TXNIP | GSM4909308 | Human | Breast | IDC | 5.37e-04 | -3.75e-01 | 0.158 |
| 10628 | TXNIP | GSM4909311 | Human | Breast | IDC | 7.30e-19 | -3.61e-01 | 0.1534 |
| 10628 | TXNIP | GSM4909317 | Human | Breast | IDC | 5.79e-31 | 8.18e-01 | 0.1355 |
| 10628 | TXNIP | GSM4909318 | Human | Breast | IDC | 1.08e-02 | 4.91e-01 | 0.2031 |
| 10628 | TXNIP | GSM4909319 | Human | Breast | IDC | 1.16e-23 | -5.25e-01 | 0.1563 |
| 10628 | TXNIP | GSM4909321 | Human | Breast | IDC | 5.34e-23 | -5.24e-01 | 0.1559 |
| 10628 | TXNIP | brca10 | Human | Breast | Precancer | 3.00e-05 | -4.04e-01 | -0.0029 |
| 10628 | TXNIP | M1 | Human | Breast | IDC | 8.97e-13 | 5.66e-01 | 0.1577 |
| 10628 | TXNIP | NCCBC11 | Human | Breast | DCIS | 5.79e-07 | 6.32e-01 | 0.1232 |
| 10628 | TXNIP | NCCBC14 | Human | Breast | DCIS | 3.13e-06 | -1.18e-01 | 0.2021 |
| Page: 1 2 3 4 5 6 7 8 9 10 11 12 |
| Tissue | Expression Dynamics | Abbreviation |
| Breast | 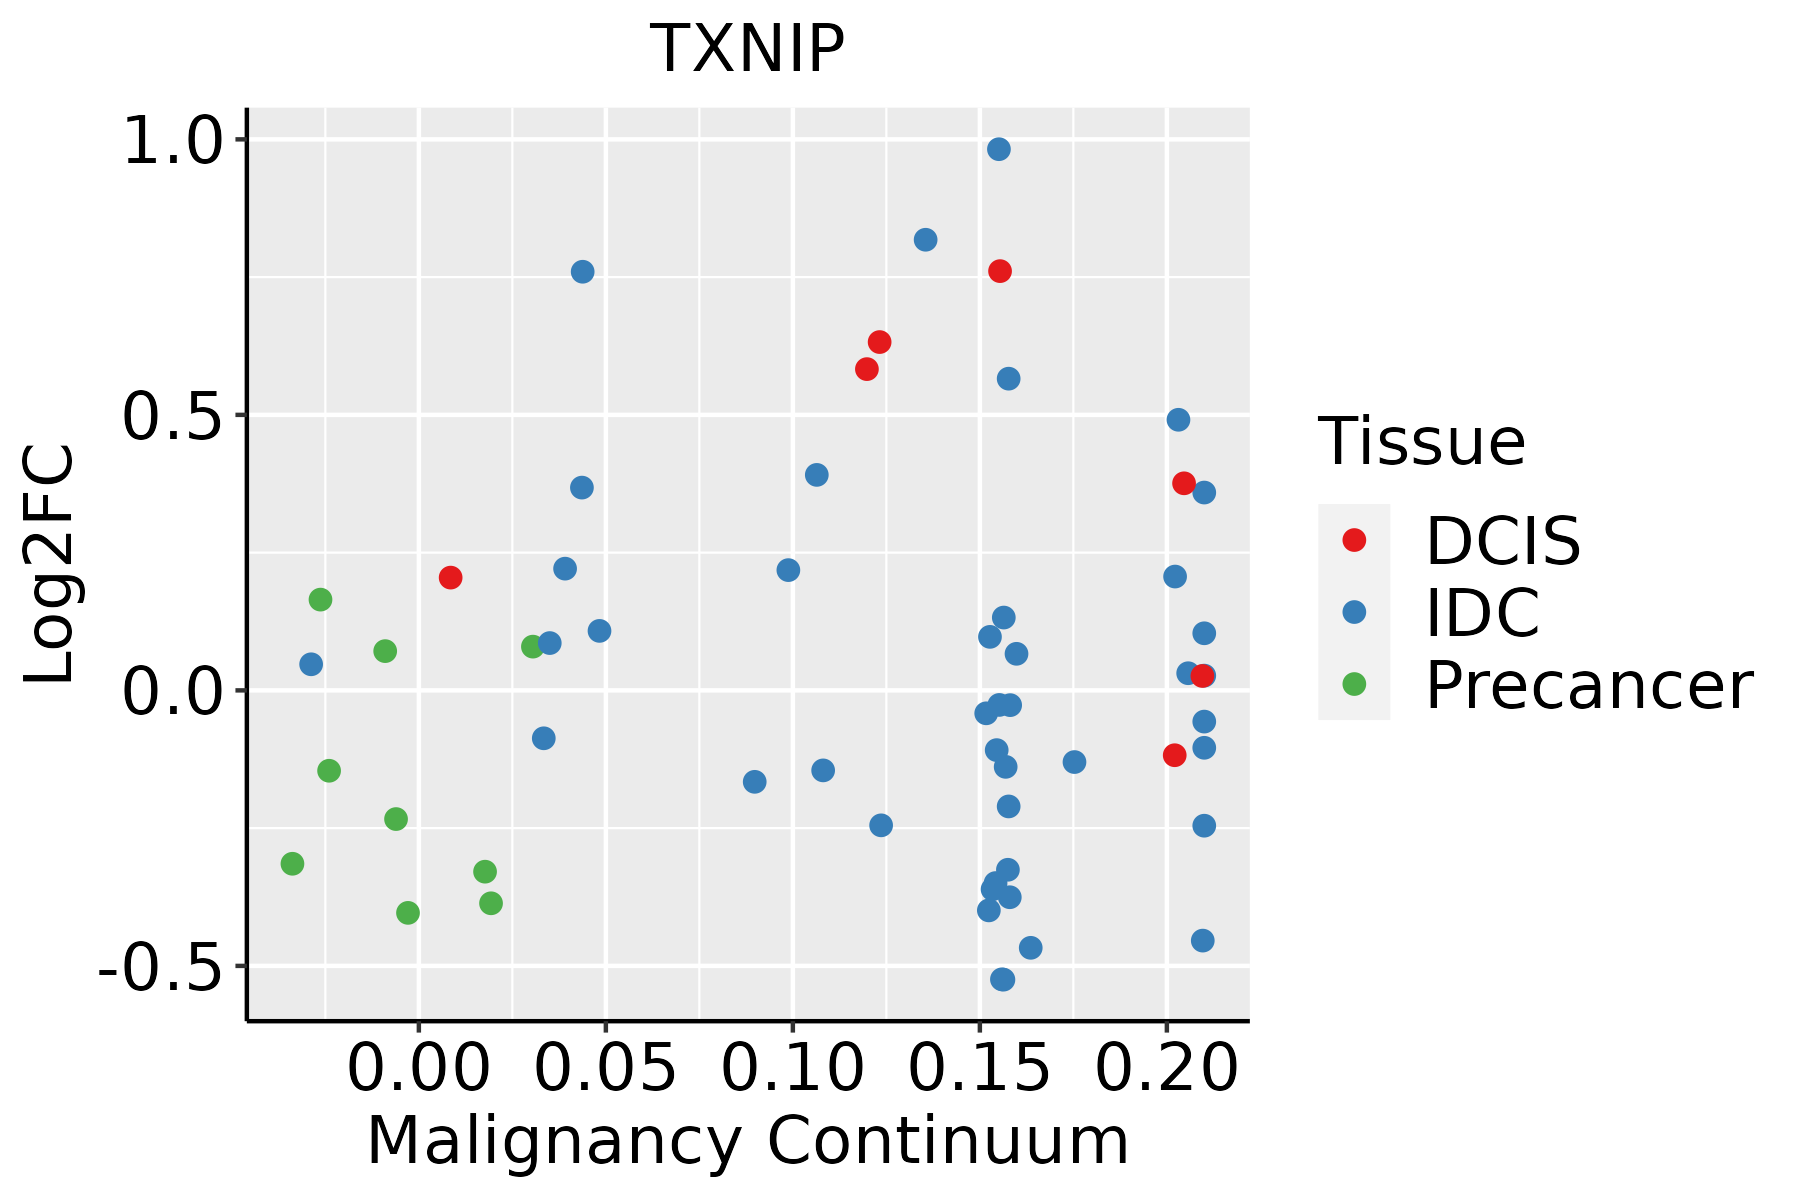 | IDC: Invasive ductal carcinoma |
| DCIS: Ductal carcinoma in situ | ||
| Precancer(BRCA1-mut): Precancerous lesion from BRCA1 mutation carriers | ||
| Cervix |  | CC: Cervix cancer |
| HSIL_HPV: HPV-infected high-grade squamous intraepithelial lesions | ||
| N_HPV: HPV-infected normal cervix | ||
| Colorectum (GSE201348) |  | FAP: Familial adenomatous polyposis |
| CRC: Colorectal cancer | ||
| Colorectum (HTA11) |  | AD: Adenomas |
| SER: Sessile serrated lesions | ||
| MSI-H: Microsatellite-high colorectal cancer | ||
| MSS: Microsatellite stable colorectal cancer | ||
| Endometrium | 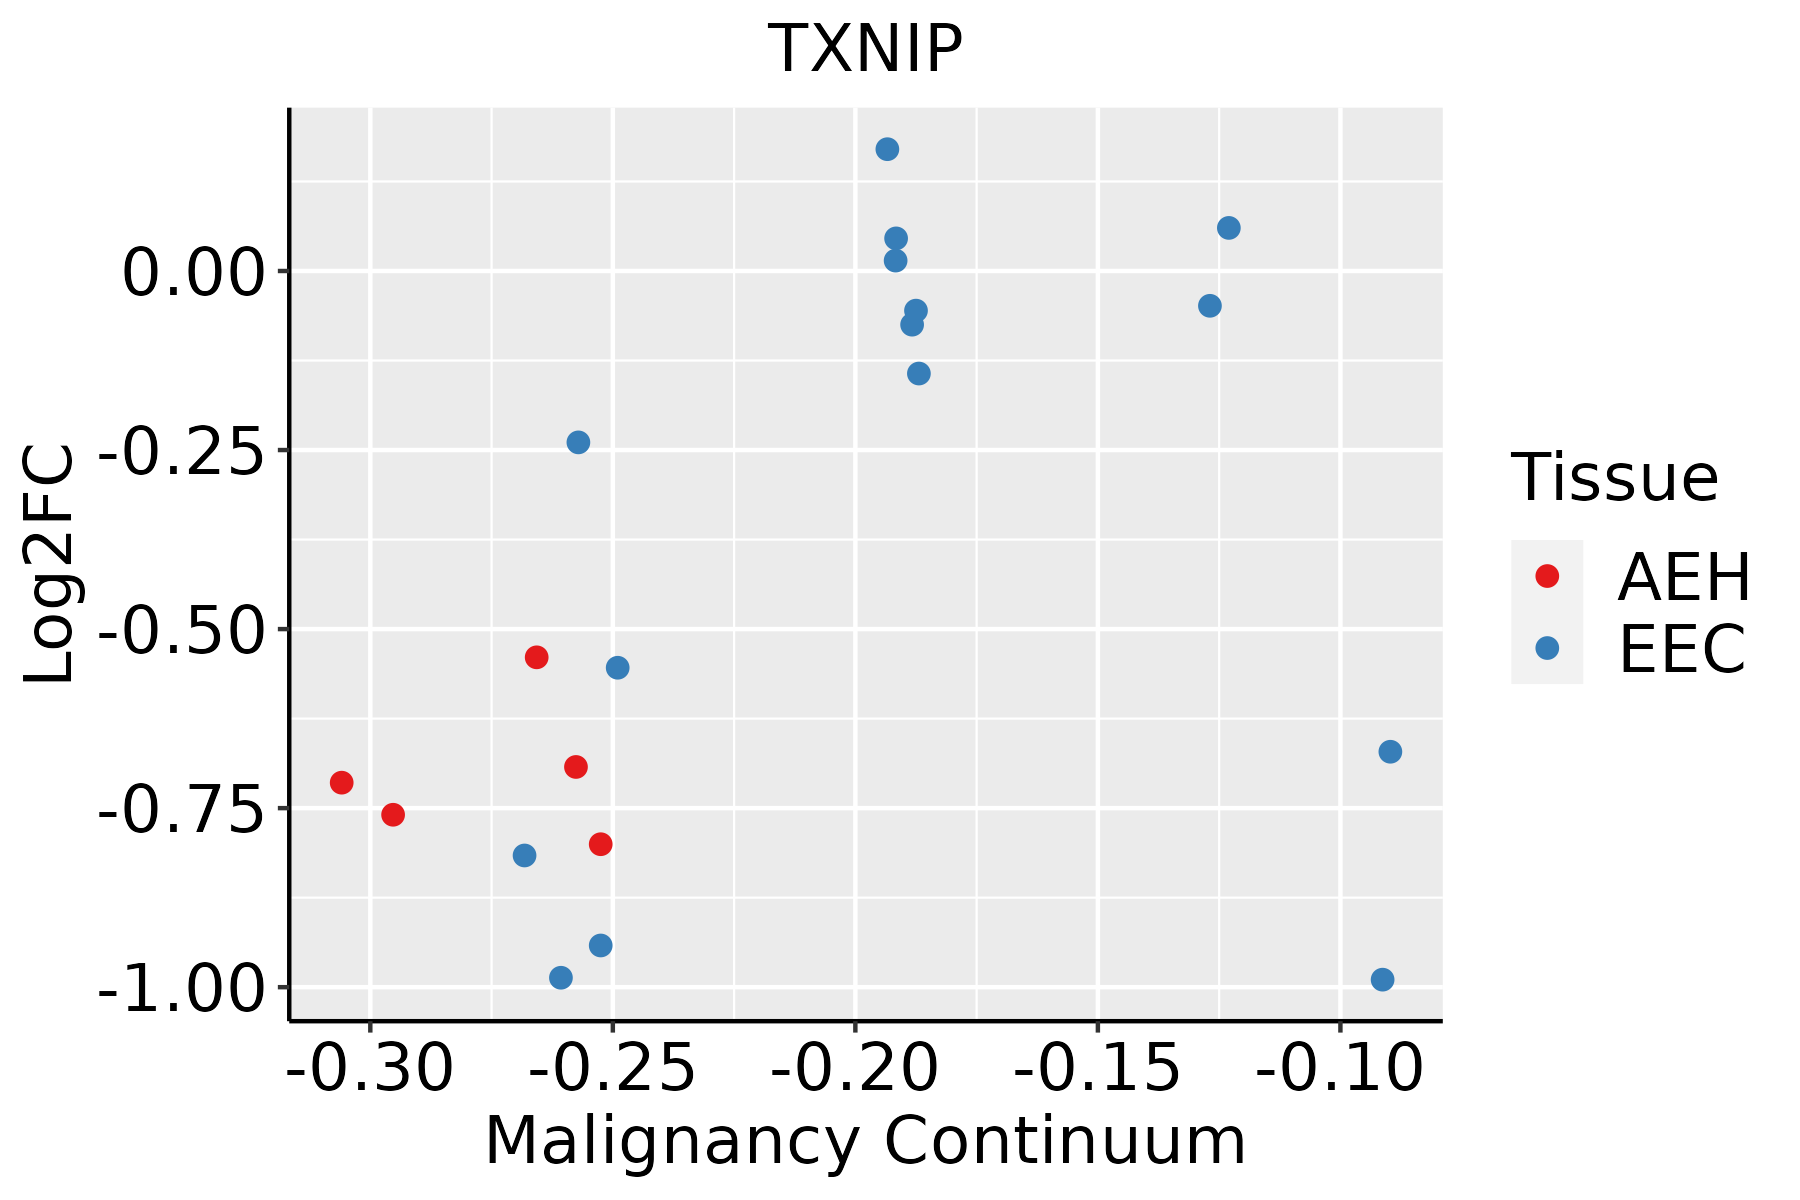 | AEH: Atypical endometrial hyperplasia |
| EEC: Endometrioid Cancer | ||
| Esophagus |  | ESCC: Esophageal squamous cell carcinoma |
| HGIN: High-grade intraepithelial neoplasias | ||
| LGIN: Low-grade intraepithelial neoplasias | ||
| Liver | 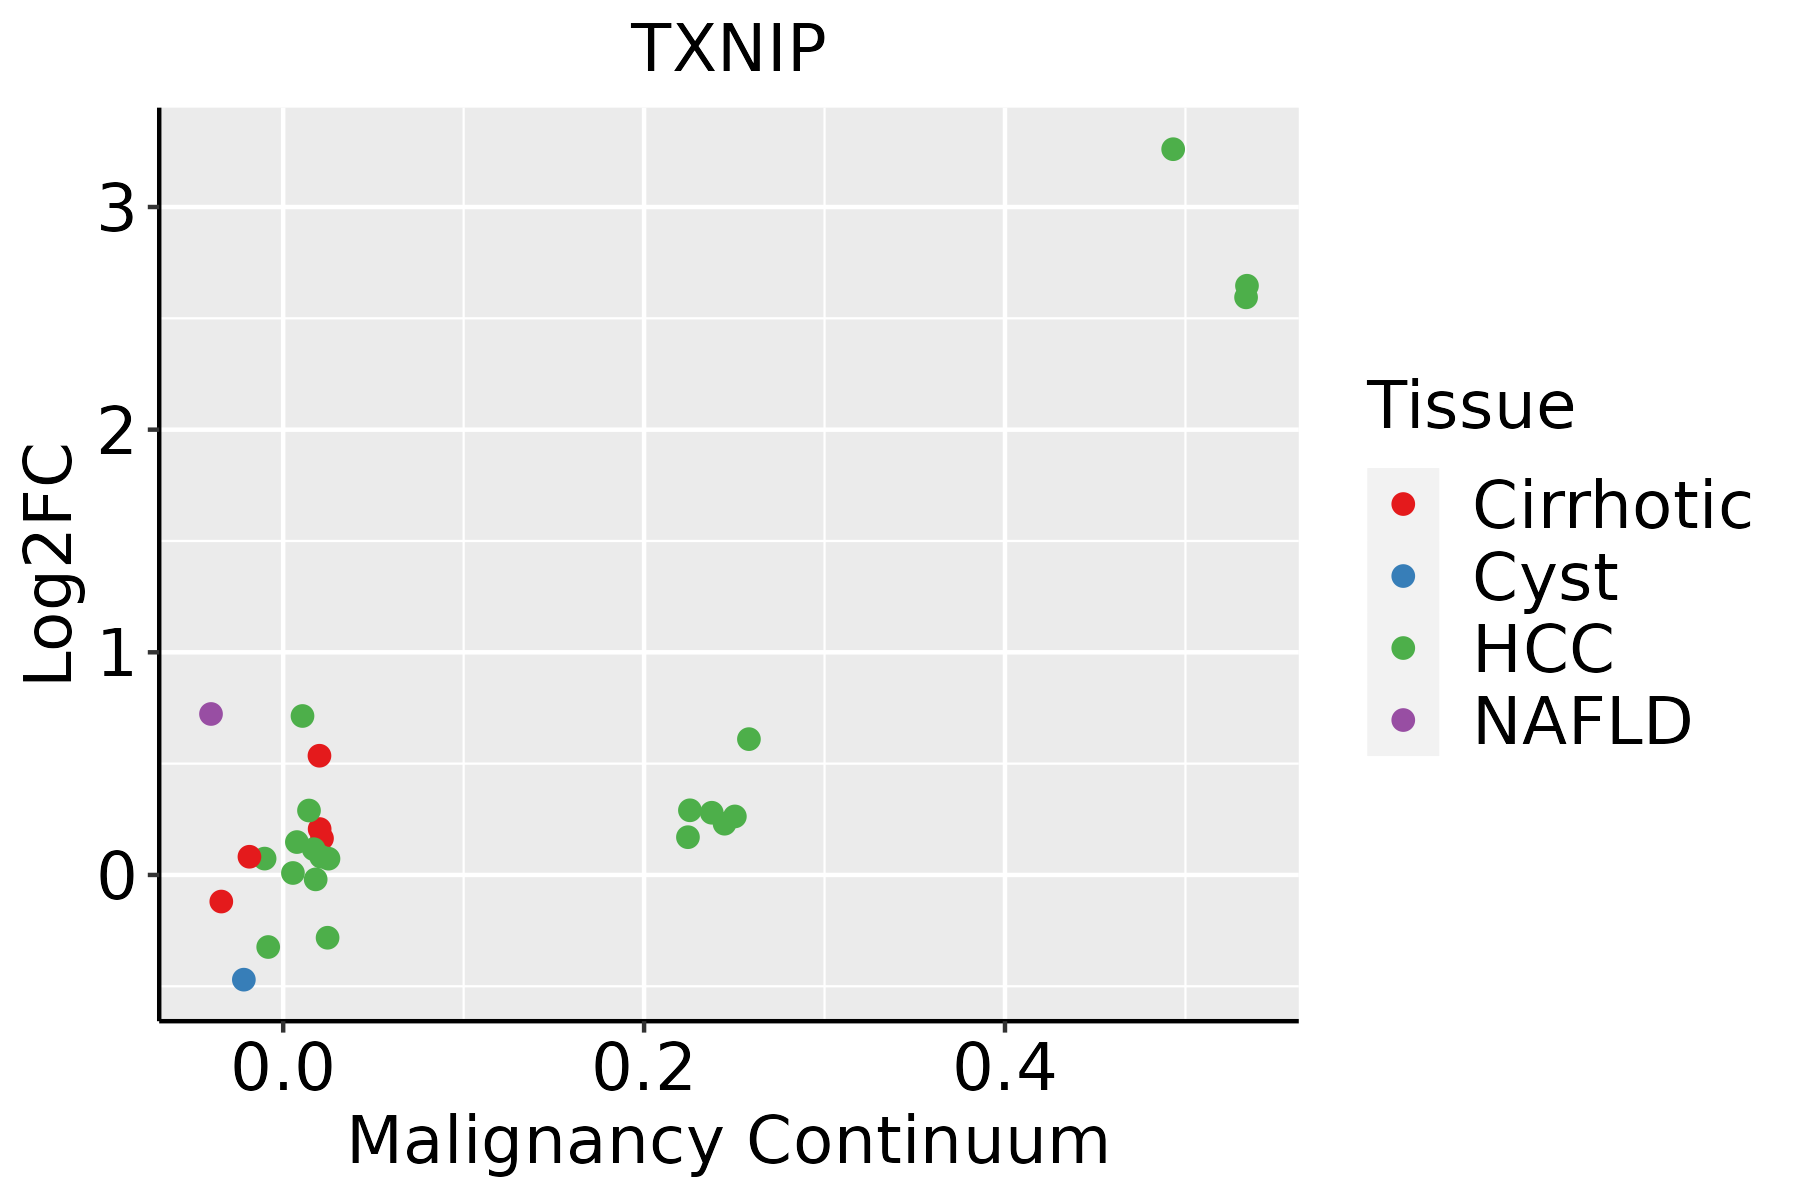 | HCC: Hepatocellular carcinoma |
| NAFLD: Non-alcoholic fatty liver disease | ||
| Oral Cavity | 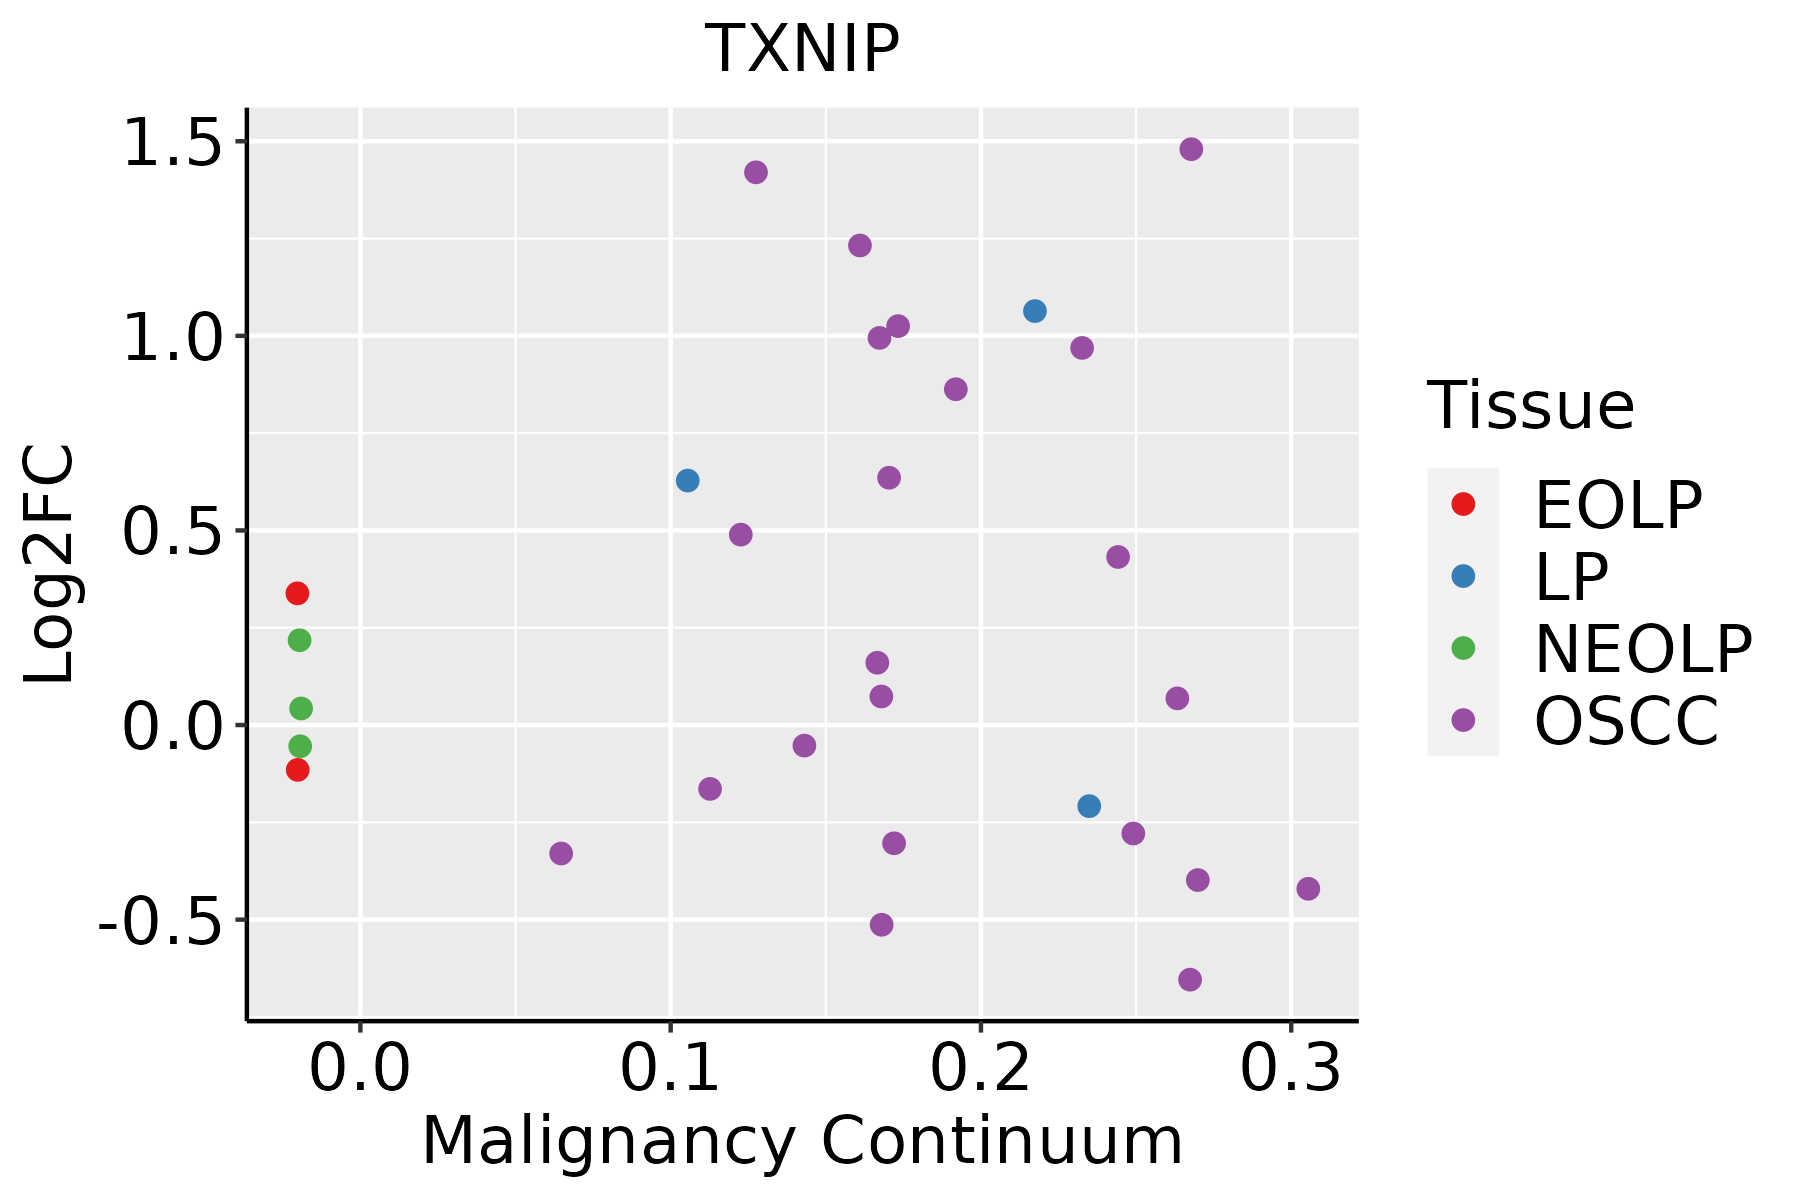 | EOLP: Erosive Oral lichen planus |
| LP: leukoplakia | ||
| NEOLP: Non-erosive oral lichen planus | ||
| OSCC: Oral squamous cell carcinoma | ||
| Prostate |  | BPH: Benign Prostatic Hyperplasia |
| Skin | 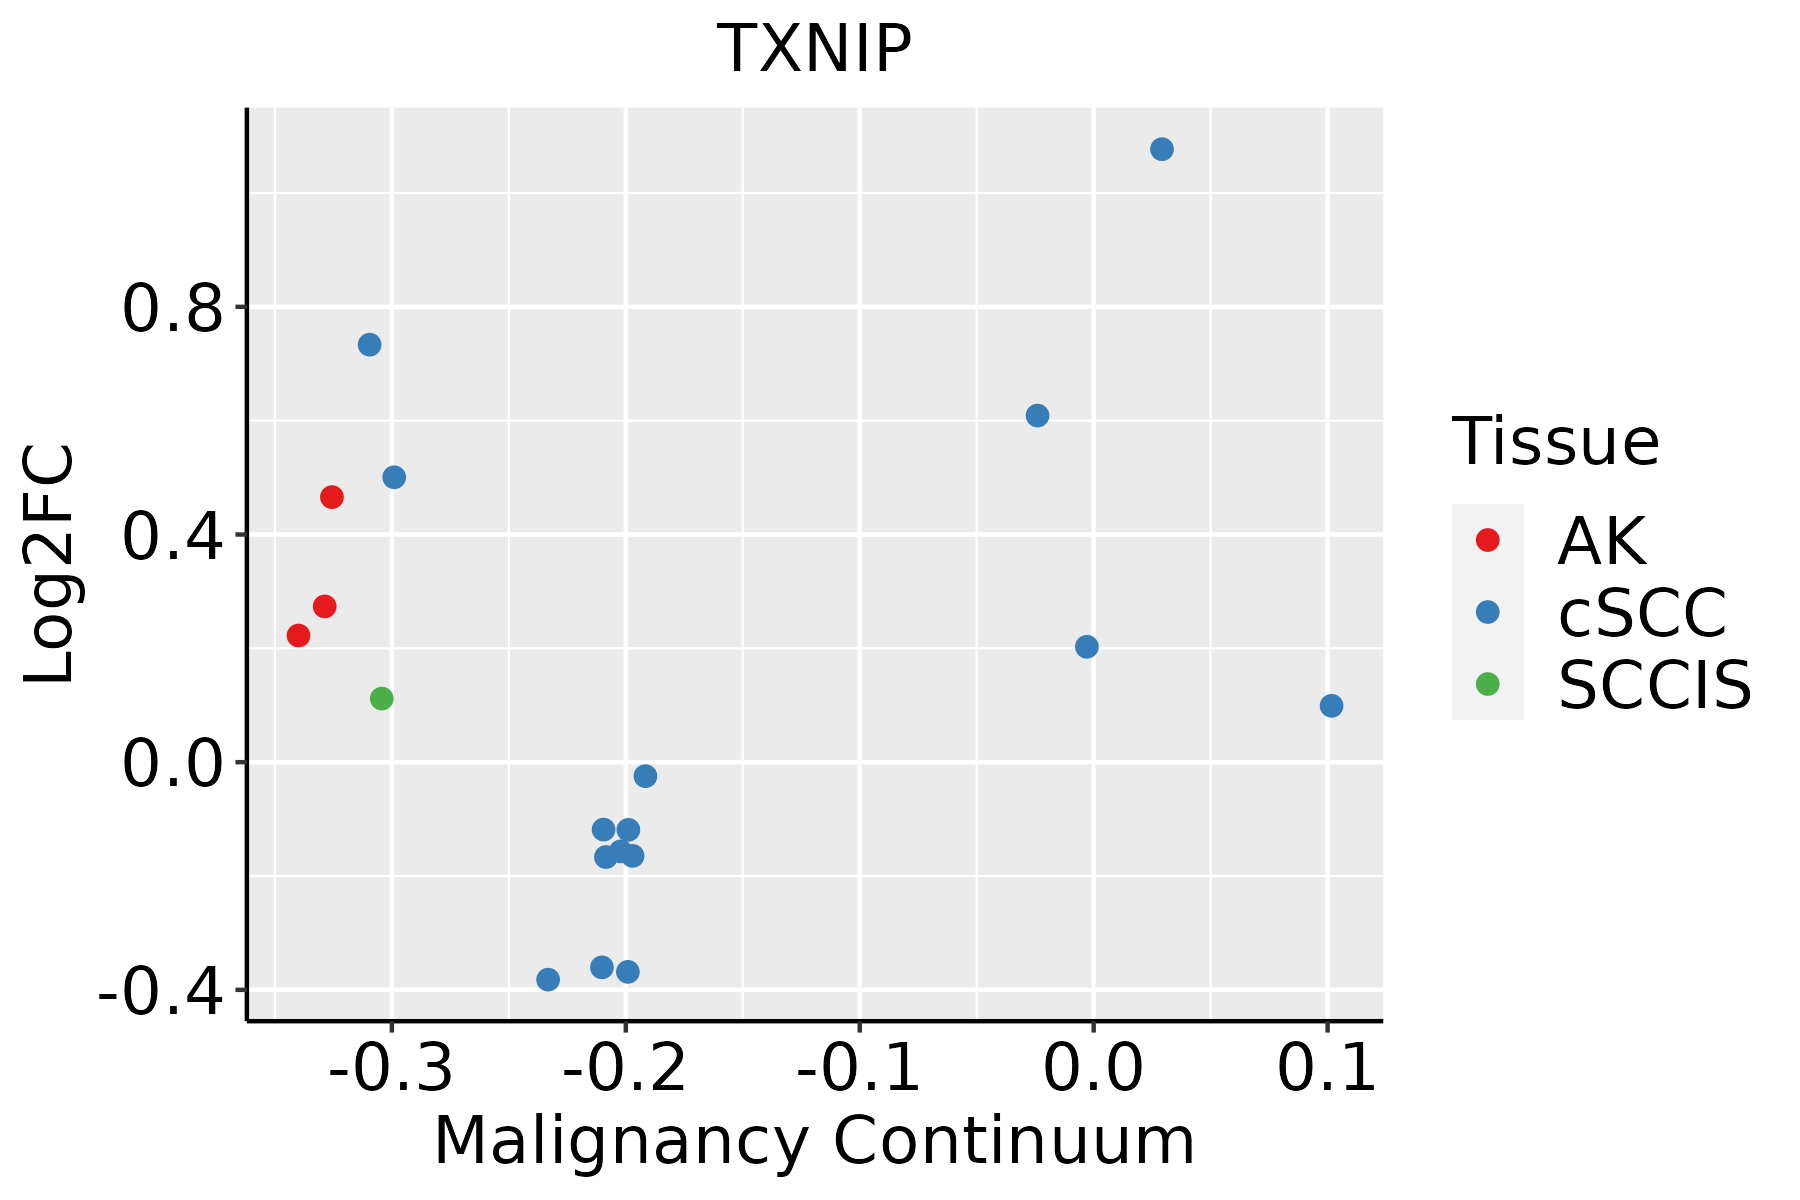 | AK: Actinic keratosis |
| cSCC: Cutaneous squamous cell carcinoma | ||
| SCCIS:squamous cell carcinoma in situ | ||
| Thyroid |  | ATC: Anaplastic thyroid cancer |
| HT: Hashimoto's thyroiditis | ||
| PTC: Papillary thyroid cancer |
| ∗log2FC in expression of this searched gene in stem-like cells from each diseased tissue sample relative to stem-like cells in normal samples in each tissue plotted against the malignancy continuum. Samples are colored based on if they are from different disease stage. |
Top |
Malignant transformation related pathway analysis |
| Find out the enriched GO biological processes and KEGG pathways involved in transition from healthy to precancer to cancer |
| Tissue | Disease Stage | Enriched GO biological Processes |
| Colorectum | AD |  |
| Colorectum | SER |  |
| Colorectum | MSS |  |
| Colorectum | MSI-H |  |
| Colorectum | FAP |  |
| ∗Top 15 enriched GO BP terms are showed in the bar plot of each disease state in each tissue. Each row represents a significant GO biological process which is colored according to the -log10(p.adjust). |
| Page: 1 2 3 4 5 6 7 8 9 |
| GO ID | Tissue | Disease Stage | Description | Gene Ratio | Bg Ratio | pvalue | p.adjust | Count |
| GO:00069799 | Breast | Precancer | response to oxidative stress | 70/1080 | 446/18723 | 1.59e-14 | 4.26e-12 | 70 |
| GO:00485459 | Breast | Precancer | response to steroid hormone | 53/1080 | 339/18723 | 3.07e-11 | 3.66e-09 | 53 |
| GO:00003029 | Breast | Precancer | response to reactive oxygen species | 38/1080 | 222/18723 | 1.47e-09 | 1.23e-07 | 38 |
| GO:00425429 | Breast | Precancer | response to hydrogen peroxide | 26/1080 | 146/18723 | 2.52e-07 | 1.26e-05 | 26 |
| GO:00100389 | Breast | Precancer | response to metal ion | 47/1080 | 373/18723 | 3.88e-07 | 1.79e-05 | 47 |
| GO:00342849 | Breast | Precancer | response to monosaccharide | 29/1080 | 225/18723 | 4.19e-05 | 9.00e-04 | 29 |
| GO:00097439 | Breast | Precancer | response to carbohydrate | 31/1080 | 253/18723 | 6.15e-05 | 1.25e-03 | 31 |
| GO:00097469 | Breast | Precancer | response to hexose | 27/1080 | 219/18723 | 1.61e-04 | 2.69e-03 | 27 |
| GO:00085445 | Breast | Precancer | epidermis development | 35/1080 | 324/18723 | 2.71e-04 | 3.96e-03 | 35 |
| GO:00094108 | Breast | Precancer | response to xenobiotic stimulus | 45/1080 | 462/18723 | 4.17e-04 | 5.56e-03 | 45 |
| GO:00712167 | Breast | Precancer | cellular response to biotic stimulus | 28/1080 | 246/18723 | 4.67e-04 | 6.14e-03 | 28 |
| GO:00323555 | Breast | Precancer | response to estradiol | 19/1080 | 141/18723 | 4.81e-04 | 6.31e-03 | 19 |
| GO:00097498 | Breast | Precancer | response to glucose | 25/1080 | 212/18723 | 5.46e-04 | 7.00e-03 | 25 |
| GO:00725948 | Breast | Precancer | establishment of protein localization to organelle | 41/1080 | 422/18723 | 7.75e-04 | 9.20e-03 | 41 |
| GO:00099136 | Breast | Precancer | epidermal cell differentiation | 23/1080 | 202/18723 | 1.43e-03 | 1.50e-02 | 23 |
| GO:19016549 | Breast | Precancer | response to ketone | 22/1080 | 194/18723 | 1.89e-03 | 1.84e-02 | 22 |
| GO:00515925 | Breast | Precancer | response to calcium ion | 18/1080 | 149/18723 | 2.37e-03 | 2.19e-02 | 18 |
| GO:00302163 | Breast | Precancer | keratinocyte differentiation | 17/1080 | 139/18723 | 2.71e-03 | 2.39e-02 | 17 |
| GO:00096126 | Breast | Precancer | response to mechanical stimulus | 23/1080 | 216/18723 | 3.41e-03 | 2.85e-02 | 23 |
| GO:0002347 | Breast | Precancer | response to tumor cell | 7/1080 | 39/18723 | 6.32e-03 | 4.43e-02 | 7 |
| Page: 1 2 3 4 5 6 7 8 9 10 11 12 13 14 15 16 17 18 19 20 21 22 23 24 25 26 27 28 29 30 31 |
| Pathway ID | Tissue | Disease Stage | Description | Gene Ratio | Bg Ratio | pvalue | p.adjust | qvalue | Count |
| hsa046213 | Cervix | CC | NOD-like receptor signaling pathway | 41/1267 | 186/8465 | 5.90e-03 | 1.95e-02 | 1.15e-02 | 41 |
| hsa0462112 | Cervix | CC | NOD-like receptor signaling pathway | 41/1267 | 186/8465 | 5.90e-03 | 1.95e-02 | 1.15e-02 | 41 |
| hsa046219 | Esophagus | HGIN | NOD-like receptor signaling pathway | 45/1383 | 186/8465 | 3.40e-03 | 2.54e-02 | 2.02e-02 | 45 |
| hsa0462114 | Esophagus | HGIN | NOD-like receptor signaling pathway | 45/1383 | 186/8465 | 3.40e-03 | 2.54e-02 | 2.02e-02 | 45 |
| hsa0462122 | Esophagus | ESCC | NOD-like receptor signaling pathway | 116/4205 | 186/8465 | 2.90e-04 | 1.03e-03 | 5.30e-04 | 116 |
| hsa0462132 | Esophagus | ESCC | NOD-like receptor signaling pathway | 116/4205 | 186/8465 | 2.90e-04 | 1.03e-03 | 5.30e-04 | 116 |
| hsa046218 | Oral cavity | OSCC | NOD-like receptor signaling pathway | 108/3704 | 186/8465 | 5.13e-05 | 2.07e-04 | 1.05e-04 | 108 |
| hsa0462113 | Oral cavity | OSCC | NOD-like receptor signaling pathway | 108/3704 | 186/8465 | 5.13e-05 | 2.07e-04 | 1.05e-04 | 108 |
| hsa0462121 | Oral cavity | LP | NOD-like receptor signaling pathway | 73/2418 | 186/8465 | 9.80e-04 | 4.53e-03 | 2.92e-03 | 73 |
| hsa0462131 | Oral cavity | LP | NOD-like receptor signaling pathway | 73/2418 | 186/8465 | 9.80e-04 | 4.53e-03 | 2.92e-03 | 73 |
| Page: 1 |
Top |
Cell-cell communication analysis |
| Identification of potential cell-cell interactions between two cell types and their ligand-receptor pairs for different disease states |
| Ligand | Receptor | LRpair | Pathway | Tissue | Disease Stage |
| Page: 1 |
Top |
Single-cell gene regulatory network inference analysis |
| Find out the significant the regulons (TFs) and the target genes of each regulon across cell types for different disease states |
| TF | Cell Type | Tissue | Disease Stage | Target Gene | RSS | Regulon Activity |
| ∗The dot plots of a searched regulon are shown for all cell subpopulations in each disease state of each tissue based on the regulon specific score inferred using pySCENIC and by calculating the average expression. |
| Page: 1 |
Top |
Somatic mutation of malignant transformation related genes |
| Annotation of somatic variants for genes involved in malignant transformation |
| Hugo Symbol | Variant Class | Variant Classification | dbSNP RS | HGVSc | HGVSp | HGVSp Short | SWISSPROT | BIOTYPE | SIFT | PolyPhen | Tumor Sample Barcode | Tissue | Histology | Sex | Age | Stage | Therapy Types | Drugs | Outcome |
| TXNIP | SNV | Missense_Mutation | c.511N>G | p.Met171Val | p.M171V | Q9H3M7 | protein_coding | tolerated(0.05) | benign(0.007) | TCGA-A1-A0SP-01 | Breast | breast invasive carcinoma | Female | <65 | I/II | Chemotherapy | SD | ||
| TXNIP | SNV | Missense_Mutation | c.392N>A | p.Arg131His | p.R131H | Q9H3M7 | protein_coding | deleterious(0) | probably_damaging(0.99) | TCGA-AR-A251-01 | Breast | breast invasive carcinoma | Female | <65 | III/IV | Chemotherapy | doxorubicin | SD | |
| TXNIP | insertion | In_Frame_Ins | novel | c.267_268insCAG | p.Val89_Ile90insGln | p.V89_I90insQ | Q9H3M7 | protein_coding | TCGA-A8-A07J-01 | Breast | breast invasive carcinoma | Female | <65 | I/II | Chemotherapy | 5-fluorouracil | CR | ||
| TXNIP | insertion | Frame_Shift_Ins | novel | c.265_266insAGGTTGCAGTGAGCCCAGAC | p.Val89GlufsTer8 | p.V89Efs*8 | Q9H3M7 | protein_coding | TCGA-A8-A07J-01 | Breast | breast invasive carcinoma | Female | <65 | I/II | Chemotherapy | 5-fluorouracil | CR | ||
| TXNIP | deletion | Frame_Shift_Del | novel | c.705_708delNNNN | p.Val237GlufsTer40 | p.V237Efs*40 | Q9H3M7 | protein_coding | TCGA-DS-A3LQ-01 | Cervix | cervical & endocervical cancer | Female | <65 | III/IV | Chemotherapy | cisplatin | SD | ||
| TXNIP | SNV | Missense_Mutation | c.26N>A | p.Ser9Tyr | p.S9Y | Q9H3M7 | protein_coding | deleterious(0.01) | benign(0.025) | TCGA-AA-A010-01 | Colorectum | colon adenocarcinoma | Female | <65 | I/II | Chemotherapy | folinic | CR | |
| TXNIP | SNV | Missense_Mutation | c.561N>C | p.Lys187Asn | p.K187N | Q9H3M7 | protein_coding | deleterious(0) | possibly_damaging(0.543) | TCGA-AZ-6598-01 | Colorectum | colon adenocarcinoma | Female | >=65 | I/II | Unknown | Unknown | SD | |
| TXNIP | SNV | Missense_Mutation | c.1141G>A | p.Val381Met | p.V381M | Q9H3M7 | protein_coding | deleterious(0.02) | benign(0.017) | TCGA-CK-4951-01 | Colorectum | colon adenocarcinoma | Female | >=65 | I/II | Unknown | Unknown | PD | |
| TXNIP | SNV | Missense_Mutation | c.26C>A | p.Ser9Tyr | p.S9Y | Q9H3M7 | protein_coding | deleterious(0.01) | benign(0.025) | TCGA-F5-6814-01 | Colorectum | rectum adenocarcinoma | Male | <65 | I/II | Unknown | Unknown | SD | |
| TXNIP | insertion | In_Frame_Ins | novel | c.989-1_989insTAAAGATGA | p.Ala330delinsValLysMetThr | p.A330delinsVKMT | Q9H3M7 | protein_coding | TCGA-AM-5820-01 | Colorectum | colon adenocarcinoma | Female | <65 | I/II | Unknown | Unknown | SD |
| Page: 1 2 3 4 5 |
Top |
Related drugs of malignant transformation related genes |
| Identification of chemicals and drugs interact with genes involved in malignant transfromation |
| (DGIdb 4.0) |
| Entrez ID | Symbol | Category | Interaction Types | Drug Claim Name | Drug Name | PMIDs |
| 10628 | TXNIP | TRANSCRIPTION FACTOR | FAS-LIGAND | 12706526 |
| Page: 1 |

Copyright 2023-Present -The University of Texas Health Science Center at Houston |