
|
|||||
|
 | |
| |
| |
| |
| |
| |
|
Gene: TXNDC17 |
Gene summary for TXNDC17 |
| Gene information | Species | Human | Gene symbol | TXNDC17 | Gene ID | 84817 |
| Gene name | thioredoxin domain containing 17 | |
| Gene Alias | TRP14 | |
| Cytomap | 17p13.1 | |
| Gene Type | protein-coding | GO ID | GO:0007154 | UniProtAcc | A0A140VJY7 |
Top |
Malignant transformation analysis |
| Identification of the aberrant gene expression in precancerous and cancerous lesions by comparing the gene expression of stem-like cells in diseased tissues with normal stem cells |
| Entrez ID | Symbol | Replicates | Species | Organ | Tissue | Adj P-value | Log2FC | Malignancy |
| 84817 | TXNDC17 | GSM4909285 | Human | Breast | IDC | 2.24e-04 | 2.83e-01 | 0.21 |
| 84817 | TXNDC17 | GSM4909286 | Human | Breast | IDC | 2.76e-05 | -2.46e-01 | 0.1081 |
| 84817 | TXNDC17 | GSM4909290 | Human | Breast | IDC | 2.79e-12 | 5.14e-01 | 0.2096 |
| 84817 | TXNDC17 | GSM4909293 | Human | Breast | IDC | 3.25e-10 | 3.73e-01 | 0.1581 |
| 84817 | TXNDC17 | GSM4909294 | Human | Breast | IDC | 1.25e-24 | 6.30e-01 | 0.2022 |
| 84817 | TXNDC17 | GSM4909296 | Human | Breast | IDC | 6.44e-08 | -1.03e-02 | 0.1524 |
| 84817 | TXNDC17 | GSM4909297 | Human | Breast | IDC | 1.88e-12 | -6.69e-02 | 0.1517 |
| 84817 | TXNDC17 | GSM4909301 | Human | Breast | IDC | 1.29e-05 | 3.21e-01 | 0.1577 |
| 84817 | TXNDC17 | GSM4909302 | Human | Breast | IDC | 1.59e-02 | 2.03e-01 | 0.1545 |
| 84817 | TXNDC17 | GSM4909304 | Human | Breast | IDC | 2.54e-06 | 3.31e-01 | 0.1636 |
| 84817 | TXNDC17 | GSM4909306 | Human | Breast | IDC | 6.25e-03 | 3.33e-01 | 0.1564 |
| 84817 | TXNDC17 | GSM4909311 | Human | Breast | IDC | 6.53e-25 | -2.15e-01 | 0.1534 |
| 84817 | TXNDC17 | GSM4909312 | Human | Breast | IDC | 3.73e-07 | -1.54e-01 | 0.1552 |
| 84817 | TXNDC17 | GSM4909313 | Human | Breast | IDC | 3.47e-04 | -1.93e-03 | 0.0391 |
| 84817 | TXNDC17 | GSM4909315 | Human | Breast | IDC | 1.48e-22 | 6.84e-01 | 0.21 |
| 84817 | TXNDC17 | GSM4909316 | Human | Breast | IDC | 2.98e-17 | 6.89e-01 | 0.21 |
| 84817 | TXNDC17 | GSM4909317 | Human | Breast | IDC | 1.89e-04 | 3.34e-01 | 0.1355 |
| 84817 | TXNDC17 | GSM4909318 | Human | Breast | IDC | 1.40e-03 | 3.95e-01 | 0.2031 |
| 84817 | TXNDC17 | GSM4909319 | Human | Breast | IDC | 1.64e-37 | -2.71e-01 | 0.1563 |
| 84817 | TXNDC17 | GSM4909320 | Human | Breast | IDC | 5.18e-07 | 2.40e-02 | 0.1575 |
| Page: 1 2 3 4 5 6 7 8 9 10 11 12 13 |
| Tissue | Expression Dynamics | Abbreviation |
| Breast | 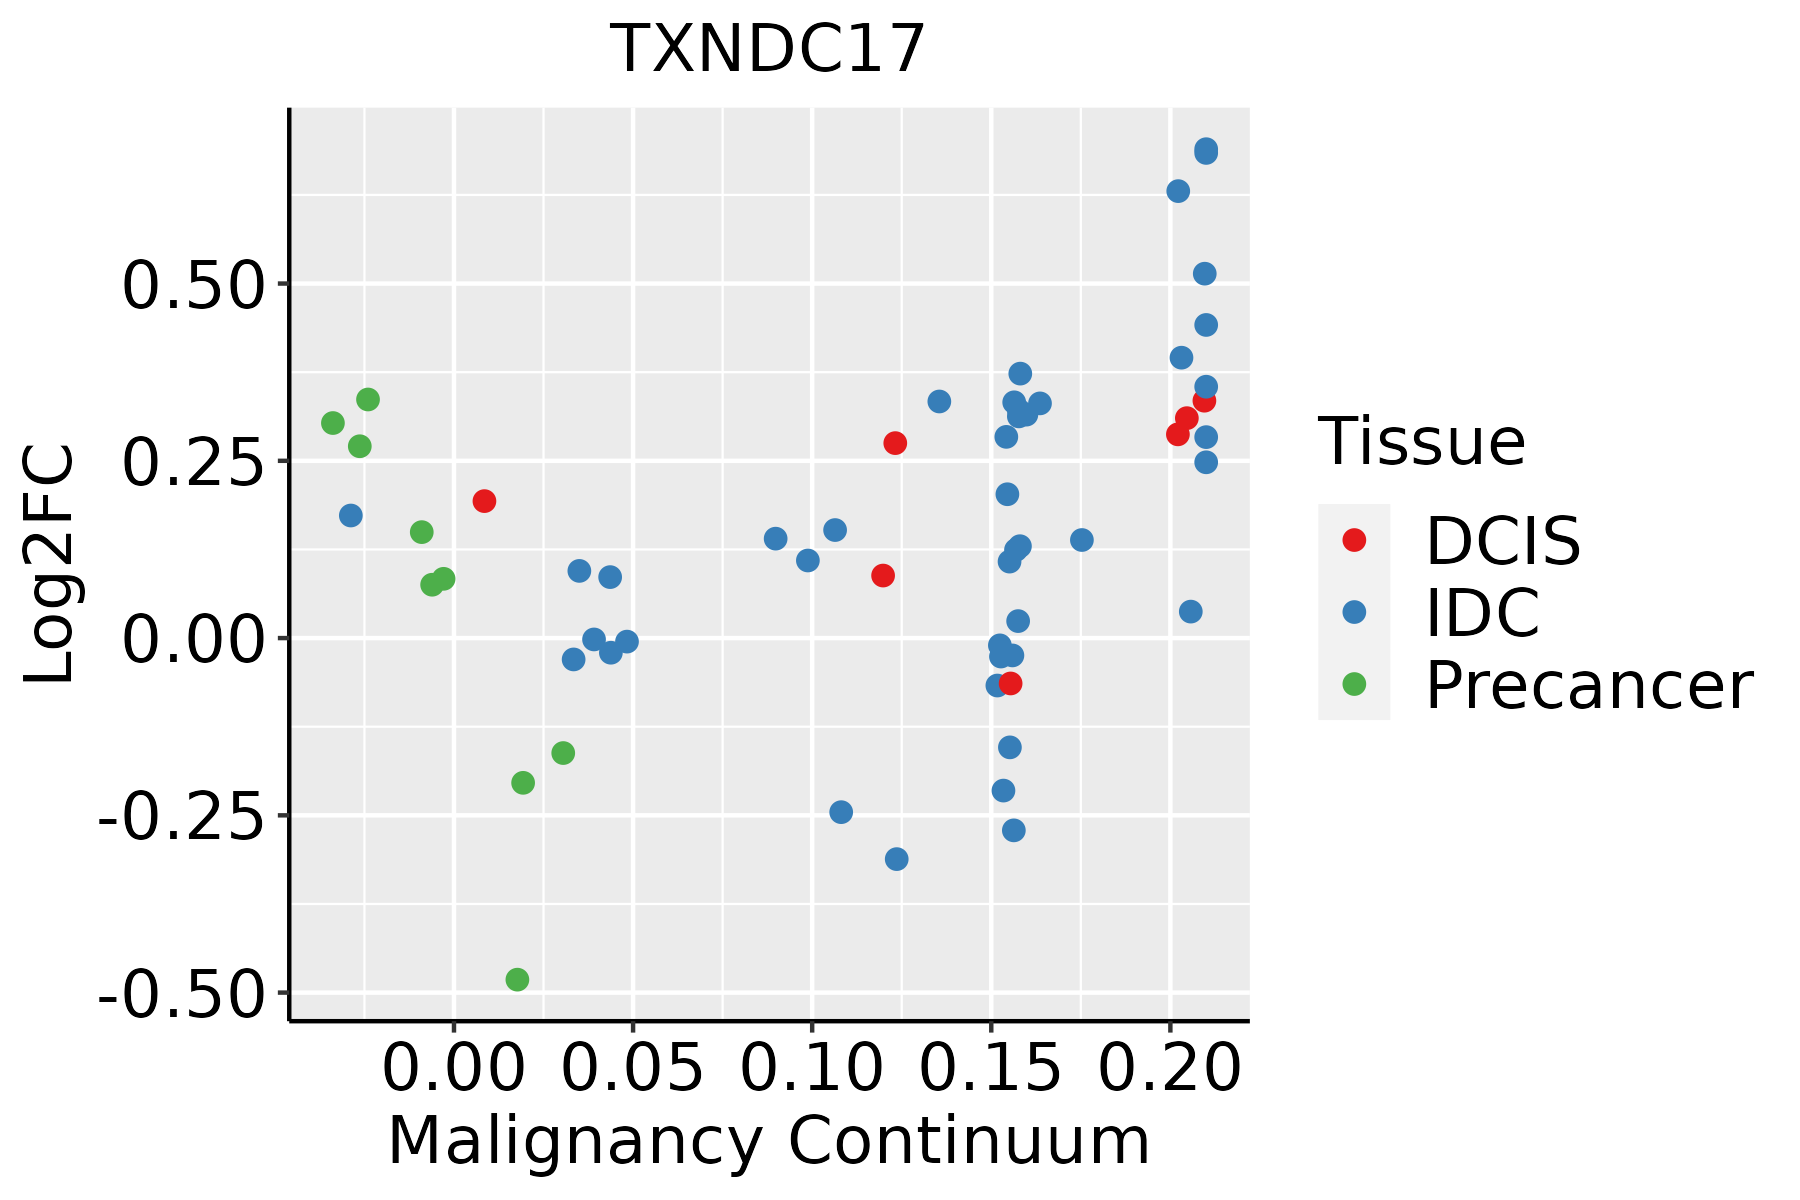 | IDC: Invasive ductal carcinoma |
| DCIS: Ductal carcinoma in situ | ||
| Precancer(BRCA1-mut): Precancerous lesion from BRCA1 mutation carriers | ||
| Cervix | 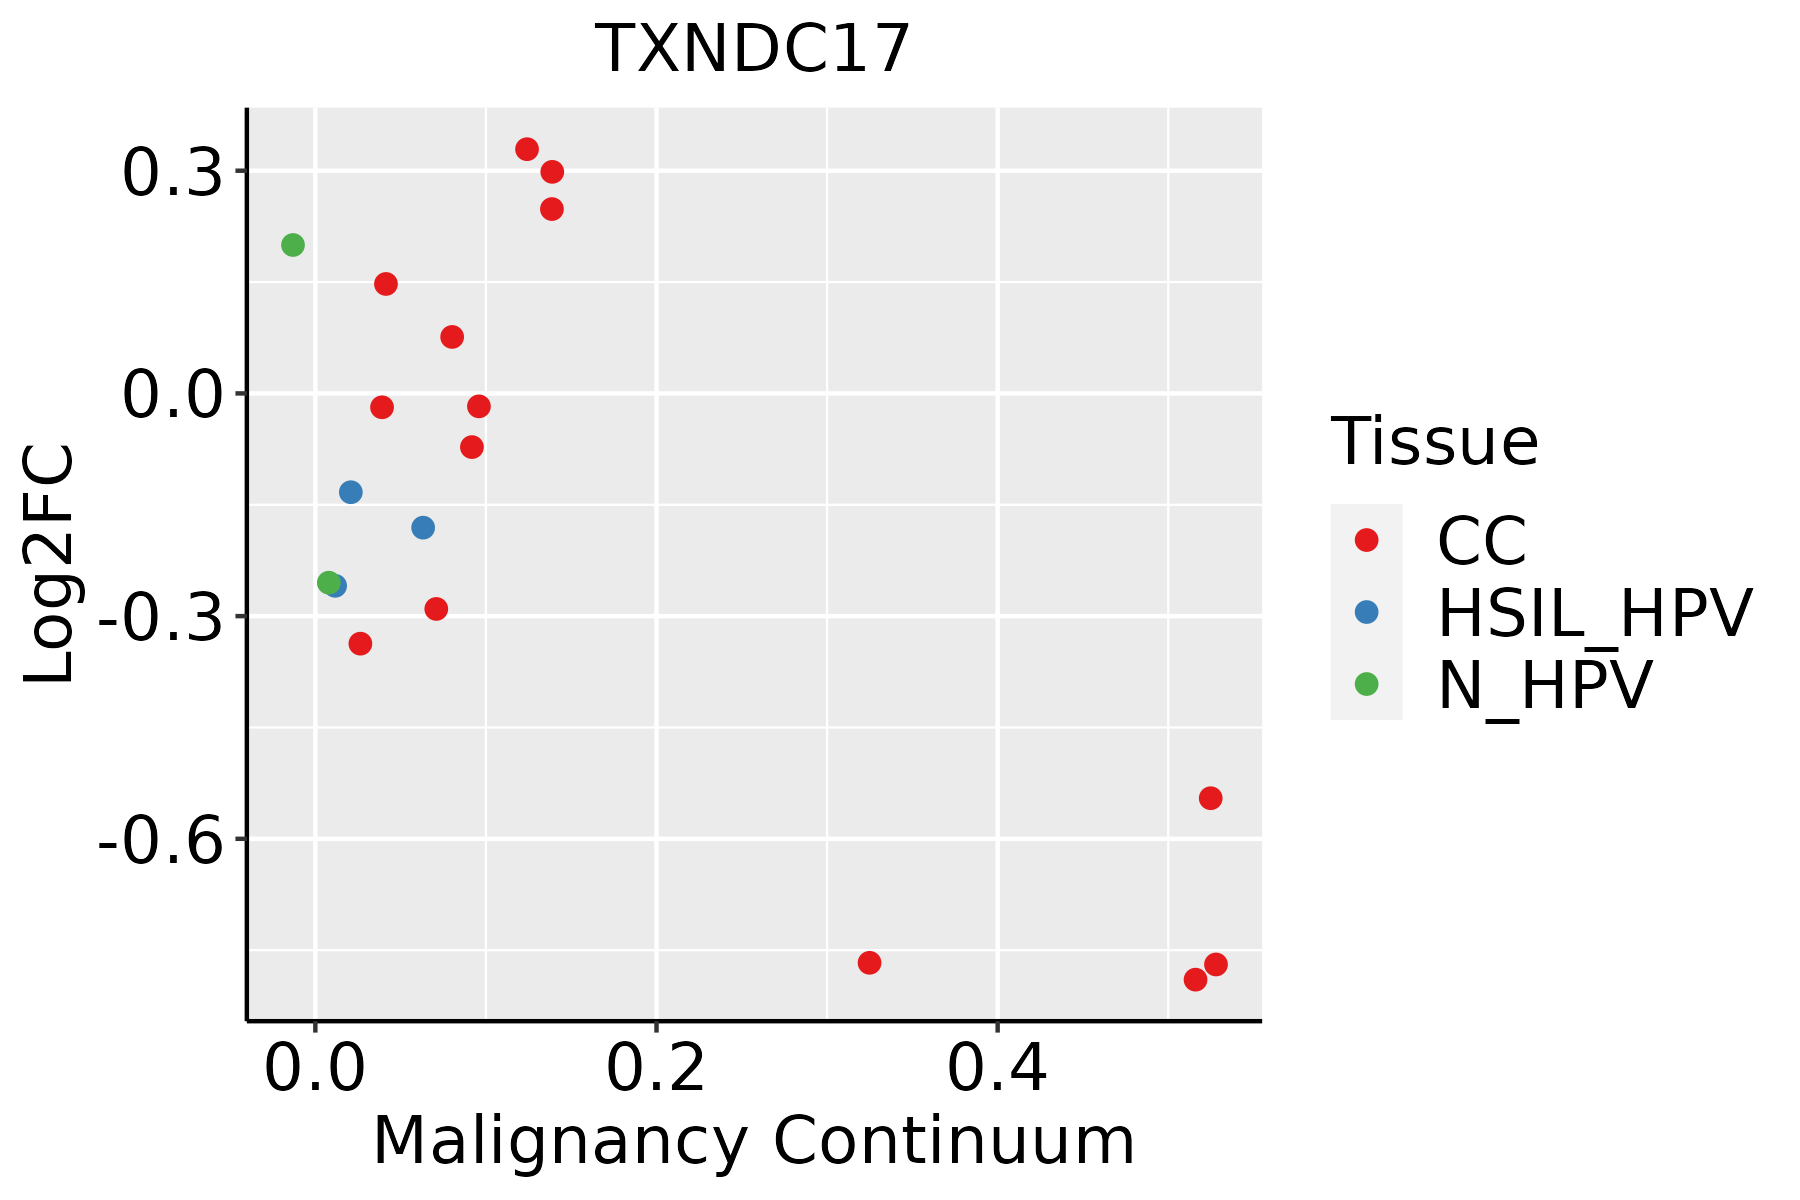 | CC: Cervix cancer |
| HSIL_HPV: HPV-infected high-grade squamous intraepithelial lesions | ||
| N_HPV: HPV-infected normal cervix | ||
| Colorectum (GSE201348) | 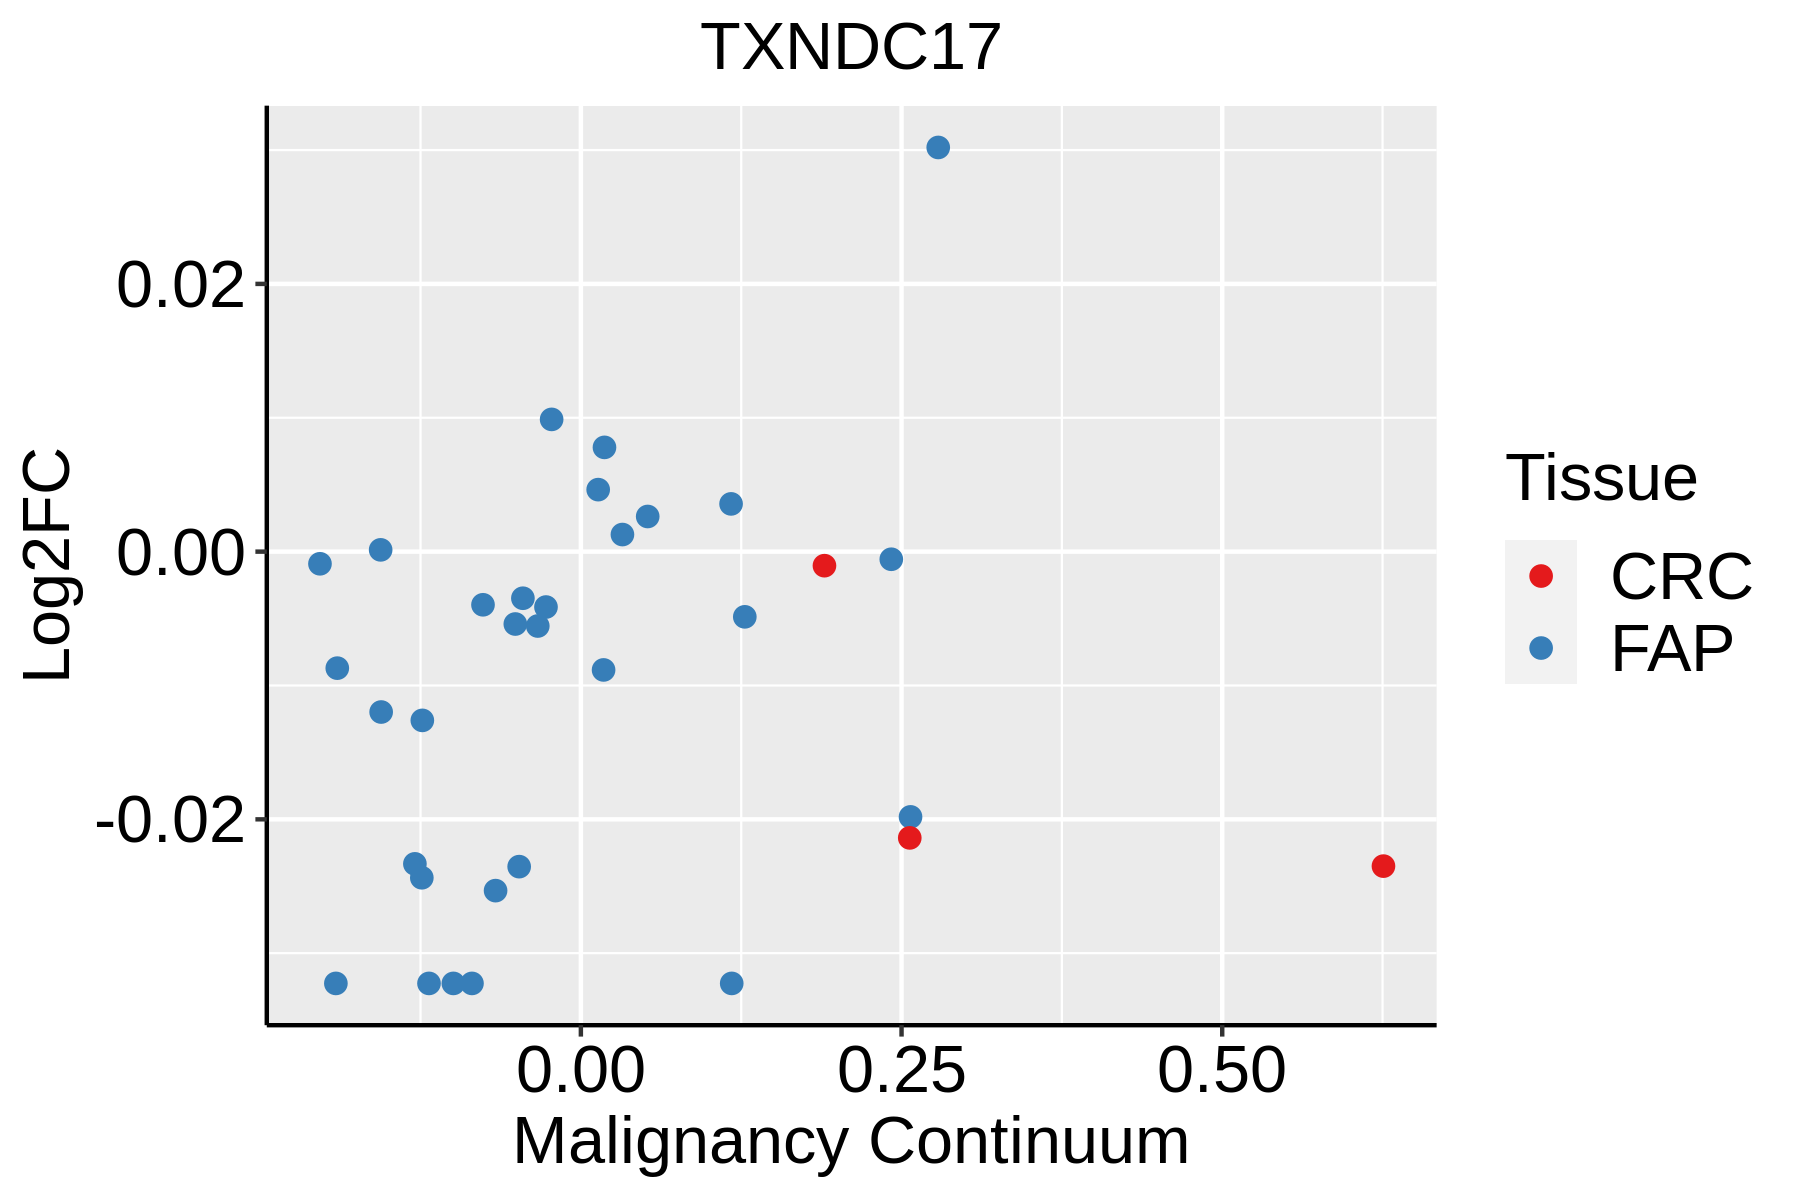 | FAP: Familial adenomatous polyposis |
| CRC: Colorectal cancer | ||
| Colorectum (HTA11) | 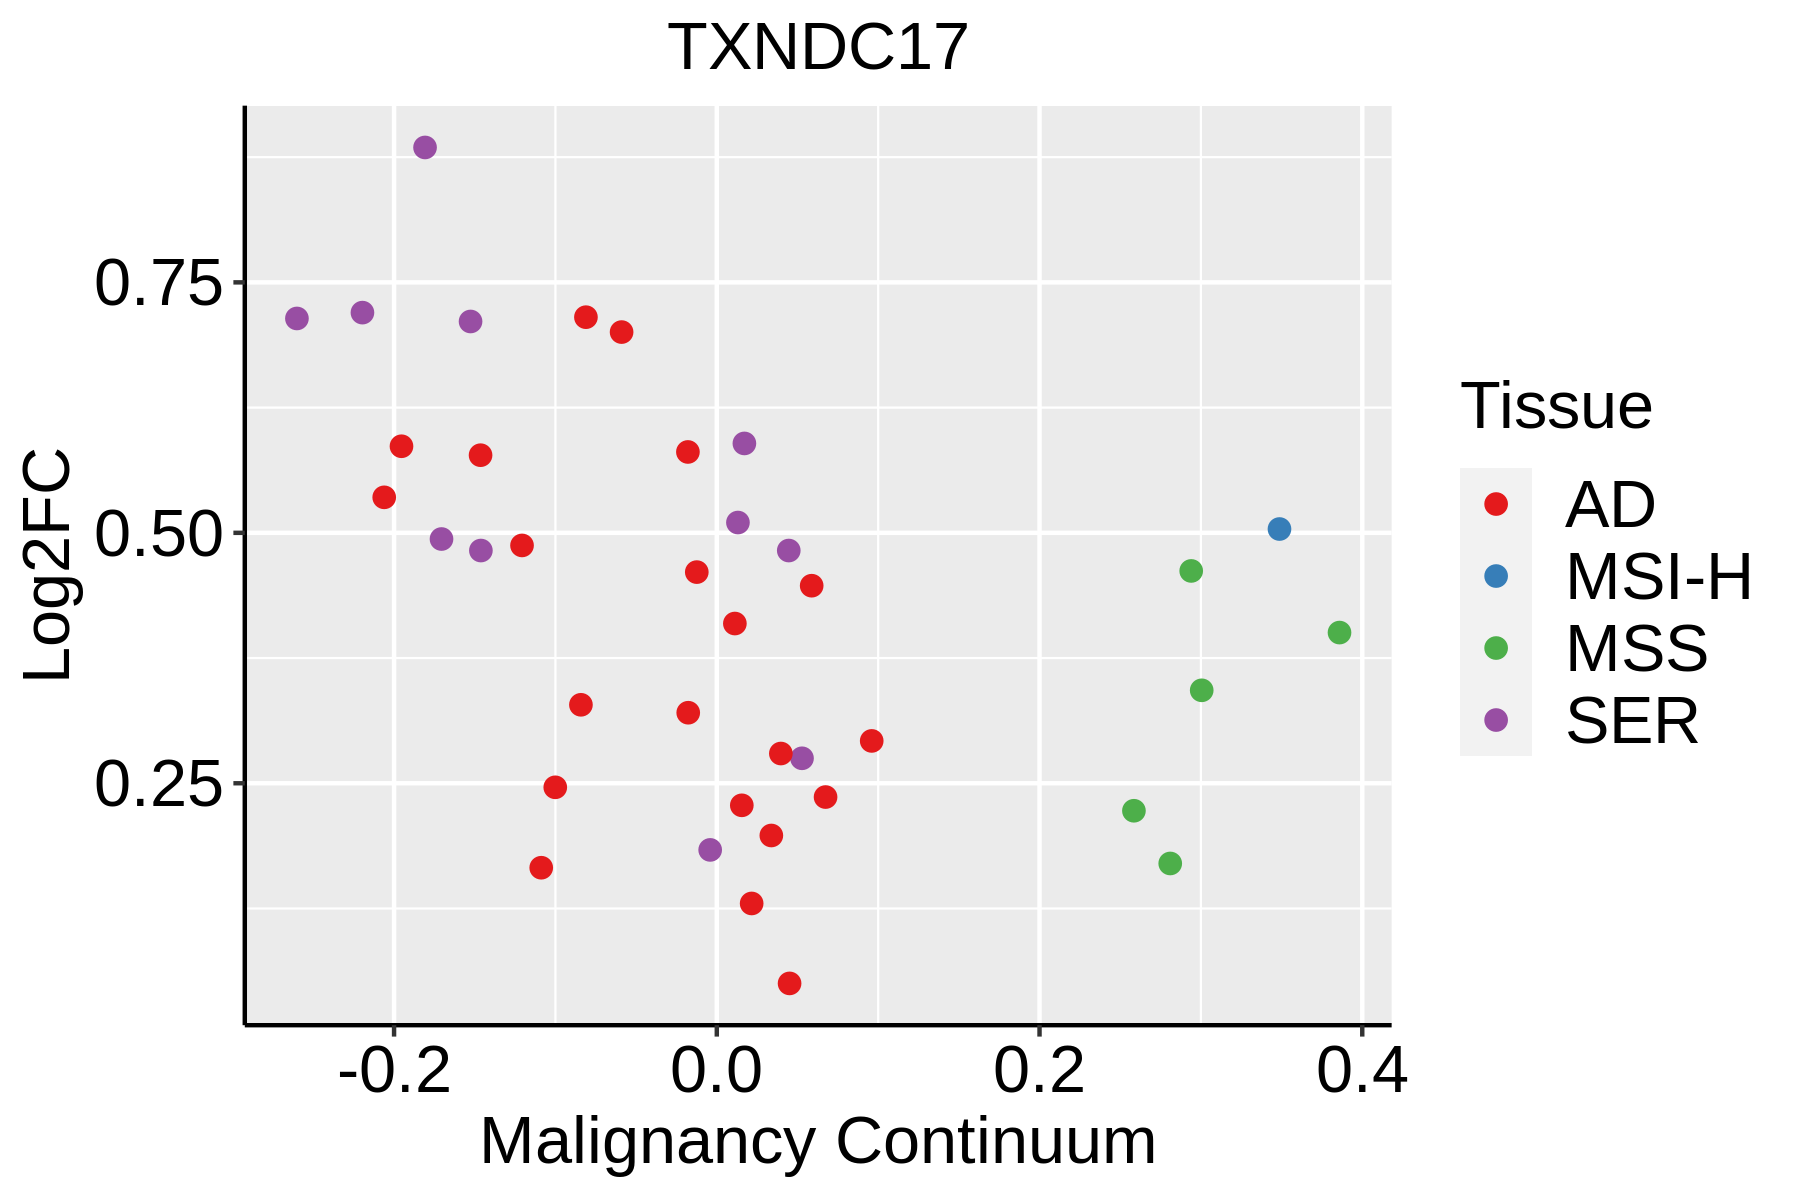 | AD: Adenomas |
| SER: Sessile serrated lesions | ||
| MSI-H: Microsatellite-high colorectal cancer | ||
| MSS: Microsatellite stable colorectal cancer | ||
| Endometrium | 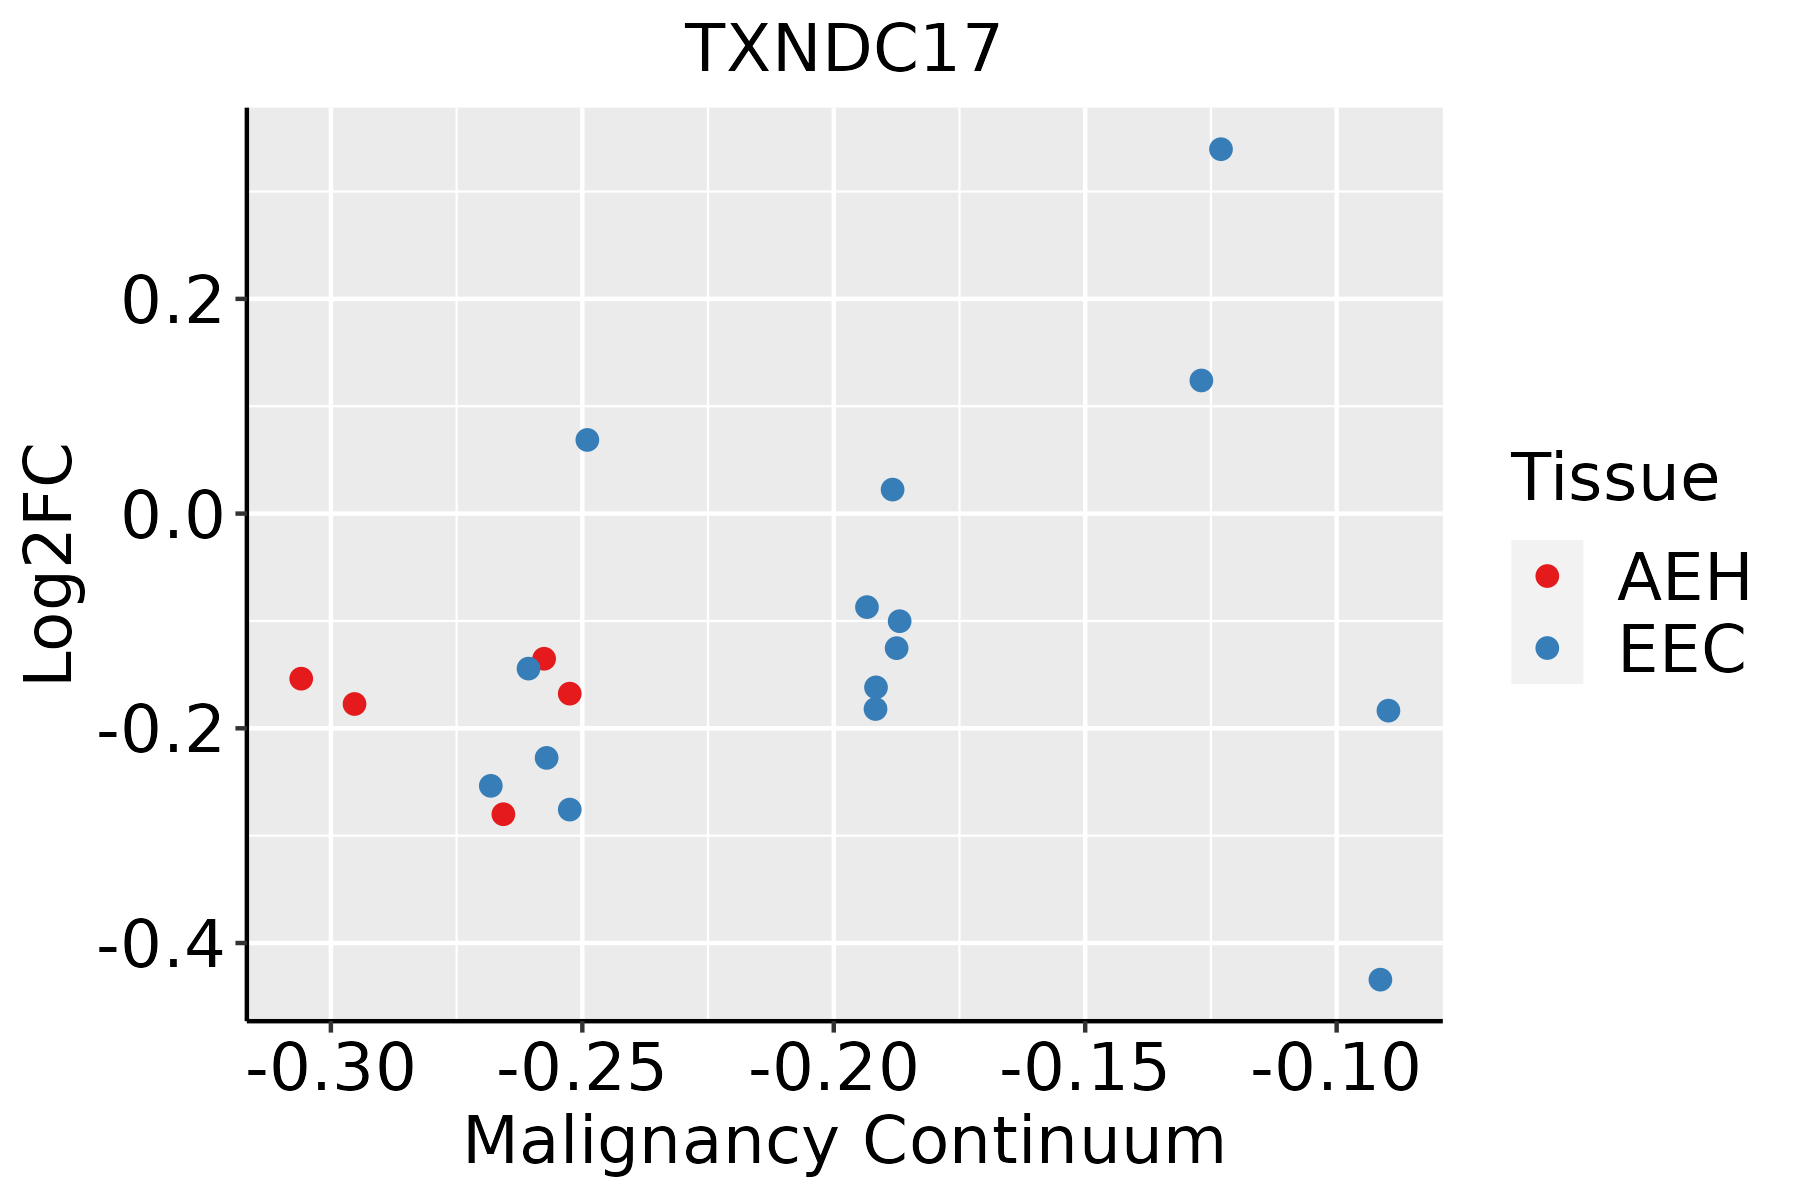 | AEH: Atypical endometrial hyperplasia |
| EEC: Endometrioid Cancer | ||
| Esophagus | 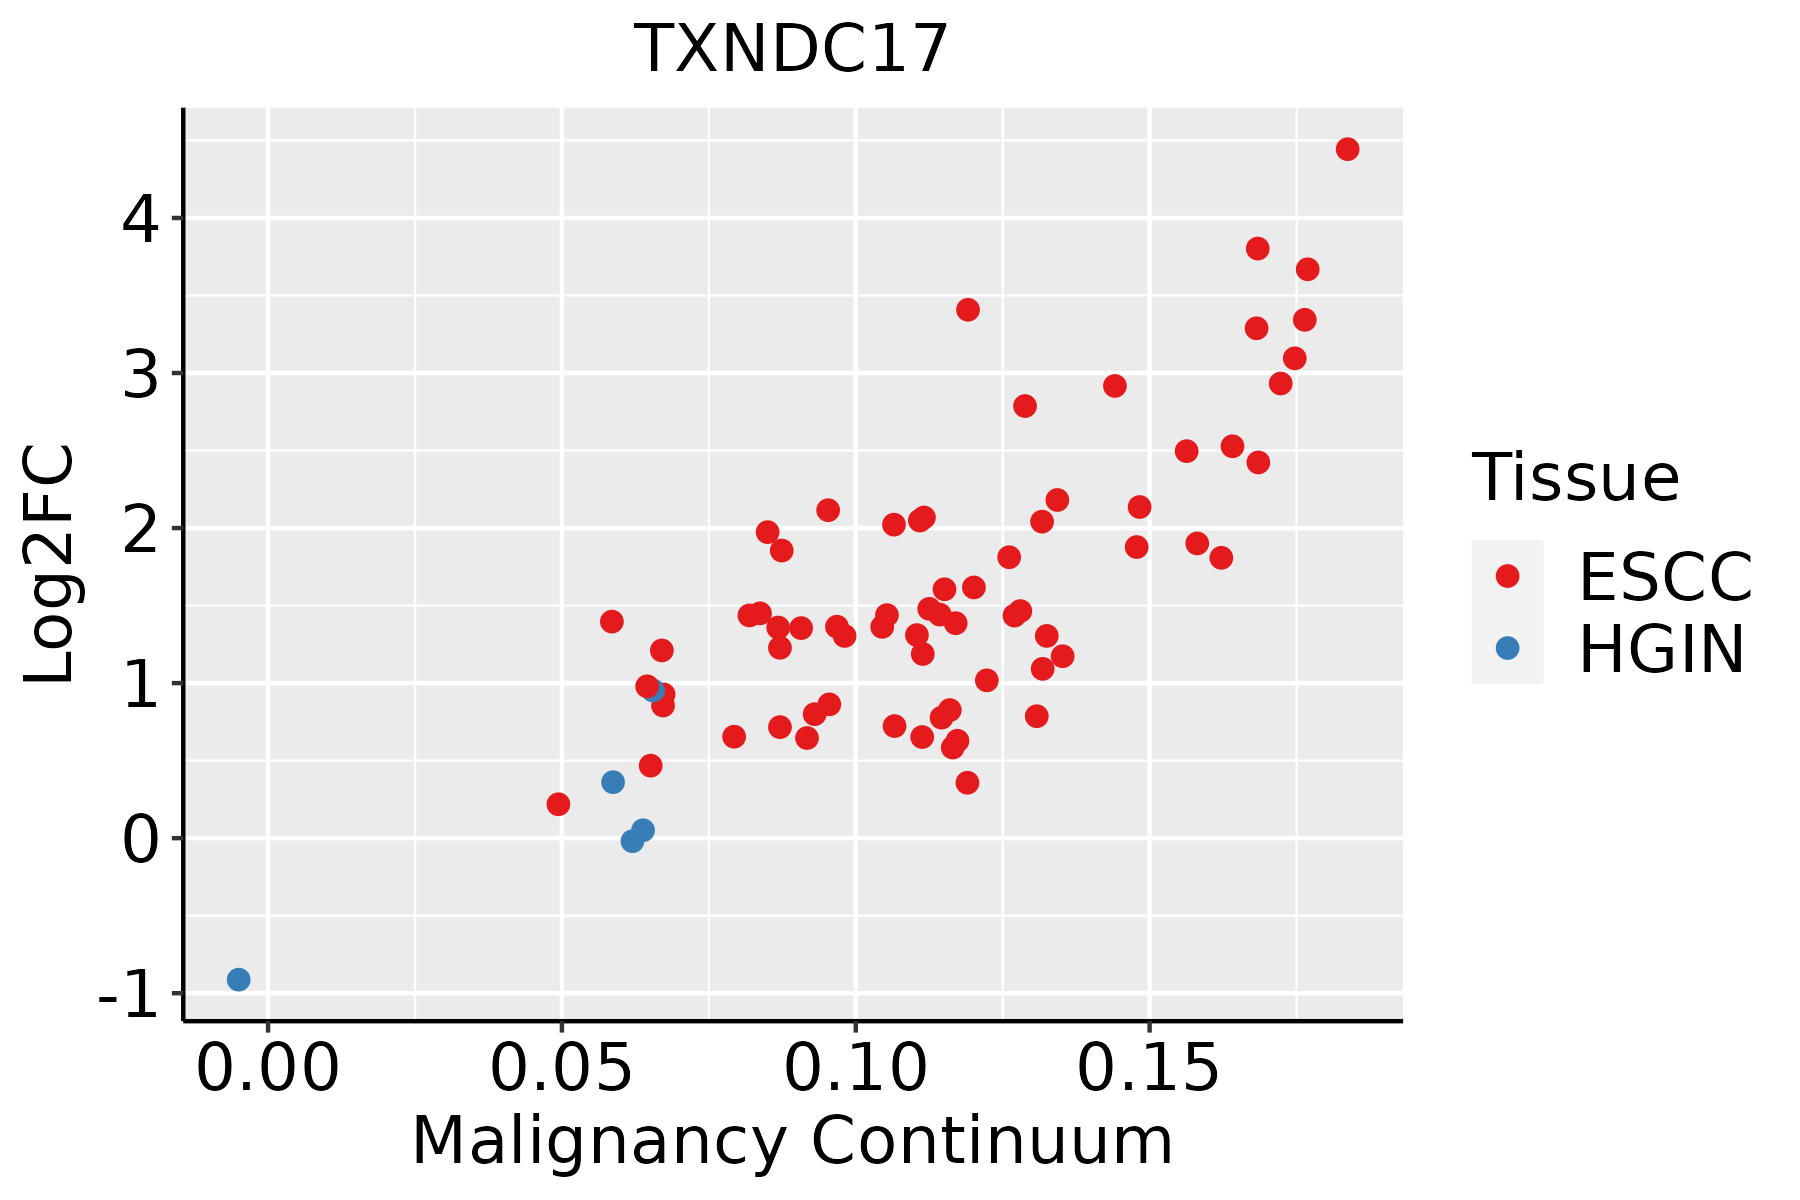 | ESCC: Esophageal squamous cell carcinoma |
| HGIN: High-grade intraepithelial neoplasias | ||
| LGIN: Low-grade intraepithelial neoplasias | ||
| Liver |  | HCC: Hepatocellular carcinoma |
| NAFLD: Non-alcoholic fatty liver disease | ||
| Oral Cavity | 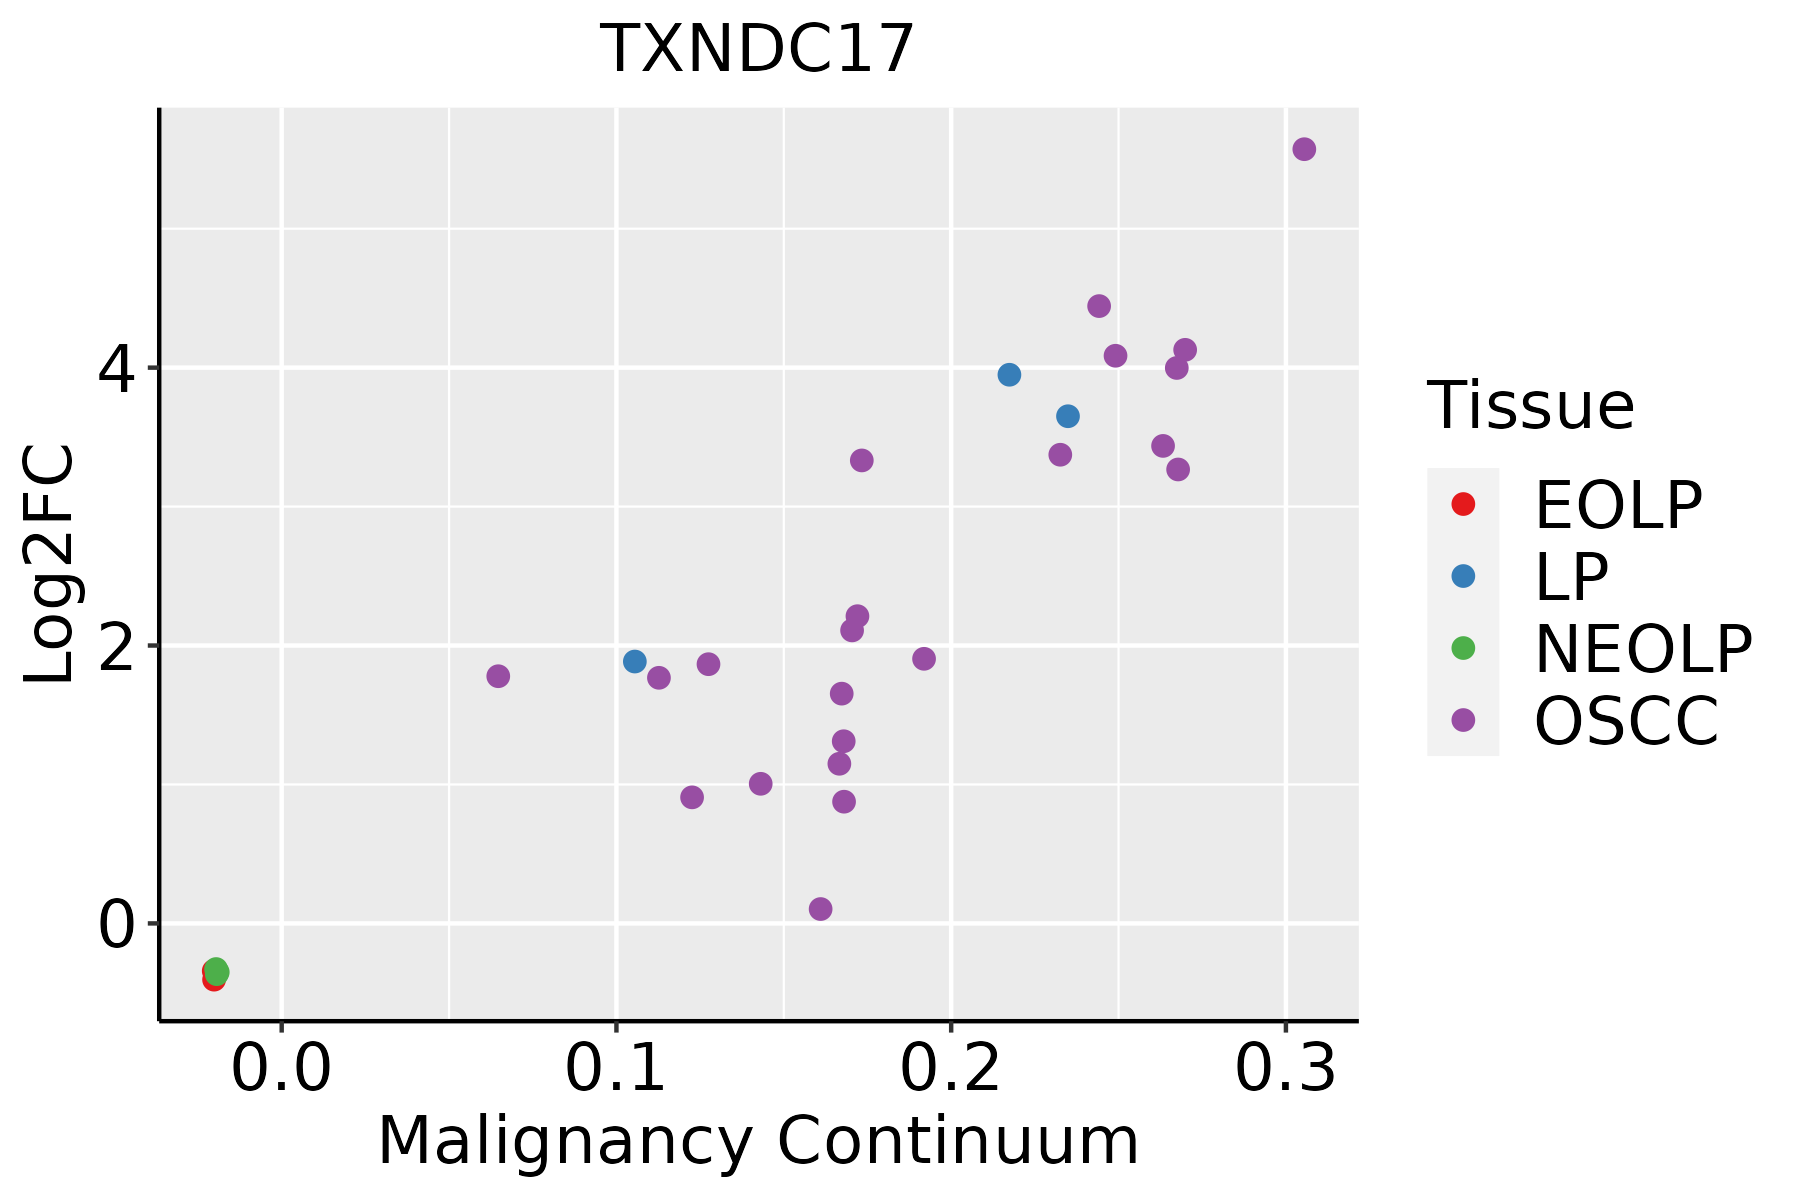 | EOLP: Erosive Oral lichen planus |
| LP: leukoplakia | ||
| NEOLP: Non-erosive oral lichen planus | ||
| OSCC: Oral squamous cell carcinoma | ||
| Prostate |  | BPH: Benign Prostatic Hyperplasia |
| Skin | 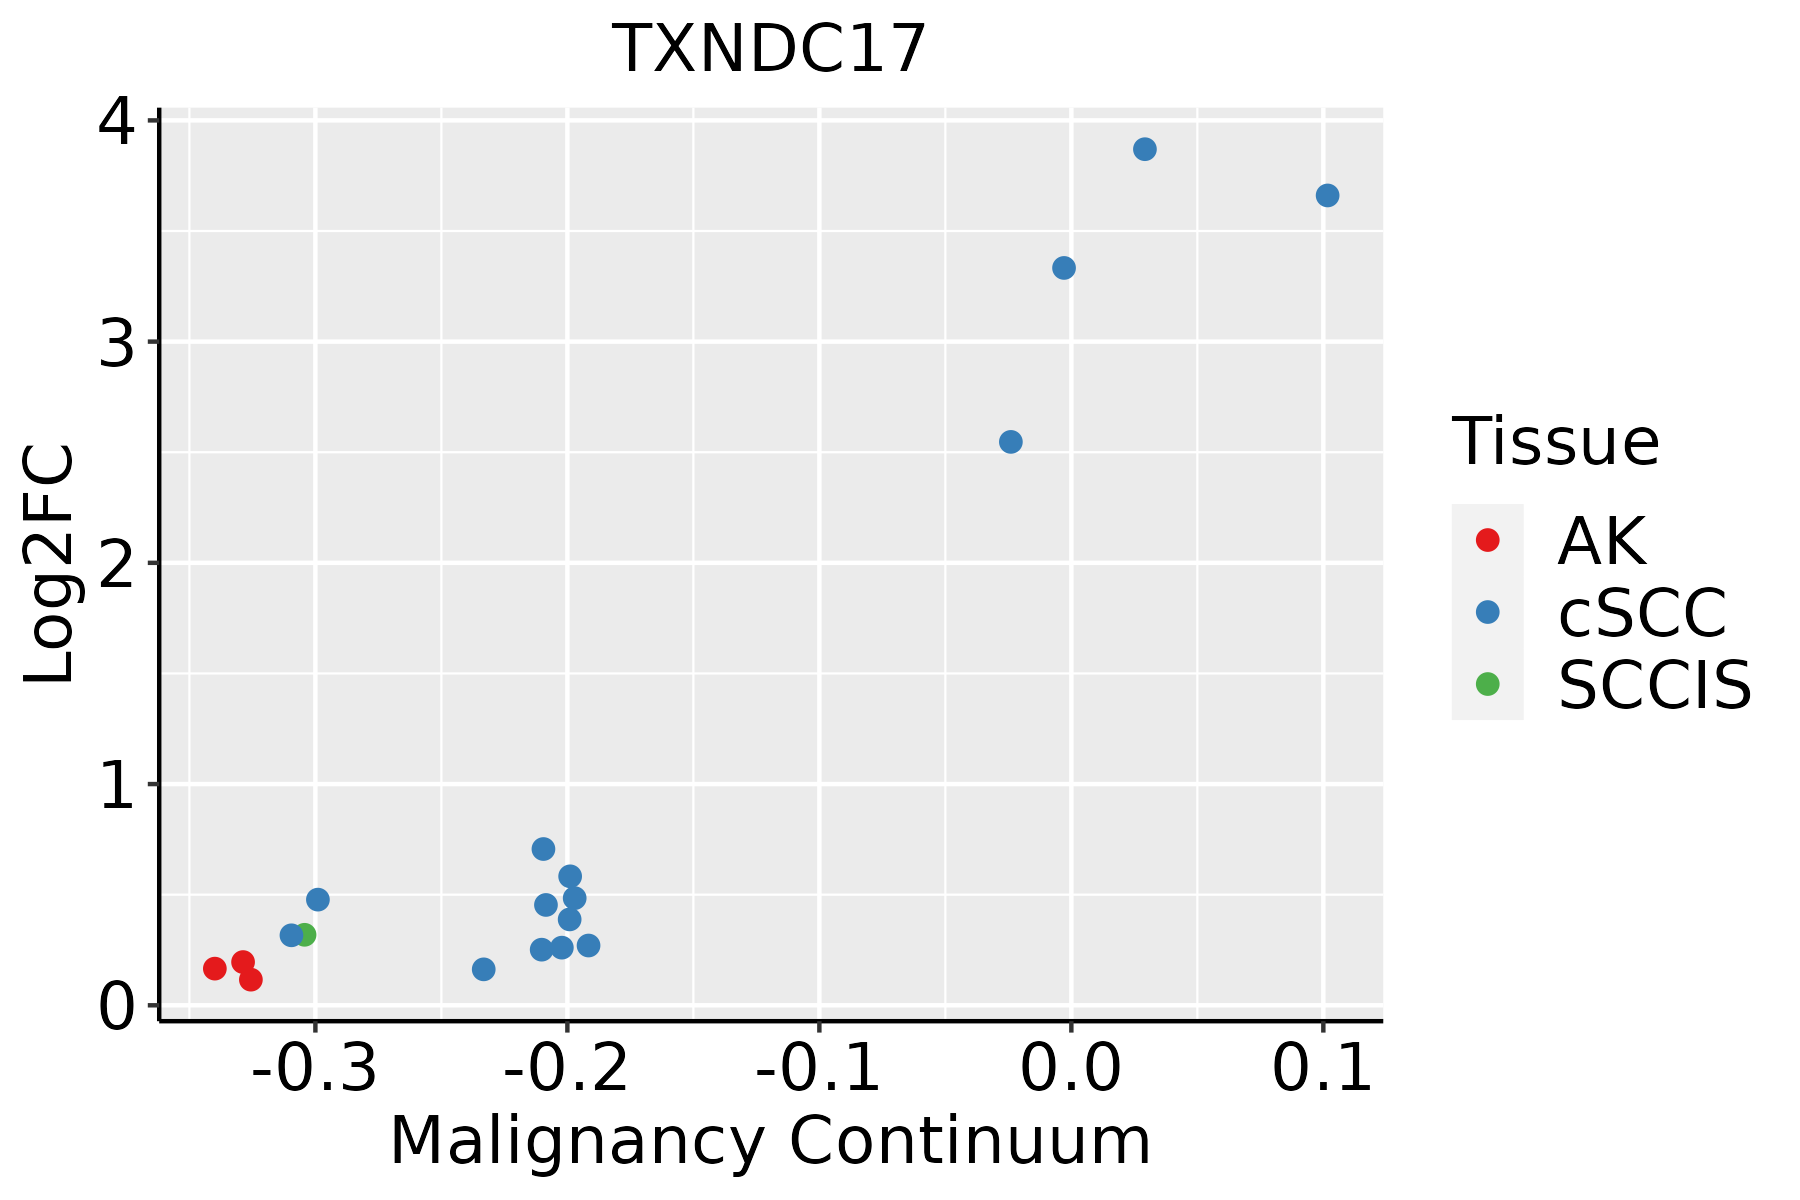 | AK: Actinic keratosis |
| cSCC: Cutaneous squamous cell carcinoma | ||
| SCCIS:squamous cell carcinoma in situ | ||
| Thyroid | 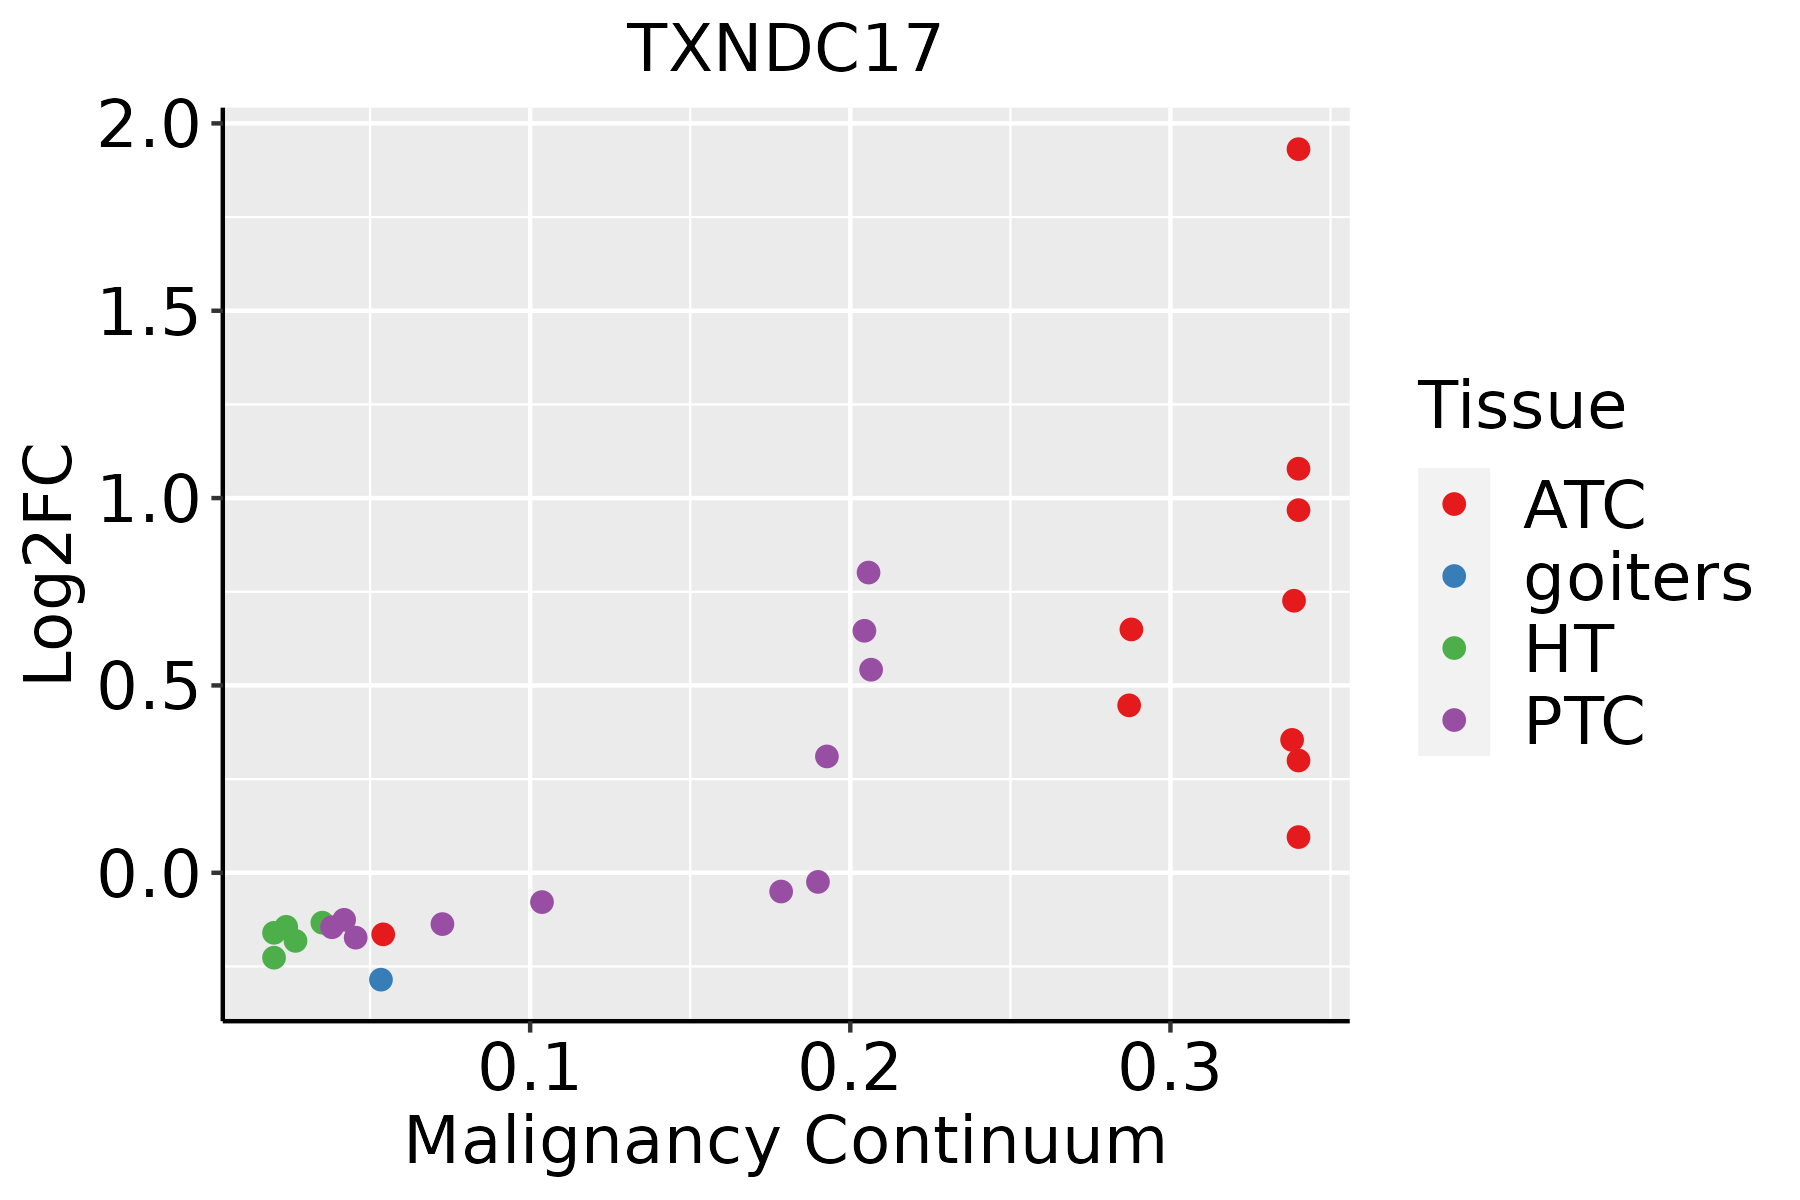 | ATC: Anaplastic thyroid cancer |
| HT: Hashimoto's thyroiditis | ||
| PTC: Papillary thyroid cancer |
| ∗log2FC in expression of this searched gene in stem-like cells from each diseased tissue sample relative to stem-like cells in normal samples in each tissue plotted against the malignancy continuum. Samples are colored based on if they are from different disease stage. |
Top |
Malignant transformation related pathway analysis |
| Find out the enriched GO biological processes and KEGG pathways involved in transition from healthy to precancer to cancer |
| Tissue | Disease Stage | Enriched GO biological Processes |
| Colorectum | AD |  |
| Colorectum | SER |  |
| Colorectum | MSS |  |
| Colorectum | MSI-H |  |
| Colorectum | FAP |  |
| ∗Top 15 enriched GO BP terms are showed in the bar plot of each disease state in each tissue. Each row represents a significant GO biological process which is colored according to the -log10(p.adjust). |
| Page: 1 2 3 4 5 6 7 8 9 |
| GO ID | Tissue | Disease Stage | Description | Gene Ratio | Bg Ratio | pvalue | p.adjust | Count |
| GO:00988698 | Breast | Precancer | cellular oxidant detoxification | 20/1080 | 101/18723 | 1.07e-06 | 4.18e-05 | 20 |
| GO:19907488 | Breast | Precancer | cellular detoxification | 21/1080 | 116/18723 | 2.67e-06 | 8.89e-05 | 21 |
| GO:00987548 | Breast | Precancer | detoxification | 24/1080 | 152/18723 | 6.49e-06 | 1.81e-04 | 24 |
| GO:00972378 | Breast | Precancer | cellular response to toxic substance | 21/1080 | 124/18723 | 7.98e-06 | 2.17e-04 | 21 |
| GO:00096368 | Breast | Precancer | response to toxic substance | 31/1080 | 262/18723 | 1.18e-04 | 2.12e-03 | 31 |
| GO:00713568 | Breast | Precancer | cellular response to tumor necrosis factor | 28/1080 | 229/18723 | 1.42e-04 | 2.45e-03 | 28 |
| GO:00346128 | Breast | Precancer | response to tumor necrosis factor | 29/1080 | 253/18723 | 3.32e-04 | 4.70e-03 | 29 |
| GO:000963613 | Breast | IDC | response to toxic substance | 44/1434 | 262/18723 | 6.33e-07 | 3.00e-05 | 44 |
| GO:009875413 | Breast | IDC | detoxification | 29/1434 | 152/18723 | 3.97e-06 | 1.43e-04 | 29 |
| GO:009886913 | Breast | IDC | cellular oxidant detoxification | 22/1434 | 101/18723 | 6.31e-06 | 1.98e-04 | 22 |
| GO:199074813 | Breast | IDC | cellular detoxification | 23/1434 | 116/18723 | 2.02e-05 | 4.92e-04 | 23 |
| GO:009723713 | Breast | IDC | cellular response to toxic substance | 24/1434 | 124/18723 | 2.05e-05 | 4.97e-04 | 24 |
| GO:007135613 | Breast | IDC | cellular response to tumor necrosis factor | 35/1434 | 229/18723 | 6.64e-05 | 1.35e-03 | 35 |
| GO:003461213 | Breast | IDC | response to tumor necrosis factor | 36/1434 | 253/18723 | 2.29e-04 | 3.64e-03 | 36 |
| GO:000963623 | Breast | DCIS | response to toxic substance | 42/1390 | 262/18723 | 1.76e-06 | 6.56e-05 | 42 |
| GO:009875423 | Breast | DCIS | detoxification | 29/1390 | 152/18723 | 2.15e-06 | 7.79e-05 | 29 |
| GO:009886923 | Breast | DCIS | cellular oxidant detoxification | 22/1390 | 101/18723 | 3.82e-06 | 1.16e-04 | 22 |
| GO:199074823 | Breast | DCIS | cellular detoxification | 23/1390 | 116/18723 | 1.22e-05 | 3.12e-04 | 23 |
| GO:009723723 | Breast | DCIS | cellular response to toxic substance | 24/1390 | 124/18723 | 1.22e-05 | 3.12e-04 | 24 |
| GO:007135622 | Breast | DCIS | cellular response to tumor necrosis factor | 33/1390 | 229/18723 | 1.84e-04 | 3.00e-03 | 33 |
| Page: 1 2 3 4 5 6 7 8 9 |
| Pathway ID | Tissue | Disease Stage | Description | Gene Ratio | Bg Ratio | pvalue | p.adjust | qvalue | Count |
| Page: 1 |
Top |
Cell-cell communication analysis |
| Identification of potential cell-cell interactions between two cell types and their ligand-receptor pairs for different disease states |
| Ligand | Receptor | LRpair | Pathway | Tissue | Disease Stage |
| Page: 1 |
Top |
Single-cell gene regulatory network inference analysis |
| Find out the significant the regulons (TFs) and the target genes of each regulon across cell types for different disease states |
| TF | Cell Type | Tissue | Disease Stage | Target Gene | RSS | Regulon Activity |
| ∗The dot plots of a searched regulon are shown for all cell subpopulations in each disease state of each tissue based on the regulon specific score inferred using pySCENIC and by calculating the average expression. |
| Page: 1 |
Top |
Somatic mutation of malignant transformation related genes |
| Annotation of somatic variants for genes involved in malignant transformation |
| Hugo Symbol | Variant Class | Variant Classification | dbSNP RS | HGVSc | HGVSp | HGVSp Short | SWISSPROT | BIOTYPE | SIFT | PolyPhen | Tumor Sample Barcode | Tissue | Histology | Sex | Age | Stage | Therapy Types | Drugs | Outcome |
| TXNDC17 | SNV | Missense_Mutation | rs751316876 | c.128G>A | p.Cys43Tyr | p.C43Y | Q9BRA2 | protein_coding | deleterious(0) | probably_damaging(1) | TCGA-D5-6930-01 | Colorectum | colon adenocarcinoma | Male | >=65 | I/II | Unknown | Unknown | SD |
| TXNDC17 | insertion | Frame_Shift_Ins | rs753600817 | c.260dupA | p.Asn87LysfsTer12 | p.N87Kfs*12 | Q9BRA2 | protein_coding | TCGA-CM-5861-01 | Colorectum | colon adenocarcinoma | Female | <65 | I/II | Unknown | Unknown | PD | ||
| TXNDC17 | SNV | Missense_Mutation | c.129N>G | p.Cys43Trp | p.C43W | Q9BRA2 | protein_coding | deleterious(0) | probably_damaging(1) | TCGA-BS-A0TA-01 | Endometrium | uterine corpus endometrioid carcinoma | Female | <65 | III/IV | Chemotherapy | taxol | PD | |
| TXNDC17 | SNV | Missense_Mutation | novel | c.353N>G | p.Met118Arg | p.M118R | Q9BRA2 | protein_coding | deleterious(0) | possibly_damaging(0.83) | TCGA-DD-AAC8-01 | Liver | liver hepatocellular carcinoma | Male | >=65 | I/II | Unknown | Unknown | SD |
| Page: 1 |
Top |
Related drugs of malignant transformation related genes |
| Identification of chemicals and drugs interact with genes involved in malignant transfromation |
| (DGIdb 4.0) |
| Entrez ID | Symbol | Category | Interaction Types | Drug Claim Name | Drug Name | PMIDs |
| Page: 1 |

Copyright 2023-Present -The University of Texas Health Science Center at Houston |