
|
|||||
|
 | |
| |
| |
| |
| |
| |
|
Gene: TXNDC11 |
Gene summary for TXNDC11 |
| Gene information | Species | Human | Gene symbol | TXNDC11 | Gene ID | 51061 |
| Gene name | thioredoxin domain containing 11 | |
| Gene Alias | EFP1 | |
| Cytomap | 16p13.13 | |
| Gene Type | protein-coding | GO ID | GO:0005575 | UniProtAcc | Q6PKC3 |
Top |
Malignant transformation analysis |
| Identification of the aberrant gene expression in precancerous and cancerous lesions by comparing the gene expression of stem-like cells in diseased tissues with normal stem cells |
| Entrez ID | Symbol | Replicates | Species | Organ | Tissue | Adj P-value | Log2FC | Malignancy |
| 51061 | TXNDC11 | LZE4T | Human | Esophagus | ESCC | 3.53e-03 | 8.08e-02 | 0.0811 |
| 51061 | TXNDC11 | LZE7T | Human | Esophagus | ESCC | 4.67e-03 | 1.85e-01 | 0.0667 |
| 51061 | TXNDC11 | LZE22T | Human | Esophagus | ESCC | 3.28e-02 | 3.08e-01 | 0.068 |
| 51061 | TXNDC11 | LZE24T | Human | Esophagus | ESCC | 5.20e-12 | 3.51e-01 | 0.0596 |
| 51061 | TXNDC11 | LZE21T | Human | Esophagus | ESCC | 7.30e-07 | 2.84e-01 | 0.0655 |
| 51061 | TXNDC11 | P1T-E | Human | Esophagus | ESCC | 2.17e-11 | 6.94e-01 | 0.0875 |
| 51061 | TXNDC11 | P2T-E | Human | Esophagus | ESCC | 7.83e-32 | 5.69e-01 | 0.1177 |
| 51061 | TXNDC11 | P4T-E | Human | Esophagus | ESCC | 1.74e-12 | 3.56e-01 | 0.1323 |
| 51061 | TXNDC11 | P5T-E | Human | Esophagus | ESCC | 1.13e-14 | 2.41e-01 | 0.1327 |
| 51061 | TXNDC11 | P8T-E | Human | Esophagus | ESCC | 3.31e-19 | 3.79e-01 | 0.0889 |
| 51061 | TXNDC11 | P9T-E | Human | Esophagus | ESCC | 6.54e-12 | 2.51e-01 | 0.1131 |
| 51061 | TXNDC11 | P10T-E | Human | Esophagus | ESCC | 8.18e-16 | 1.52e-01 | 0.116 |
| 51061 | TXNDC11 | P11T-E | Human | Esophagus | ESCC | 1.98e-11 | 6.35e-01 | 0.1426 |
| 51061 | TXNDC11 | P12T-E | Human | Esophagus | ESCC | 4.92e-37 | 5.64e-01 | 0.1122 |
| 51061 | TXNDC11 | P15T-E | Human | Esophagus | ESCC | 8.34e-19 | 3.00e-01 | 0.1149 |
| 51061 | TXNDC11 | P16T-E | Human | Esophagus | ESCC | 2.27e-23 | 3.48e-01 | 0.1153 |
| 51061 | TXNDC11 | P17T-E | Human | Esophagus | ESCC | 2.84e-04 | 1.88e-01 | 0.1278 |
| 51061 | TXNDC11 | P20T-E | Human | Esophagus | ESCC | 1.58e-38 | 1.03e+00 | 0.1124 |
| 51061 | TXNDC11 | P21T-E | Human | Esophagus | ESCC | 1.65e-18 | 2.83e-01 | 0.1617 |
| 51061 | TXNDC11 | P22T-E | Human | Esophagus | ESCC | 6.80e-14 | 2.51e-01 | 0.1236 |
| Page: 1 2 3 4 5 6 |
| Tissue | Expression Dynamics | Abbreviation |
| Esophagus | 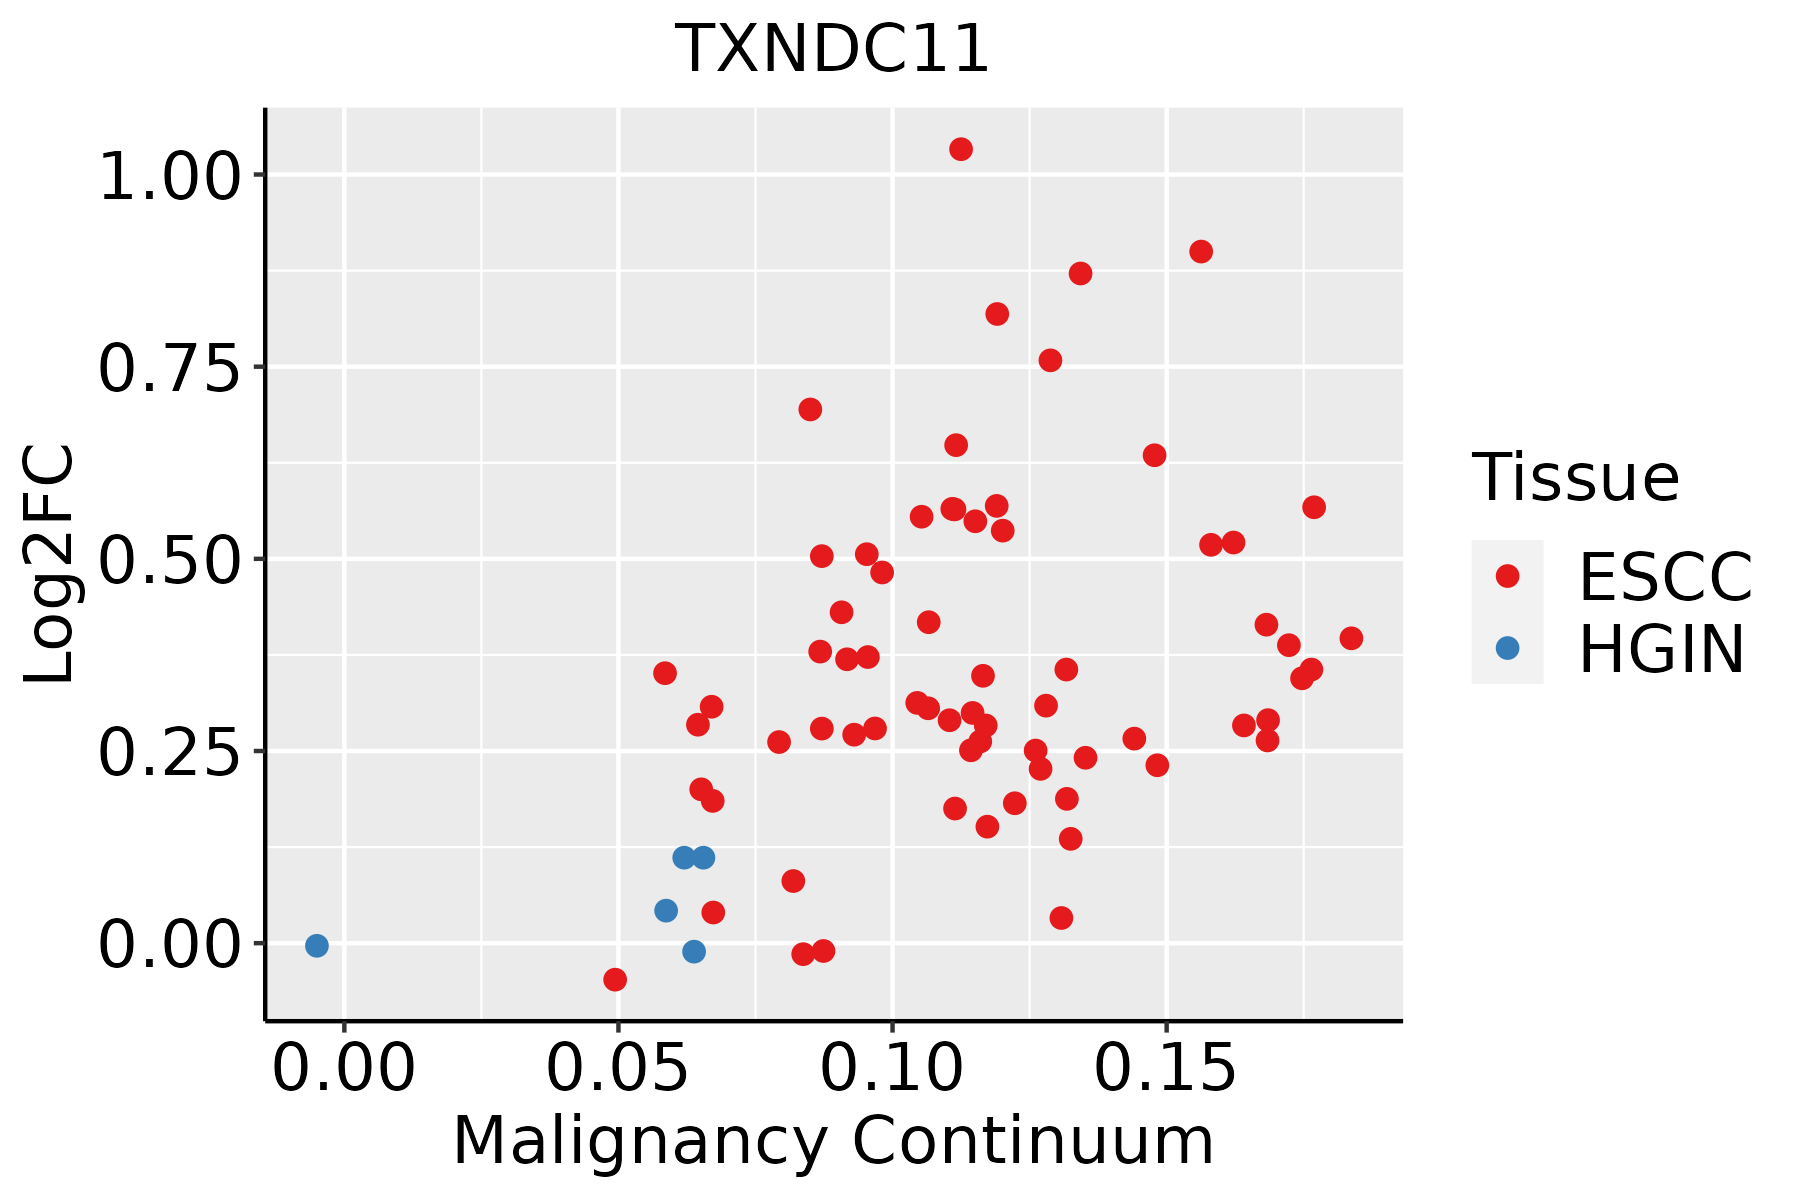 | ESCC: Esophageal squamous cell carcinoma |
| HGIN: High-grade intraepithelial neoplasias | ||
| LGIN: Low-grade intraepithelial neoplasias | ||
| Liver | 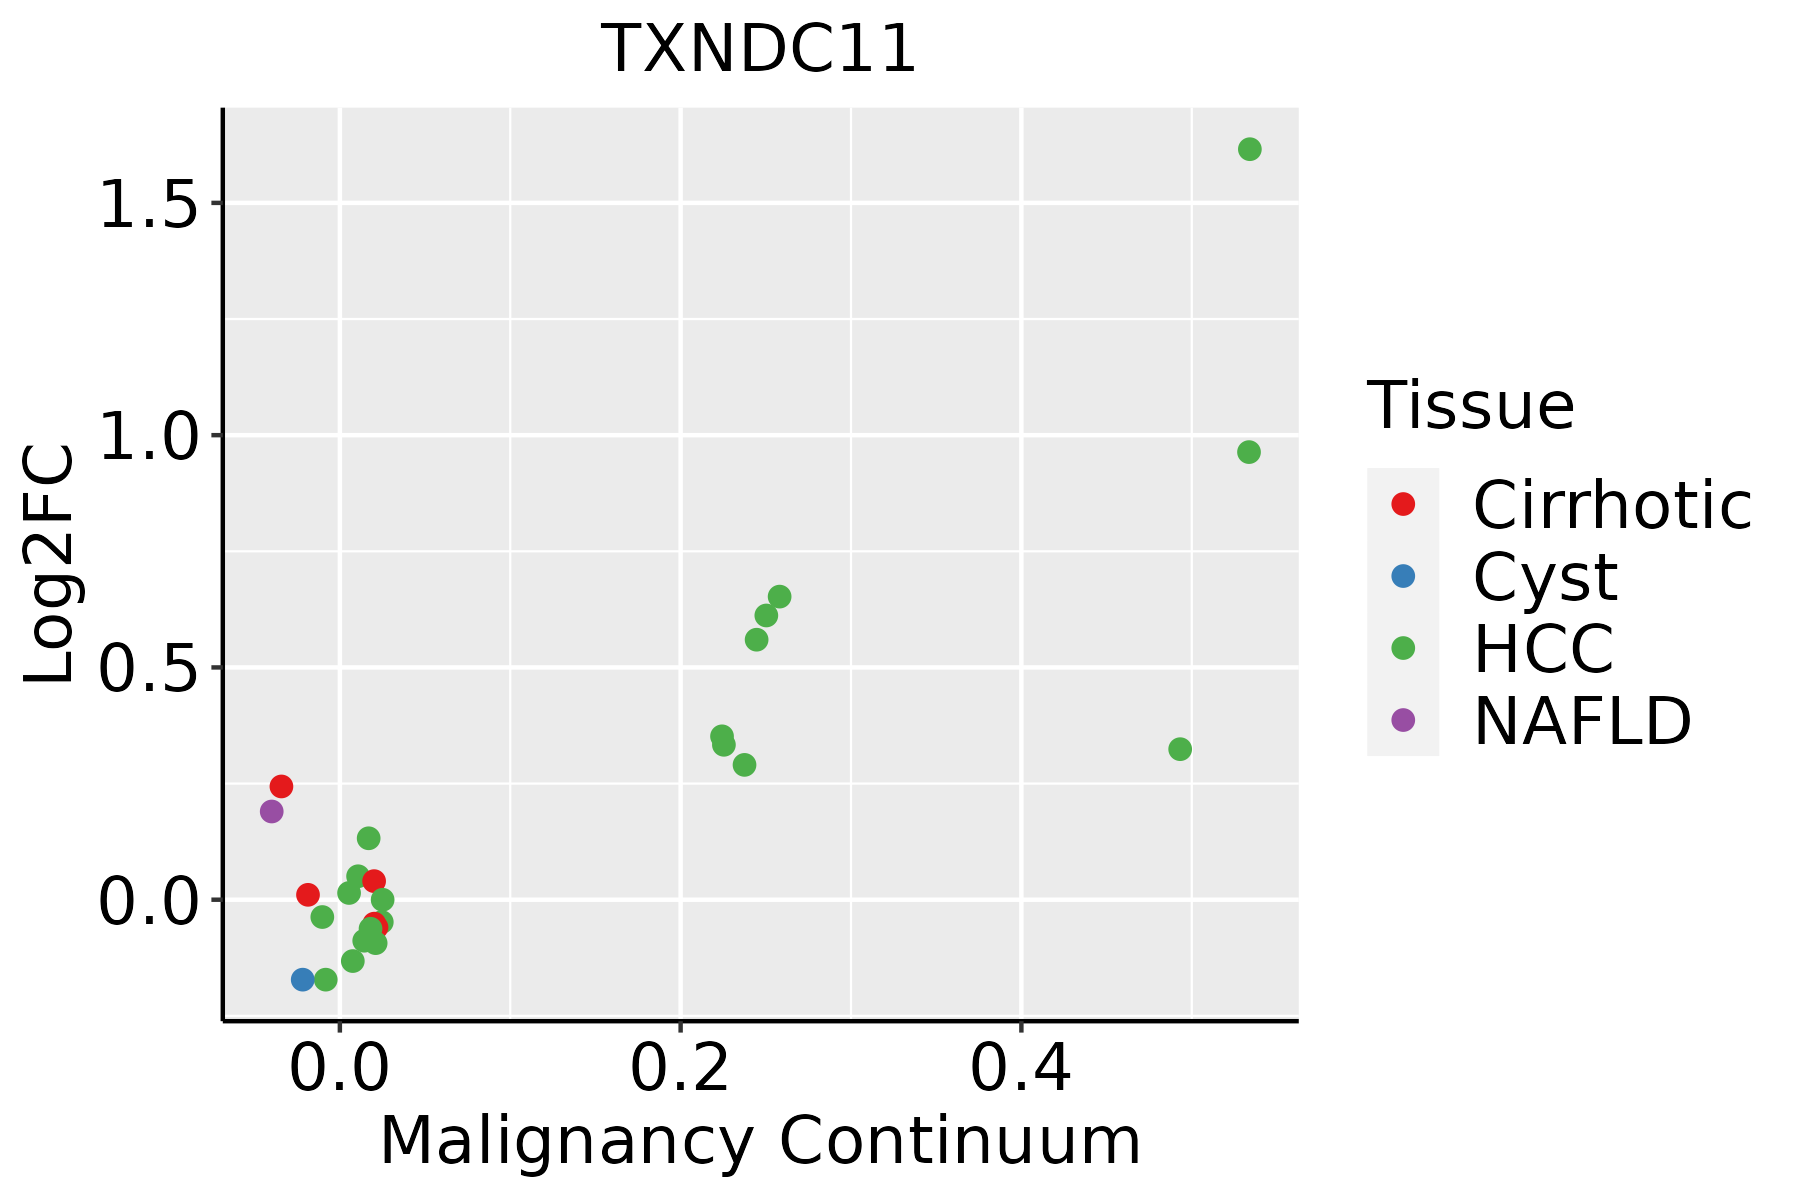 | HCC: Hepatocellular carcinoma |
| NAFLD: Non-alcoholic fatty liver disease | ||
| Lung | 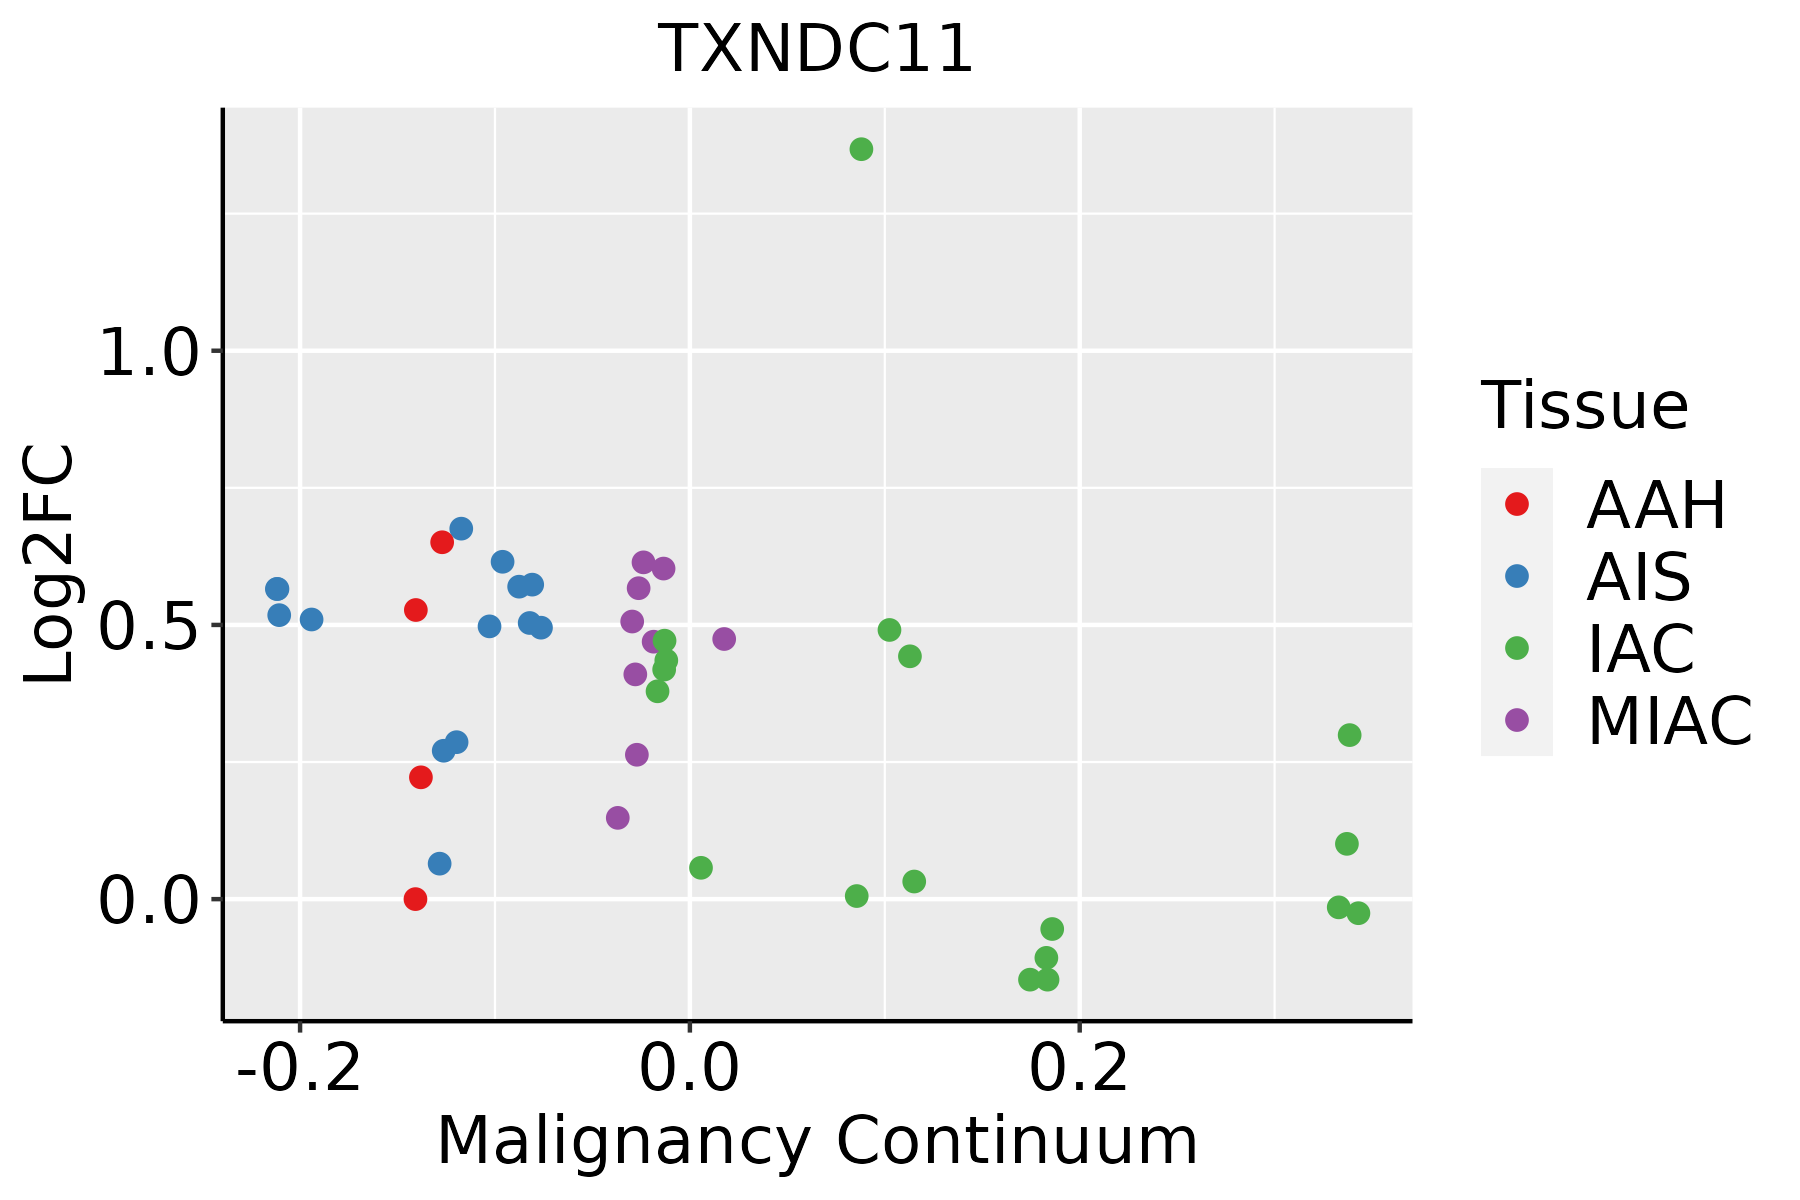 | AAH: Atypical adenomatous hyperplasia |
| AIS: Adenocarcinoma in situ | ||
| IAC: Invasive lung adenocarcinoma | ||
| MIA: Minimally invasive adenocarcinoma | ||
| Oral Cavity |  | EOLP: Erosive Oral lichen planus |
| LP: leukoplakia | ||
| NEOLP: Non-erosive oral lichen planus | ||
| OSCC: Oral squamous cell carcinoma | ||
| Thyroid | 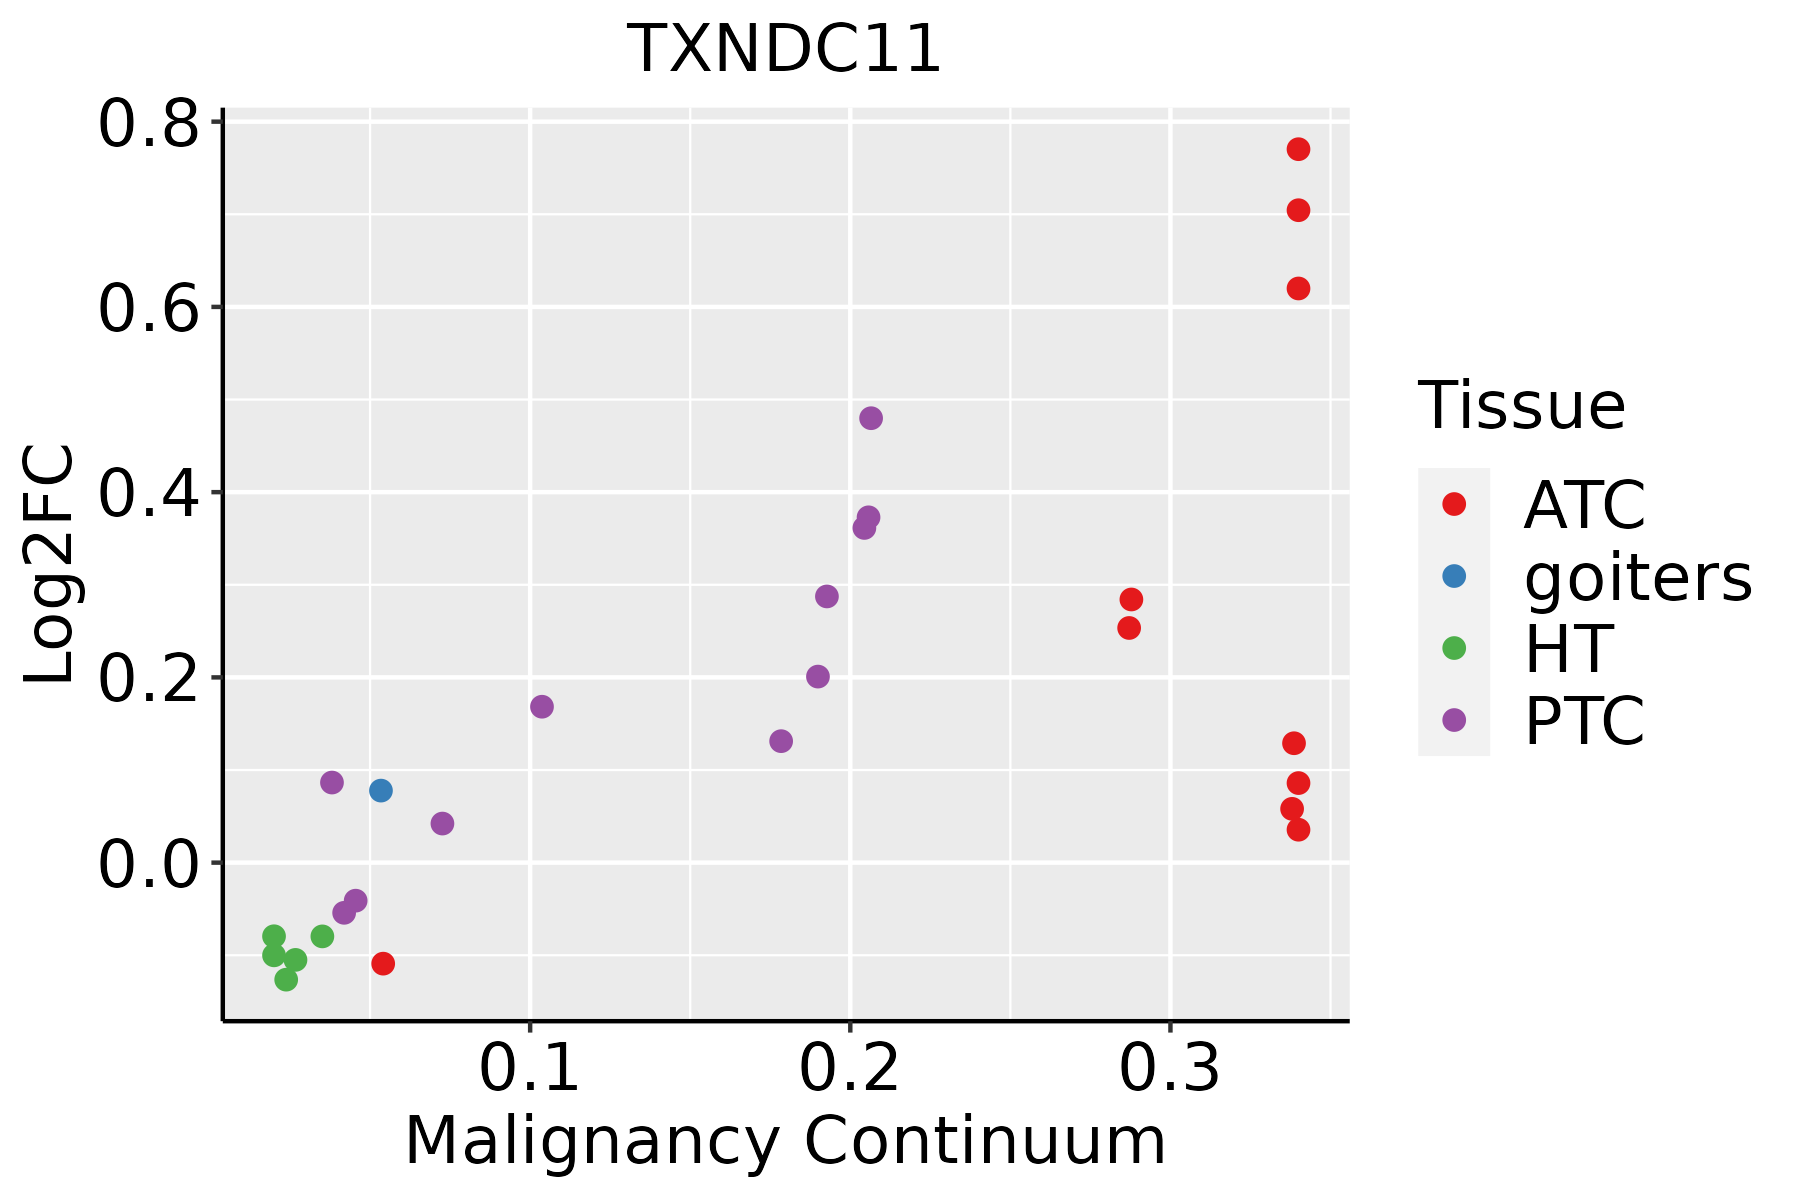 | ATC: Anaplastic thyroid cancer |
| HT: Hashimoto's thyroiditis | ||
| PTC: Papillary thyroid cancer |
| ∗log2FC in expression of this searched gene in stem-like cells from each diseased tissue sample relative to stem-like cells in normal samples in each tissue plotted against the malignancy continuum. Samples are colored based on if they are from different disease stage. |
Top |
Malignant transformation related pathway analysis |
| Find out the enriched GO biological processes and KEGG pathways involved in transition from healthy to precancer to cancer |
| Tissue | Disease Stage | Enriched GO biological Processes |
| Colorectum | AD |  |
| Colorectum | SER |  |
| Colorectum | MSS |  |
| Colorectum | MSI-H |  |
| Colorectum | FAP |  |
| ∗Top 15 enriched GO BP terms are showed in the bar plot of each disease state in each tissue. Each row represents a significant GO biological process which is colored according to the -log10(p.adjust). |
| Page: 1 2 3 4 5 6 7 8 9 |
| GO ID | Tissue | Disease Stage | Description | Gene Ratio | Bg Ratio | pvalue | p.adjust | Count |
| Page: 1 |
| Pathway ID | Tissue | Disease Stage | Description | Gene Ratio | Bg Ratio | pvalue | p.adjust | qvalue | Count |
| Page: 1 |
Top |
Cell-cell communication analysis |
| Identification of potential cell-cell interactions between two cell types and their ligand-receptor pairs for different disease states |
| Ligand | Receptor | LRpair | Pathway | Tissue | Disease Stage |
| Page: 1 |
Top |
Single-cell gene regulatory network inference analysis |
| Find out the significant the regulons (TFs) and the target genes of each regulon across cell types for different disease states |
| TF | Cell Type | Tissue | Disease Stage | Target Gene | RSS | Regulon Activity |
| ∗The dot plots of a searched regulon are shown for all cell subpopulations in each disease state of each tissue based on the regulon specific score inferred using pySCENIC and by calculating the average expression. |
| Page: 1 |
Top |
Somatic mutation of malignant transformation related genes |
| Annotation of somatic variants for genes involved in malignant transformation |
| Hugo Symbol | Variant Class | Variant Classification | dbSNP RS | HGVSc | HGVSp | HGVSp Short | SWISSPROT | BIOTYPE | SIFT | PolyPhen | Tumor Sample Barcode | Tissue | Histology | Sex | Age | Stage | Therapy Types | Drugs | Outcome |
| TXNDC11 | SNV | Missense_Mutation | c.1148C>A | p.Pro383His | p.P383H | Q6PKC3 | protein_coding | deleterious(0) | probably_damaging(0.994) | TCGA-A8-A06Y-01 | Breast | breast invasive carcinoma | Female | >=65 | I/II | Hormone Therapy | anastrozole | PD | |
| TXNDC11 | SNV | Missense_Mutation | rs772605203 | c.2558N>T | p.Ser853Phe | p.S853F | Q6PKC3 | protein_coding | tolerated(0.1) | benign(0.097) | TCGA-A8-A09Z-01 | Breast | breast invasive carcinoma | Female | >=65 | I/II | Unknown | Unknown | SD |
| TXNDC11 | SNV | Missense_Mutation | novel | c.1999T>G | p.Phe667Val | p.F667V | Q6PKC3 | protein_coding | deleterious(0) | benign(0.178) | TCGA-AC-A62X-01 | Breast | breast invasive carcinoma | Female | >=65 | I/II | Unknown | Unknown | SD |
| TXNDC11 | SNV | Missense_Mutation | c.1357N>G | p.Thr453Ala | p.T453A | Q6PKC3 | protein_coding | deleterious(0.01) | benign(0.146) | TCGA-AO-A128-01 | Breast | breast invasive carcinoma | Female | <65 | I/II | Chemotherapy | doxorubicin | SD | |
| TXNDC11 | SNV | Missense_Mutation | rs747981331 | c.2597N>A | p.Arg866Gln | p.R866Q | Q6PKC3 | protein_coding | tolerated(0.43) | benign(0) | TCGA-AR-A0TQ-01 | Breast | breast invasive carcinoma | Female | <65 | III/IV | Chemotherapy | doxorubicin | SD |
| TXNDC11 | SNV | Missense_Mutation | c.1162N>A | p.Ala388Thr | p.A388T | Q6PKC3 | protein_coding | tolerated(0.15) | benign(0.021) | TCGA-D8-A1J8-01 | Breast | breast invasive carcinoma | Female | >=65 | I/II | Hormone Therapy | nolvadex | SD | |
| TXNDC11 | SNV | Missense_Mutation | novel | c.1145N>G | p.Ile382Arg | p.I382R | Q6PKC3 | protein_coding | deleterious(0.01) | benign(0.352) | TCGA-D8-A3Z6-01 | Breast | breast invasive carcinoma | Female | <65 | III/IV | Chemotherapy | cyclophosphane | SD |
| TXNDC11 | insertion | Frame_Shift_Ins | novel | c.1574_1575insGTTCCTCACATTGAGGAGAACAGGTATCTCTTTCCAGAAGTGG | p.Tyr526PhefsTer16 | p.Y526Ffs*16 | Q6PKC3 | protein_coding | TCGA-BH-A0B1-01 | Breast | breast invasive carcinoma | Female | >=65 | I/II | Chemotherapy | adriamycin | SD | ||
| TXNDC11 | insertion | Nonsense_Mutation | novel | c.2494_2495insAGTTCTGAAACGTGAGGGGATGGATCACACGCCCCAGCCTTTTCT | p.Arg832delinsLysPheTerAsnValArgGlyTrpIleThrArgProSerLeuPheTer | p.R832delinsKF*NVRGWITRPSLF* | Q6PKC3 | protein_coding | TCGA-BH-A0B8-01 | Breast | breast invasive carcinoma | Female | <65 | I/II | Hormone Therapy | arimidex | SD | ||
| TXNDC11 | SNV | Missense_Mutation | novel | c.2771T>C | p.Leu924Pro | p.L924P | Q6PKC3 | protein_coding | deleterious(0) | probably_damaging(0.998) | TCGA-2W-A8YY-01 | Cervix | cervical & endocervical cancer | Female | <65 | I/II | Chemotherapy | cisplatin | CR |
| Page: 1 2 3 4 5 6 7 8 |
Top |
Related drugs of malignant transformation related genes |
| Identification of chemicals and drugs interact with genes involved in malignant transfromation |
| (DGIdb 4.0) |
| Entrez ID | Symbol | Category | Interaction Types | Drug Claim Name | Drug Name | PMIDs |
| 51061 | TXNDC11 | DRUGGABLE GENOME, THIOREDOXIN | hydrochlorothiazide | HYDROCHLOROTHIAZIDE |
| Page: 1 |

Copyright 2023-Present -The University of Texas Health Science Center at Houston |