
|
|||||
|
 | |
| |
| |
| |
| |
| |
|
Gene: TXN2 |
Gene summary for TXN2 |
| Gene information | Species | Human | Gene symbol | TXN2 | Gene ID | 25828 |
| Gene name | thioredoxin 2 | |
| Gene Alias | COXPD29 | |
| Cytomap | 22q12.3 | |
| Gene Type | protein-coding | GO ID | GO:0001666 | UniProtAcc | Q99757 |
Top |
Malignant transformation analysis |
| Identification of the aberrant gene expression in precancerous and cancerous lesions by comparing the gene expression of stem-like cells in diseased tissues with normal stem cells |
| Entrez ID | Symbol | Replicates | Species | Organ | Tissue | Adj P-value | Log2FC | Malignancy |
| 25828 | TXN2 | HTA11_3410_2000001011 | Human | Colorectum | AD | 4.31e-09 | 3.67e-01 | 0.0155 |
| 25828 | TXN2 | HTA11_2487_2000001011 | Human | Colorectum | SER | 1.66e-08 | 5.73e-01 | -0.1808 |
| 25828 | TXN2 | HTA11_1938_2000001011 | Human | Colorectum | AD | 4.67e-09 | 7.05e-01 | -0.0811 |
| 25828 | TXN2 | HTA11_347_2000001011 | Human | Colorectum | AD | 6.83e-26 | 6.65e-01 | -0.1954 |
| 25828 | TXN2 | HTA11_411_2000001011 | Human | Colorectum | SER | 9.79e-11 | 9.65e-01 | -0.2602 |
| 25828 | TXN2 | HTA11_3361_2000001011 | Human | Colorectum | AD | 4.20e-06 | 5.17e-01 | -0.1207 |
| 25828 | TXN2 | HTA11_83_2000001011 | Human | Colorectum | SER | 1.11e-06 | 5.85e-01 | -0.1526 |
| 25828 | TXN2 | HTA11_696_2000001011 | Human | Colorectum | AD | 6.85e-28 | 7.56e-01 | -0.1464 |
| 25828 | TXN2 | HTA11_866_2000001011 | Human | Colorectum | AD | 2.28e-09 | 3.88e-01 | -0.1001 |
| 25828 | TXN2 | HTA11_1391_2000001011 | Human | Colorectum | AD | 8.12e-19 | 7.31e-01 | -0.059 |
| 25828 | TXN2 | HTA11_2992_2000001011 | Human | Colorectum | SER | 2.68e-04 | 5.97e-01 | -0.1706 |
| 25828 | TXN2 | HTA11_5216_2000001011 | Human | Colorectum | SER | 3.74e-05 | 6.56e-01 | -0.1462 |
| 25828 | TXN2 | HTA11_9341_2000001011 | Human | Colorectum | SER | 3.57e-02 | 4.88e-01 | -0.00410000000000005 |
| 25828 | TXN2 | HTA11_866_3004761011 | Human | Colorectum | AD | 1.43e-13 | 6.16e-01 | 0.096 |
| 25828 | TXN2 | HTA11_4255_2000001011 | Human | Colorectum | SER | 7.74e-08 | 7.16e-01 | 0.0446 |
| 25828 | TXN2 | HTA11_8622_2000001021 | Human | Colorectum | SER | 2.03e-02 | 4.46e-01 | 0.0528 |
| 25828 | TXN2 | HTA11_7663_2000001011 | Human | Colorectum | SER | 1.52e-03 | 5.85e-01 | 0.0131 |
| 25828 | TXN2 | HTA11_10623_2000001011 | Human | Colorectum | AD | 1.61e-09 | 6.78e-01 | -0.0177 |
| 25828 | TXN2 | HTA11_6801_2000001011 | Human | Colorectum | SER | 8.45e-03 | 5.16e-01 | 0.0171 |
| 25828 | TXN2 | HTA11_10711_2000001011 | Human | Colorectum | AD | 3.04e-07 | 5.43e-01 | 0.0338 |
| Page: 1 2 3 4 5 6 7 8 9 10 |
| Tissue | Expression Dynamics | Abbreviation |
| Colorectum (GSE201348) |  | FAP: Familial adenomatous polyposis |
| CRC: Colorectal cancer | ||
| Colorectum (HTA11) |  | AD: Adenomas |
| SER: Sessile serrated lesions | ||
| MSI-H: Microsatellite-high colorectal cancer | ||
| MSS: Microsatellite stable colorectal cancer | ||
| Endometrium | 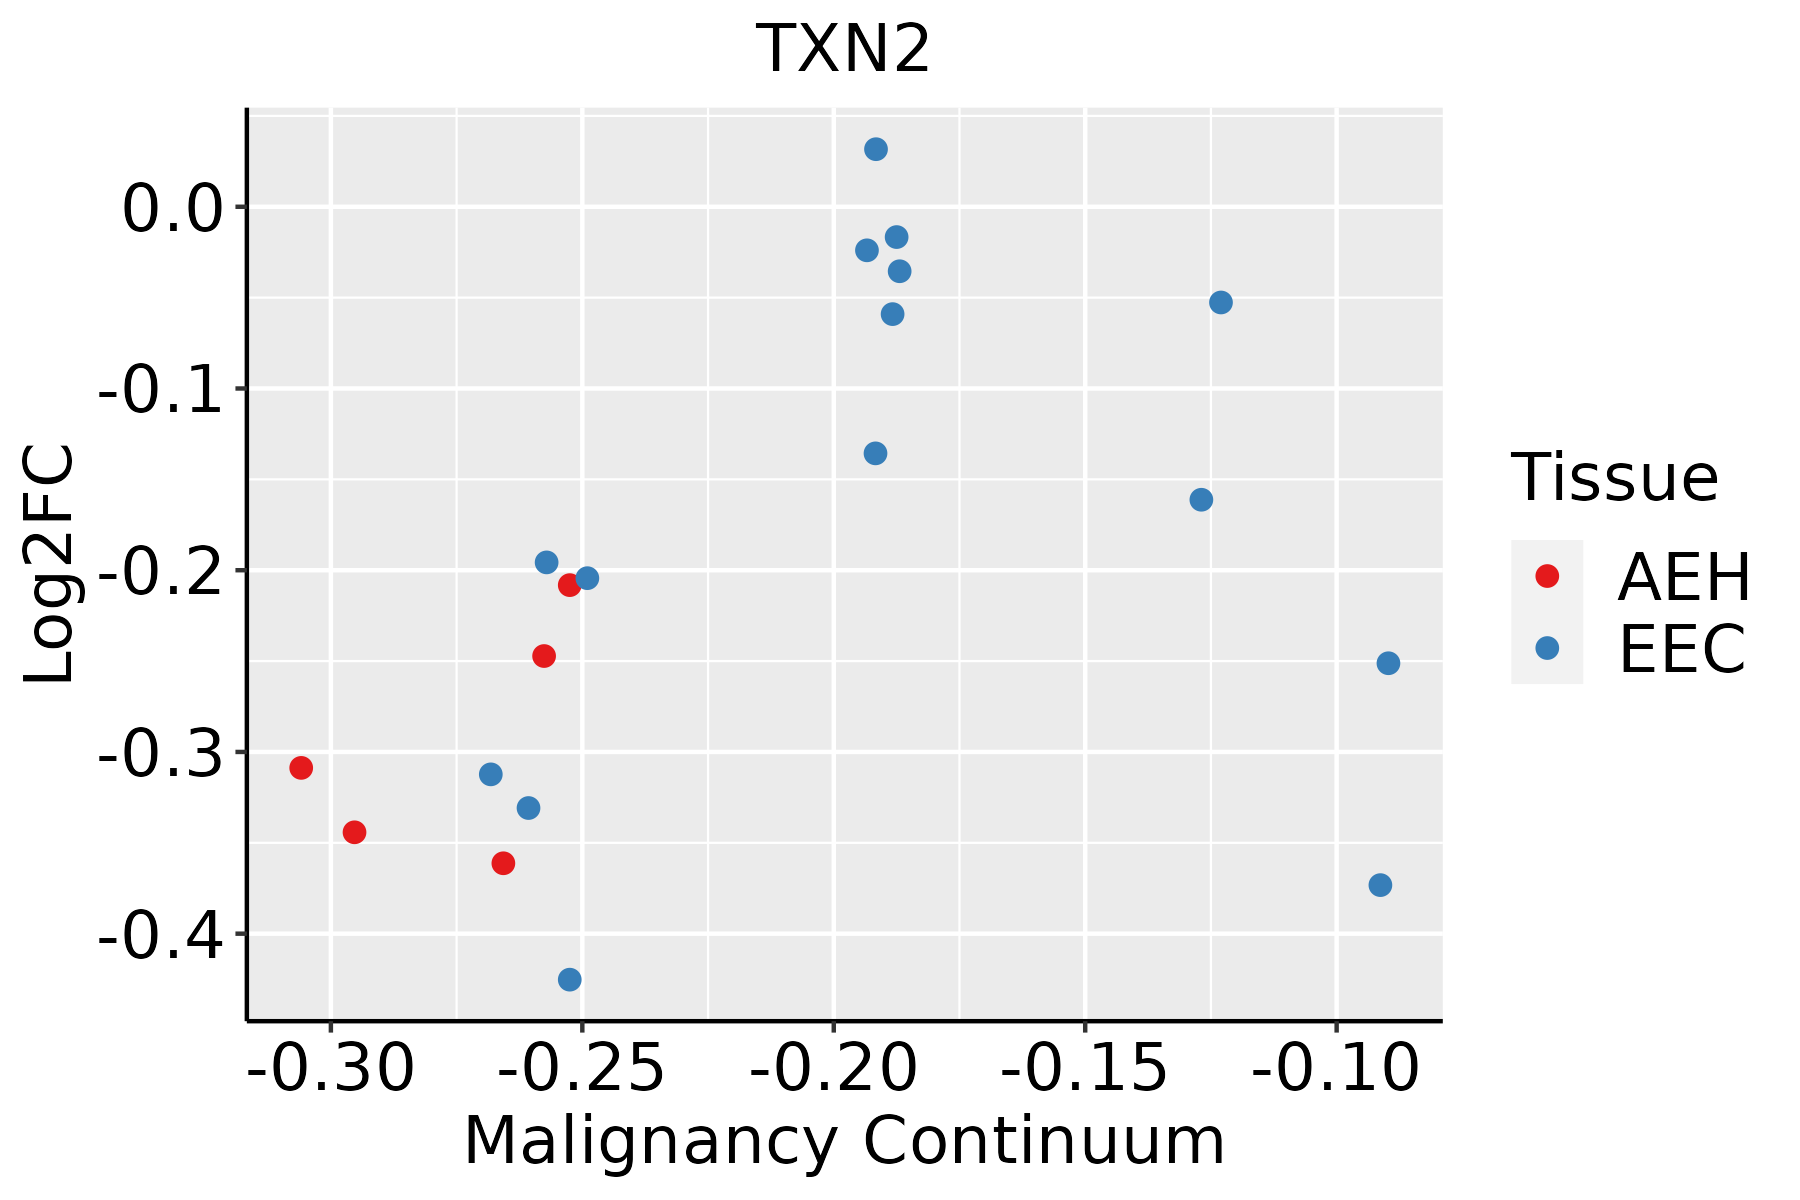 | AEH: Atypical endometrial hyperplasia |
| EEC: Endometrioid Cancer | ||
| Esophagus | 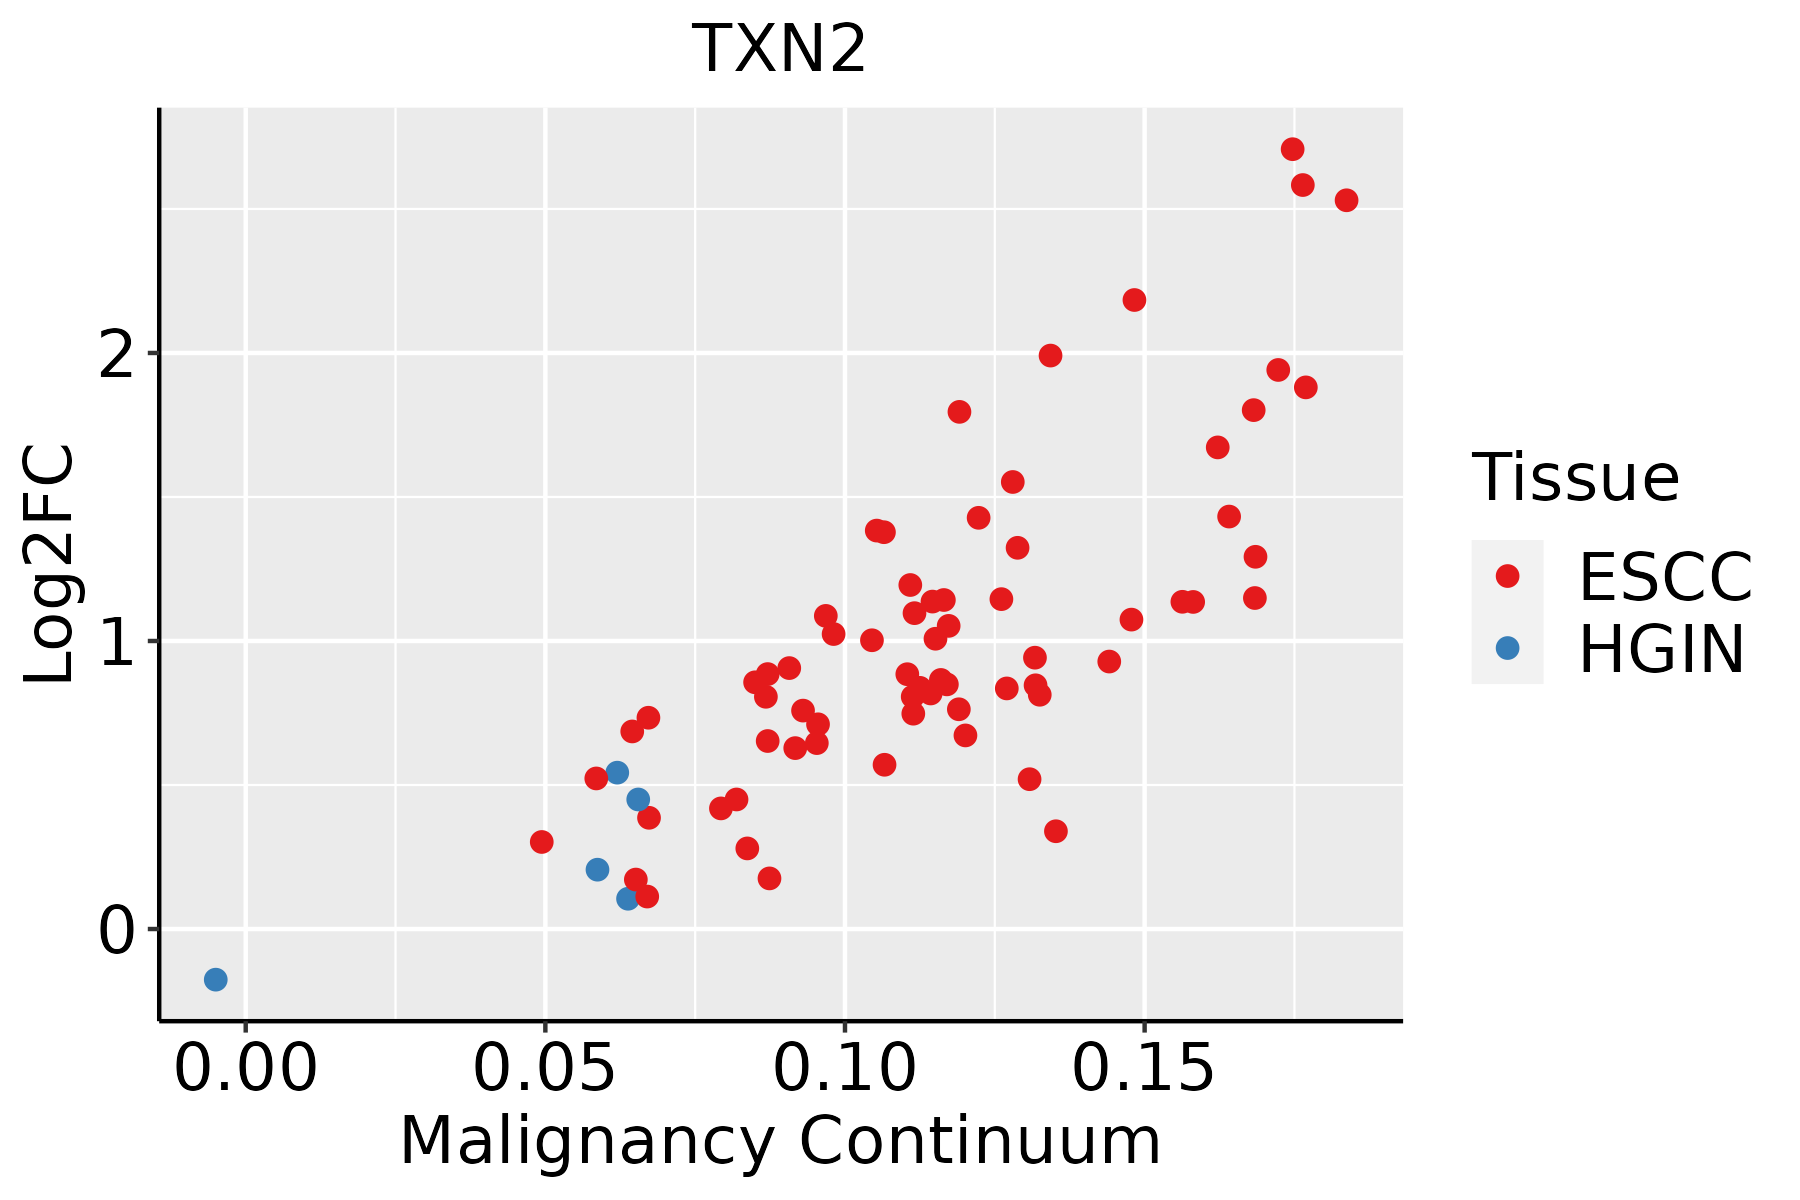 | ESCC: Esophageal squamous cell carcinoma |
| HGIN: High-grade intraepithelial neoplasias | ||
| LGIN: Low-grade intraepithelial neoplasias | ||
| Liver | 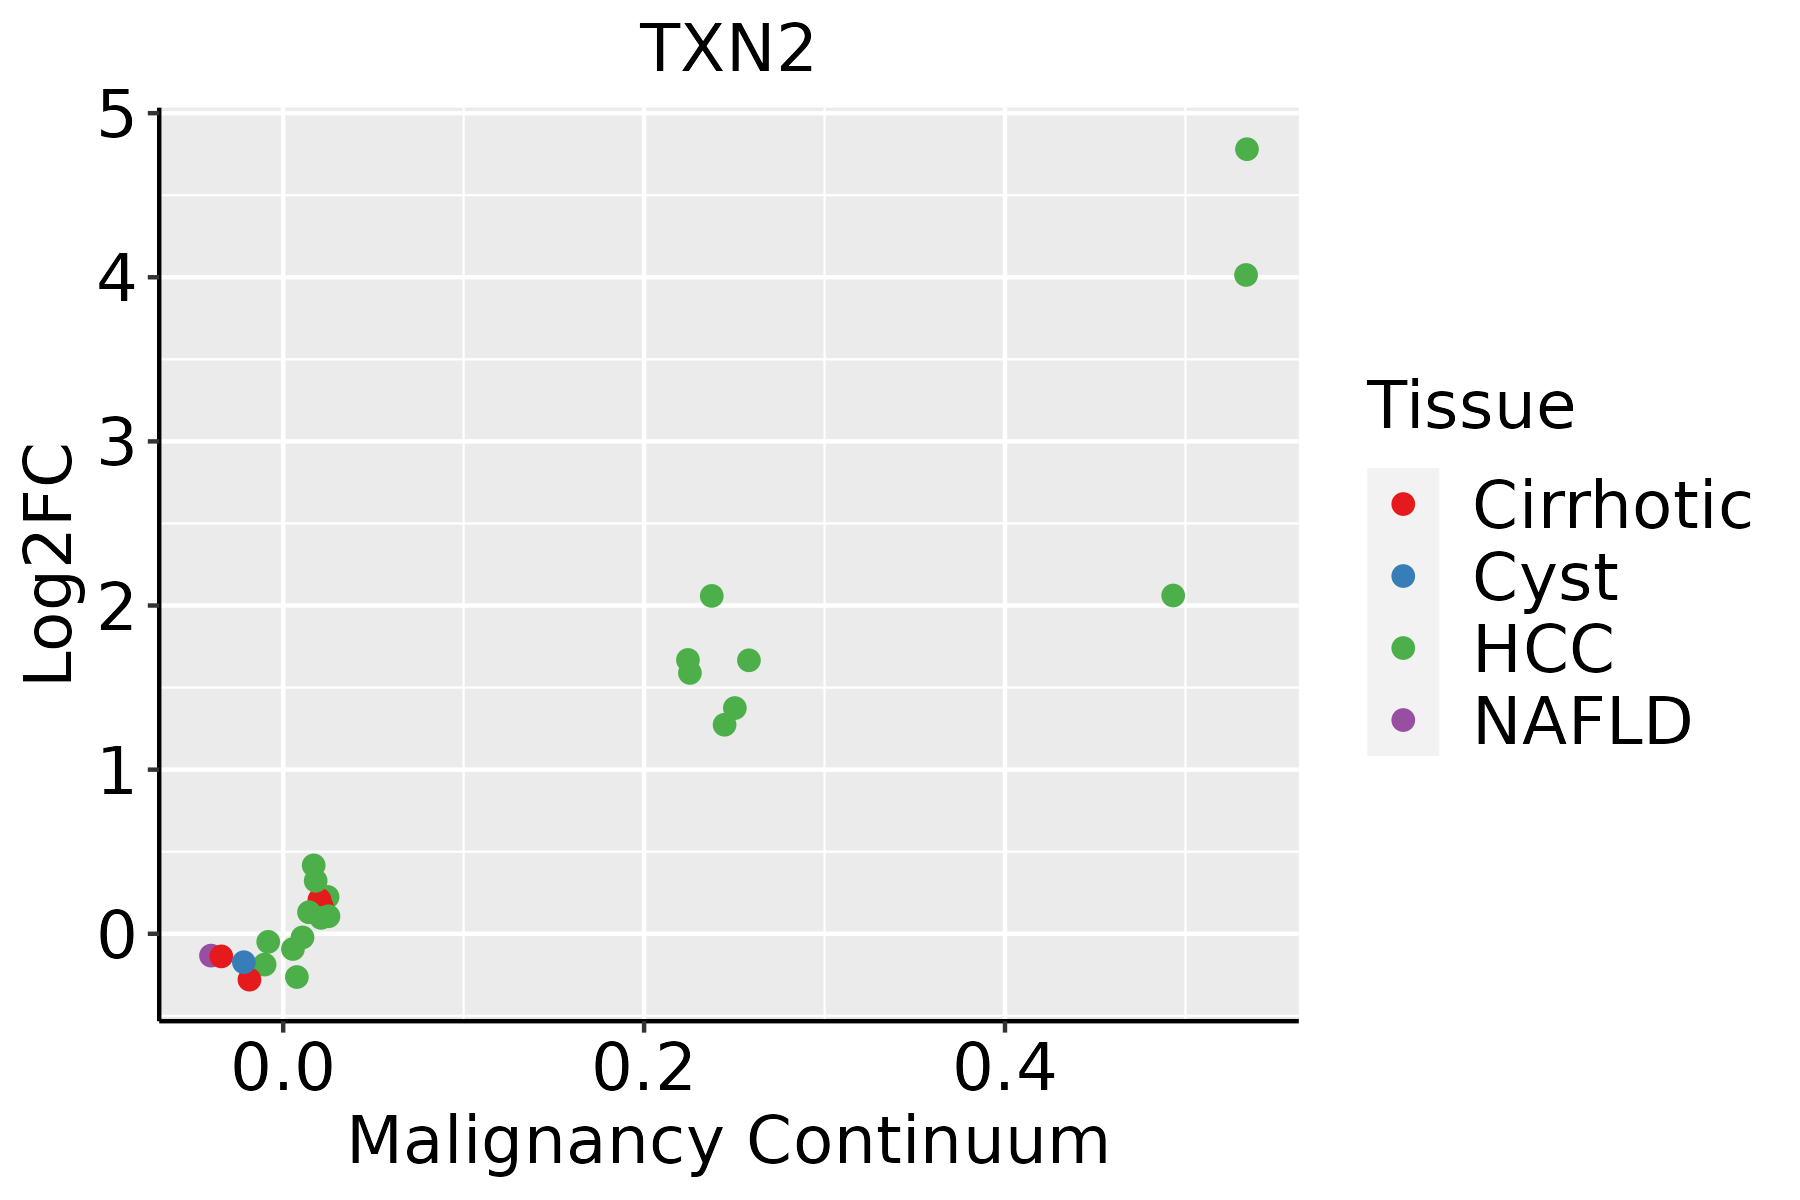 | HCC: Hepatocellular carcinoma |
| NAFLD: Non-alcoholic fatty liver disease | ||
| Oral Cavity |  | EOLP: Erosive Oral lichen planus |
| LP: leukoplakia | ||
| NEOLP: Non-erosive oral lichen planus | ||
| OSCC: Oral squamous cell carcinoma | ||
| Prostate |  | BPH: Benign Prostatic Hyperplasia |
| Skin | 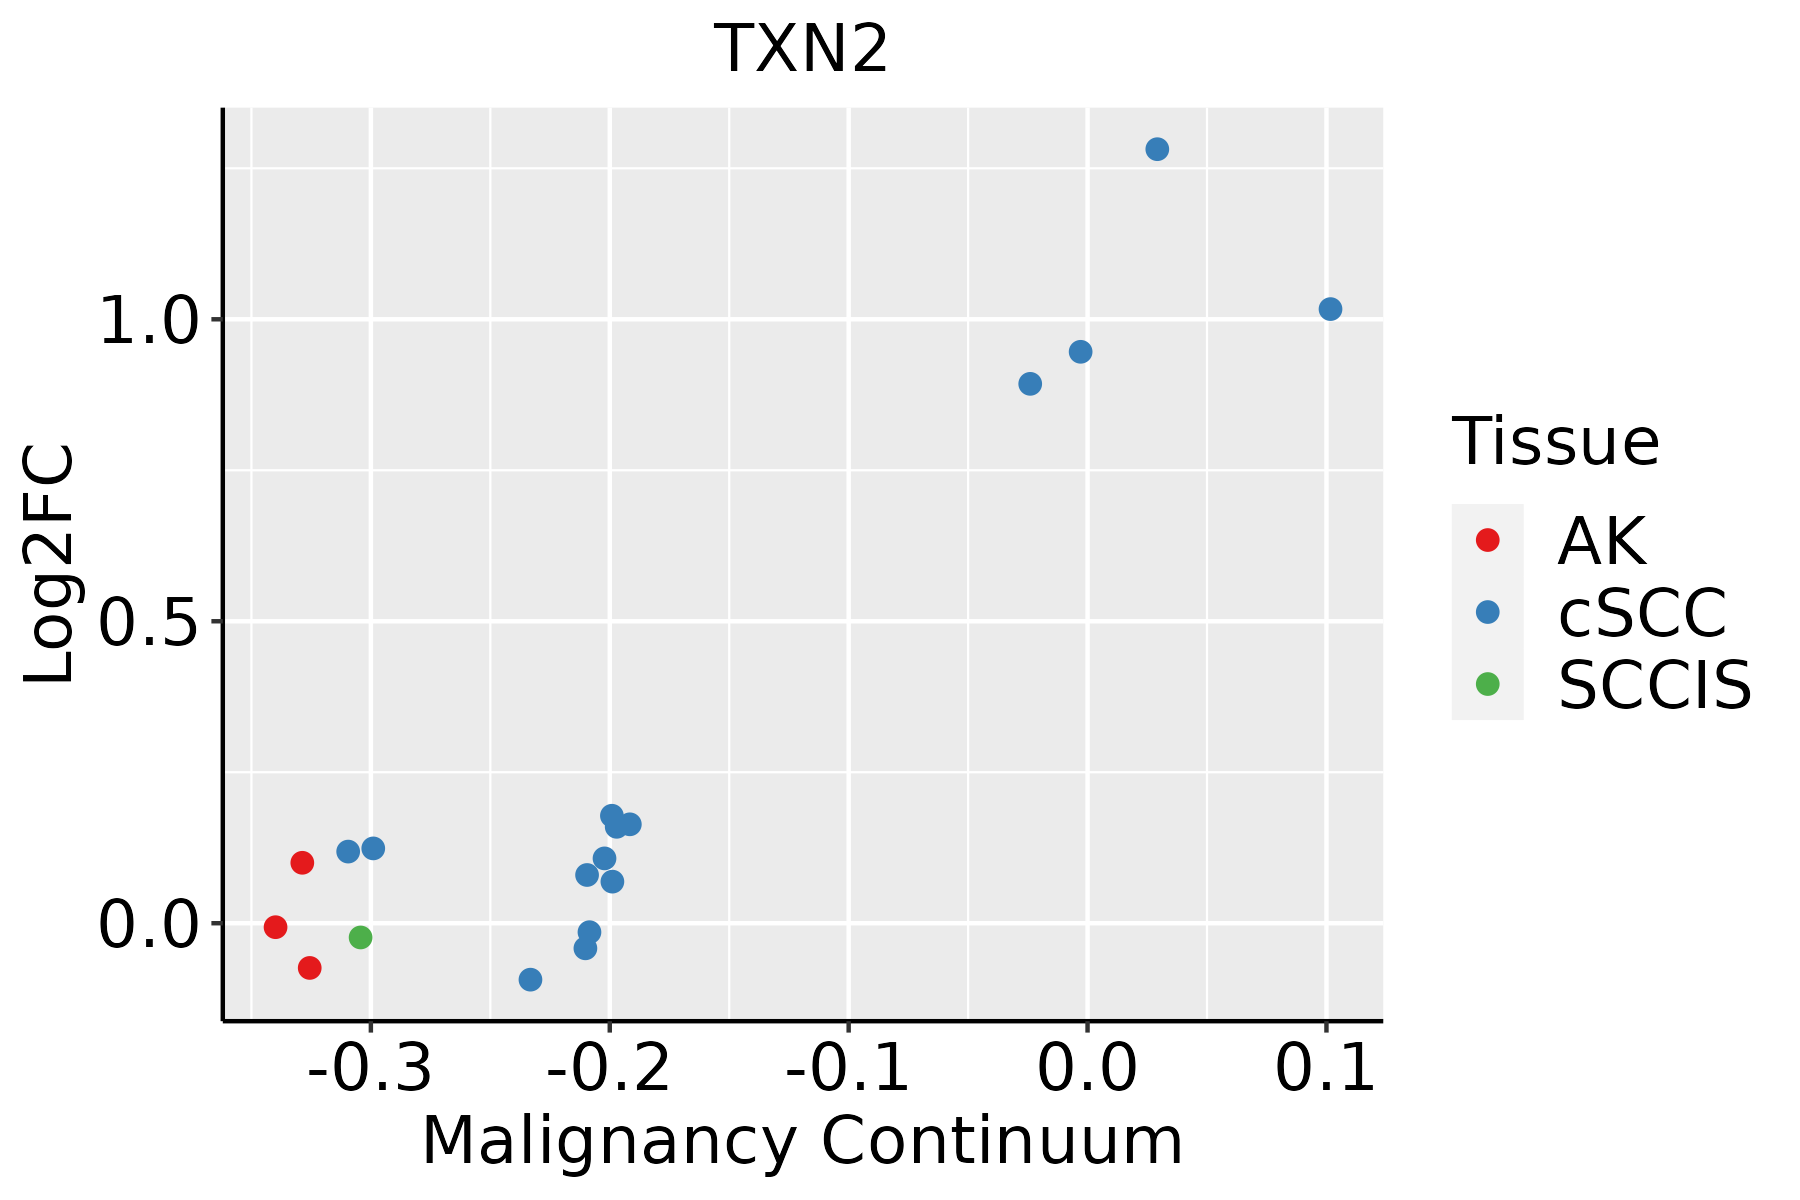 | AK: Actinic keratosis |
| cSCC: Cutaneous squamous cell carcinoma | ||
| SCCIS:squamous cell carcinoma in situ | ||
| Thyroid |  | ATC: Anaplastic thyroid cancer |
| HT: Hashimoto's thyroiditis | ||
| PTC: Papillary thyroid cancer |
| ∗log2FC in expression of this searched gene in stem-like cells from each diseased tissue sample relative to stem-like cells in normal samples in each tissue plotted against the malignancy continuum. Samples are colored based on if they are from different disease stage. |
Top |
Malignant transformation related pathway analysis |
| Find out the enriched GO biological processes and KEGG pathways involved in transition from healthy to precancer to cancer |
| Tissue | Disease Stage | Enriched GO biological Processes |
| Colorectum | AD |  |
| Colorectum | SER |  |
| Colorectum | MSS |  |
| Colorectum | MSI-H |  |
| Colorectum | FAP |  |
| ∗Top 15 enriched GO BP terms are showed in the bar plot of each disease state in each tissue. Each row represents a significant GO biological process which is colored according to the -log10(p.adjust). |
| Page: 1 2 3 4 5 6 7 8 9 |
| GO ID | Tissue | Disease Stage | Description | Gene Ratio | Bg Ratio | pvalue | p.adjust | Count |
| GO:000641710 | Cervix | CC | regulation of translation | 89/2311 | 468/18723 | 1.86e-05 | 3.46e-04 | 89 |
| GO:00068987 | Cervix | CC | receptor-mediated endocytosis | 53/2311 | 244/18723 | 2.52e-05 | 4.29e-04 | 53 |
| GO:00301008 | Cervix | CC | regulation of endocytosis | 47/2311 | 211/18723 | 3.65e-05 | 5.82e-04 | 47 |
| GO:00512368 | Cervix | CC | establishment of RNA localization | 39/2311 | 166/18723 | 4.76e-05 | 7.25e-04 | 39 |
| GO:00506578 | Cervix | CC | nucleic acid transport | 38/2311 | 163/18723 | 7.06e-05 | 9.85e-04 | 38 |
| GO:00506588 | Cervix | CC | RNA transport | 38/2311 | 163/18723 | 7.06e-05 | 9.85e-04 | 38 |
| GO:000640310 | Cervix | CC | RNA localization | 43/2311 | 201/18723 | 2.00e-04 | 2.29e-03 | 43 |
| GO:00431127 | Cervix | CC | receptor metabolic process | 37/2311 | 166/18723 | 2.31e-04 | 2.58e-03 | 37 |
| GO:00159318 | Cervix | CC | nucleobase-containing compound transport | 43/2311 | 222/18723 | 1.72e-03 | 1.30e-02 | 43 |
| GO:00482597 | Cervix | CC | regulation of receptor-mediated endocytosis | 24/2311 | 110/18723 | 3.62e-03 | 2.31e-02 | 24 |
| GO:00316236 | Cervix | CC | receptor internalization | 24/2311 | 113/18723 | 5.18e-03 | 3.05e-02 | 24 |
| GO:00339626 | Cervix | CC | P-body assembly | 7/2311 | 21/18723 | 1.04e-02 | 4.97e-02 | 7 |
| GO:0006979 | Colorectum | AD | response to oxidative stress | 145/3918 | 446/18723 | 5.16e-09 | 3.23e-07 | 145 |
| GO:0043112 | Colorectum | AD | receptor metabolic process | 62/3918 | 166/18723 | 8.18e-07 | 2.85e-05 | 62 |
| GO:0009743 | Colorectum | AD | response to carbohydrate | 86/3918 | 253/18723 | 8.43e-07 | 2.90e-05 | 86 |
| GO:0006417 | Colorectum | AD | regulation of translation | 141/3918 | 468/18723 | 1.32e-06 | 4.22e-05 | 141 |
| GO:0006403 | Colorectum | AD | RNA localization | 71/3918 | 201/18723 | 1.54e-06 | 4.76e-05 | 71 |
| GO:0034284 | Colorectum | AD | response to monosaccharide | 76/3918 | 225/18723 | 4.64e-06 | 1.23e-04 | 76 |
| GO:0009746 | Colorectum | AD | response to hexose | 73/3918 | 219/18723 | 1.20e-05 | 2.65e-04 | 73 |
| GO:0031667 | Colorectum | AD | response to nutrient levels | 138/3918 | 474/18723 | 1.22e-05 | 2.68e-04 | 138 |
| Page: 1 2 3 4 5 6 7 8 9 10 11 12 13 14 15 16 17 18 19 20 21 22 23 24 |
| Pathway ID | Tissue | Disease Stage | Description | Gene Ratio | Bg Ratio | pvalue | p.adjust | qvalue | Count |
| hsa05012 | Colorectum | AD | Parkinson disease | 147/2092 | 266/8465 | 2.53e-27 | 8.48e-25 | 5.41e-25 | 147 |
| hsa05132 | Colorectum | AD | Salmonella infection | 102/2092 | 249/8465 | 7.65e-09 | 1.28e-07 | 8.17e-08 | 102 |
| hsa05418 | Colorectum | AD | Fluid shear stress and atherosclerosis | 54/2092 | 139/8465 | 1.41e-04 | 1.16e-03 | 7.37e-04 | 54 |
| hsa050121 | Colorectum | AD | Parkinson disease | 147/2092 | 266/8465 | 2.53e-27 | 8.48e-25 | 5.41e-25 | 147 |
| hsa051321 | Colorectum | AD | Salmonella infection | 102/2092 | 249/8465 | 7.65e-09 | 1.28e-07 | 8.17e-08 | 102 |
| hsa054181 | Colorectum | AD | Fluid shear stress and atherosclerosis | 54/2092 | 139/8465 | 1.41e-04 | 1.16e-03 | 7.37e-04 | 54 |
| hsa050122 | Colorectum | SER | Parkinson disease | 132/1580 | 266/8465 | 2.72e-31 | 9.03e-29 | 6.55e-29 | 132 |
| hsa051322 | Colorectum | SER | Salmonella infection | 77/1580 | 249/8465 | 1.56e-06 | 2.35e-05 | 1.71e-05 | 77 |
| hsa054182 | Colorectum | SER | Fluid shear stress and atherosclerosis | 40/1580 | 139/8465 | 2.28e-03 | 1.75e-02 | 1.27e-02 | 40 |
| hsa050123 | Colorectum | SER | Parkinson disease | 132/1580 | 266/8465 | 2.72e-31 | 9.03e-29 | 6.55e-29 | 132 |
| hsa051323 | Colorectum | SER | Salmonella infection | 77/1580 | 249/8465 | 1.56e-06 | 2.35e-05 | 1.71e-05 | 77 |
| hsa054183 | Colorectum | SER | Fluid shear stress and atherosclerosis | 40/1580 | 139/8465 | 2.28e-03 | 1.75e-02 | 1.27e-02 | 40 |
| hsa050124 | Colorectum | MSS | Parkinson disease | 140/1875 | 266/8465 | 2.32e-28 | 7.79e-26 | 4.77e-26 | 140 |
| hsa051324 | Colorectum | MSS | Salmonella infection | 92/1875 | 249/8465 | 5.23e-08 | 9.74e-07 | 5.97e-07 | 92 |
| hsa054184 | Colorectum | MSS | Fluid shear stress and atherosclerosis | 51/1875 | 139/8465 | 6.06e-05 | 5.80e-04 | 3.55e-04 | 51 |
| hsa050125 | Colorectum | MSS | Parkinson disease | 140/1875 | 266/8465 | 2.32e-28 | 7.79e-26 | 4.77e-26 | 140 |
| hsa051325 | Colorectum | MSS | Salmonella infection | 92/1875 | 249/8465 | 5.23e-08 | 9.74e-07 | 5.97e-07 | 92 |
| hsa054185 | Colorectum | MSS | Fluid shear stress and atherosclerosis | 51/1875 | 139/8465 | 6.06e-05 | 5.80e-04 | 3.55e-04 | 51 |
| hsa050126 | Colorectum | MSI-H | Parkinson disease | 85/797 | 266/8465 | 1.19e-25 | 1.29e-23 | 1.08e-23 | 85 |
| hsa050127 | Colorectum | MSI-H | Parkinson disease | 85/797 | 266/8465 | 1.19e-25 | 1.29e-23 | 1.08e-23 | 85 |
| Page: 1 2 3 4 |
Top |
Cell-cell communication analysis |
| Identification of potential cell-cell interactions between two cell types and their ligand-receptor pairs for different disease states |
| Ligand | Receptor | LRpair | Pathway | Tissue | Disease Stage |
| Page: 1 |
Top |
Single-cell gene regulatory network inference analysis |
| Find out the significant the regulons (TFs) and the target genes of each regulon across cell types for different disease states |
| TF | Cell Type | Tissue | Disease Stage | Target Gene | RSS | Regulon Activity |
| ∗The dot plots of a searched regulon are shown for all cell subpopulations in each disease state of each tissue based on the regulon specific score inferred using pySCENIC and by calculating the average expression. |
| Page: 1 |
Top |
Somatic mutation of malignant transformation related genes |
| Annotation of somatic variants for genes involved in malignant transformation |
| Hugo Symbol | Variant Class | Variant Classification | dbSNP RS | HGVSc | HGVSp | HGVSp Short | SWISSPROT | BIOTYPE | SIFT | PolyPhen | Tumor Sample Barcode | Tissue | Histology | Sex | Age | Stage | Therapy Types | Drugs | Outcome |
| TXN2 | insertion | In_Frame_Ins | novel | c.347_348insTACAGGCACGCGCCACCACGC | p.Val116_Asp117insThrGlyThrArgHisHisAla | p.V116_D117insTGTRHHA | Q99757 | protein_coding | TCGA-AO-A0JJ-01 | Breast | breast invasive carcinoma | Female | <65 | I/II | Chemotherapy | cyclophospamide | SD | ||
| TXN2 | SNV | Missense_Mutation | novel | c.318N>T | p.Lys106Asn | p.K106N | Q99757 | protein_coding | tolerated(0.09) | benign(0.055) | TCGA-AA-3950-01 | Colorectum | colon adenocarcinoma | Female | >=65 | I/II | Unknown | Unknown | SD |
| TXN2 | SNV | Missense_Mutation | rs776811065 | c.373G>A | p.Ala125Thr | p.A125T | Q99757 | protein_coding | deleterious(0.03) | probably_damaging(0.998) | TCGA-AU-6004-01 | Colorectum | colon adenocarcinoma | Female | >=65 | I/II | Unknown | Unknown | SD |
| TXN2 | SNV | Missense_Mutation | novel | c.322C>T | p.His108Tyr | p.H108Y | Q99757 | protein_coding | deleterious(0.02) | benign(0.03) | TCGA-A5-A0G2-01 | Endometrium | uterine corpus endometrioid carcinoma | Female | <65 | III/IV | Unknown | Unknown | SD |
| TXN2 | SNV | Missense_Mutation | novel | c.292N>T | p.Pro98Ser | p.P98S | Q99757 | protein_coding | deleterious(0) | probably_damaging(1) | TCGA-AP-A0LS-01 | Endometrium | uterine corpus endometrioid carcinoma | Female | <65 | I/II | Unknown | Unknown | SD |
| TXN2 | SNV | Missense_Mutation | novel | c.286C>A | p.Leu96Met | p.L96M | Q99757 | protein_coding | deleterious(0) | probably_damaging(0.998) | TCGA-AX-A05Z-01 | Endometrium | uterine corpus endometrioid carcinoma | Female | <65 | III/IV | Chemotherapy | adriamycin | SD |
| TXN2 | SNV | Missense_Mutation | rs139984170 | c.293N>T | p.Pro98Leu | p.P98L | Q99757 | protein_coding | deleterious(0.02) | probably_damaging(1) | TCGA-AX-A1CE-01 | Endometrium | uterine corpus endometrioid carcinoma | Female | <65 | I/II | Unspecific | Paclitaxel | SD |
| TXN2 | SNV | Missense_Mutation | rs776811065 | c.373G>A | p.Ala125Thr | p.A125T | Q99757 | protein_coding | deleterious(0.03) | probably_damaging(0.998) | TCGA-AX-A2HD-01 | Endometrium | uterine corpus endometrioid carcinoma | Female | >=65 | III/IV | Unknown | Unknown | SD |
| TXN2 | SNV | Missense_Mutation | novel | c.323N>G | p.His108Arg | p.H108R | Q99757 | protein_coding | tolerated(0.28) | benign(0) | TCGA-AX-A3FT-01 | Endometrium | uterine corpus endometrioid carcinoma | Female | <65 | I/II | Unknown | Unknown | SD |
| TXN2 | SNV | Missense_Mutation | novel | c.287N>C | p.Leu96Pro | p.L96P | Q99757 | protein_coding | deleterious(0) | probably_damaging(1) | TCGA-B5-A3FA-01 | Endometrium | uterine corpus endometrioid carcinoma | Female | >=65 | I/II | Unknown | Unknown | SD |
| Page: 1 2 3 |
Top |
Related drugs of malignant transformation related genes |
| Identification of chemicals and drugs interact with genes involved in malignant transfromation |
| (DGIdb 4.0) |
| Entrez ID | Symbol | Category | Interaction Types | Drug Claim Name | Drug Name | PMIDs |
| 25828 | TXN2 | DRUGGABLE GENOME, THIOREDOXIN | GAMBOGIC ACID | GAMBOGIC ACID | 22663155 | |
| 25828 | TXN2 | DRUGGABLE GENOME, THIOREDOXIN | BIOTINYLATED GAMBOGIC ACID | BIOTINYLATED GAMBOGIC ACID | 22663155 | |
| 25828 | TXN2 | DRUGGABLE GENOME, THIOREDOXIN | GAMBOGENIC ACID | GAMBOGENIC ACID | 22663155 |
| Page: 1 |

Copyright 2023-Present -The University of Texas Health Science Center at Houston |