
|
|||||
|
 | |
| |
| |
| |
| |
| |
|
Gene: TXLNG |
Gene summary for TXLNG |
| Gene information | Species | Human | Gene symbol | TXLNG | Gene ID | 55787 |
| Gene name | taxilin gamma | |
| Gene Alias | CXorf15 | |
| Cytomap | Xp22.2 | |
| Gene Type | protein-coding | GO ID | GO:0001503 | UniProtAcc | Q9NUQ3 |
Top |
Malignant transformation analysis |
| Identification of the aberrant gene expression in precancerous and cancerous lesions by comparing the gene expression of stem-like cells in diseased tissues with normal stem cells |
| Entrez ID | Symbol | Replicates | Species | Organ | Tissue | Adj P-value | Log2FC | Malignancy |
| 55787 | TXLNG | LZE4T | Human | Esophagus | ESCC | 1.35e-13 | 2.00e-01 | 0.0811 |
| 55787 | TXLNG | LZE5T | Human | Esophagus | ESCC | 5.34e-06 | 1.72e-01 | 0.0514 |
| 55787 | TXLNG | LZE7T | Human | Esophagus | ESCC | 3.25e-03 | 1.58e-01 | 0.0667 |
| 55787 | TXLNG | LZE8T | Human | Esophagus | ESCC | 4.37e-11 | 1.35e-01 | 0.067 |
| 55787 | TXLNG | LZE24T | Human | Esophagus | ESCC | 3.51e-10 | 1.24e-02 | 0.0596 |
| 55787 | TXLNG | LZE6T | Human | Esophagus | ESCC | 9.80e-04 | 3.02e-01 | 0.0845 |
| 55787 | TXLNG | P1T-E | Human | Esophagus | ESCC | 1.38e-04 | 5.65e-02 | 0.0875 |
| 55787 | TXLNG | P2T-E | Human | Esophagus | ESCC | 5.88e-39 | 8.51e-01 | 0.1177 |
| 55787 | TXLNG | P4T-E | Human | Esophagus | ESCC | 1.55e-15 | 3.94e-01 | 0.1323 |
| 55787 | TXLNG | P5T-E | Human | Esophagus | ESCC | 3.34e-12 | 3.00e-01 | 0.1327 |
| 55787 | TXLNG | P8T-E | Human | Esophagus | ESCC | 4.95e-14 | 2.83e-01 | 0.0889 |
| 55787 | TXLNG | P9T-E | Human | Esophagus | ESCC | 1.52e-07 | 9.34e-02 | 0.1131 |
| 55787 | TXLNG | P10T-E | Human | Esophagus | ESCC | 1.39e-09 | 1.09e-01 | 0.116 |
| 55787 | TXLNG | P11T-E | Human | Esophagus | ESCC | 1.41e-13 | 4.18e-01 | 0.1426 |
| 55787 | TXLNG | P12T-E | Human | Esophagus | ESCC | 9.74e-08 | 2.13e-01 | 0.1122 |
| 55787 | TXLNG | P15T-E | Human | Esophagus | ESCC | 2.53e-22 | 2.77e-01 | 0.1149 |
| 55787 | TXLNG | P16T-E | Human | Esophagus | ESCC | 5.15e-22 | 4.76e-01 | 0.1153 |
| 55787 | TXLNG | P17T-E | Human | Esophagus | ESCC | 9.17e-03 | 1.45e-01 | 0.1278 |
| 55787 | TXLNG | P19T-E | Human | Esophagus | ESCC | 9.59e-04 | 5.40e-01 | 0.1662 |
| 55787 | TXLNG | P20T-E | Human | Esophagus | ESCC | 1.70e-13 | 2.27e-01 | 0.1124 |
| Page: 1 2 3 4 5 |
| Tissue | Expression Dynamics | Abbreviation |
| Esophagus | 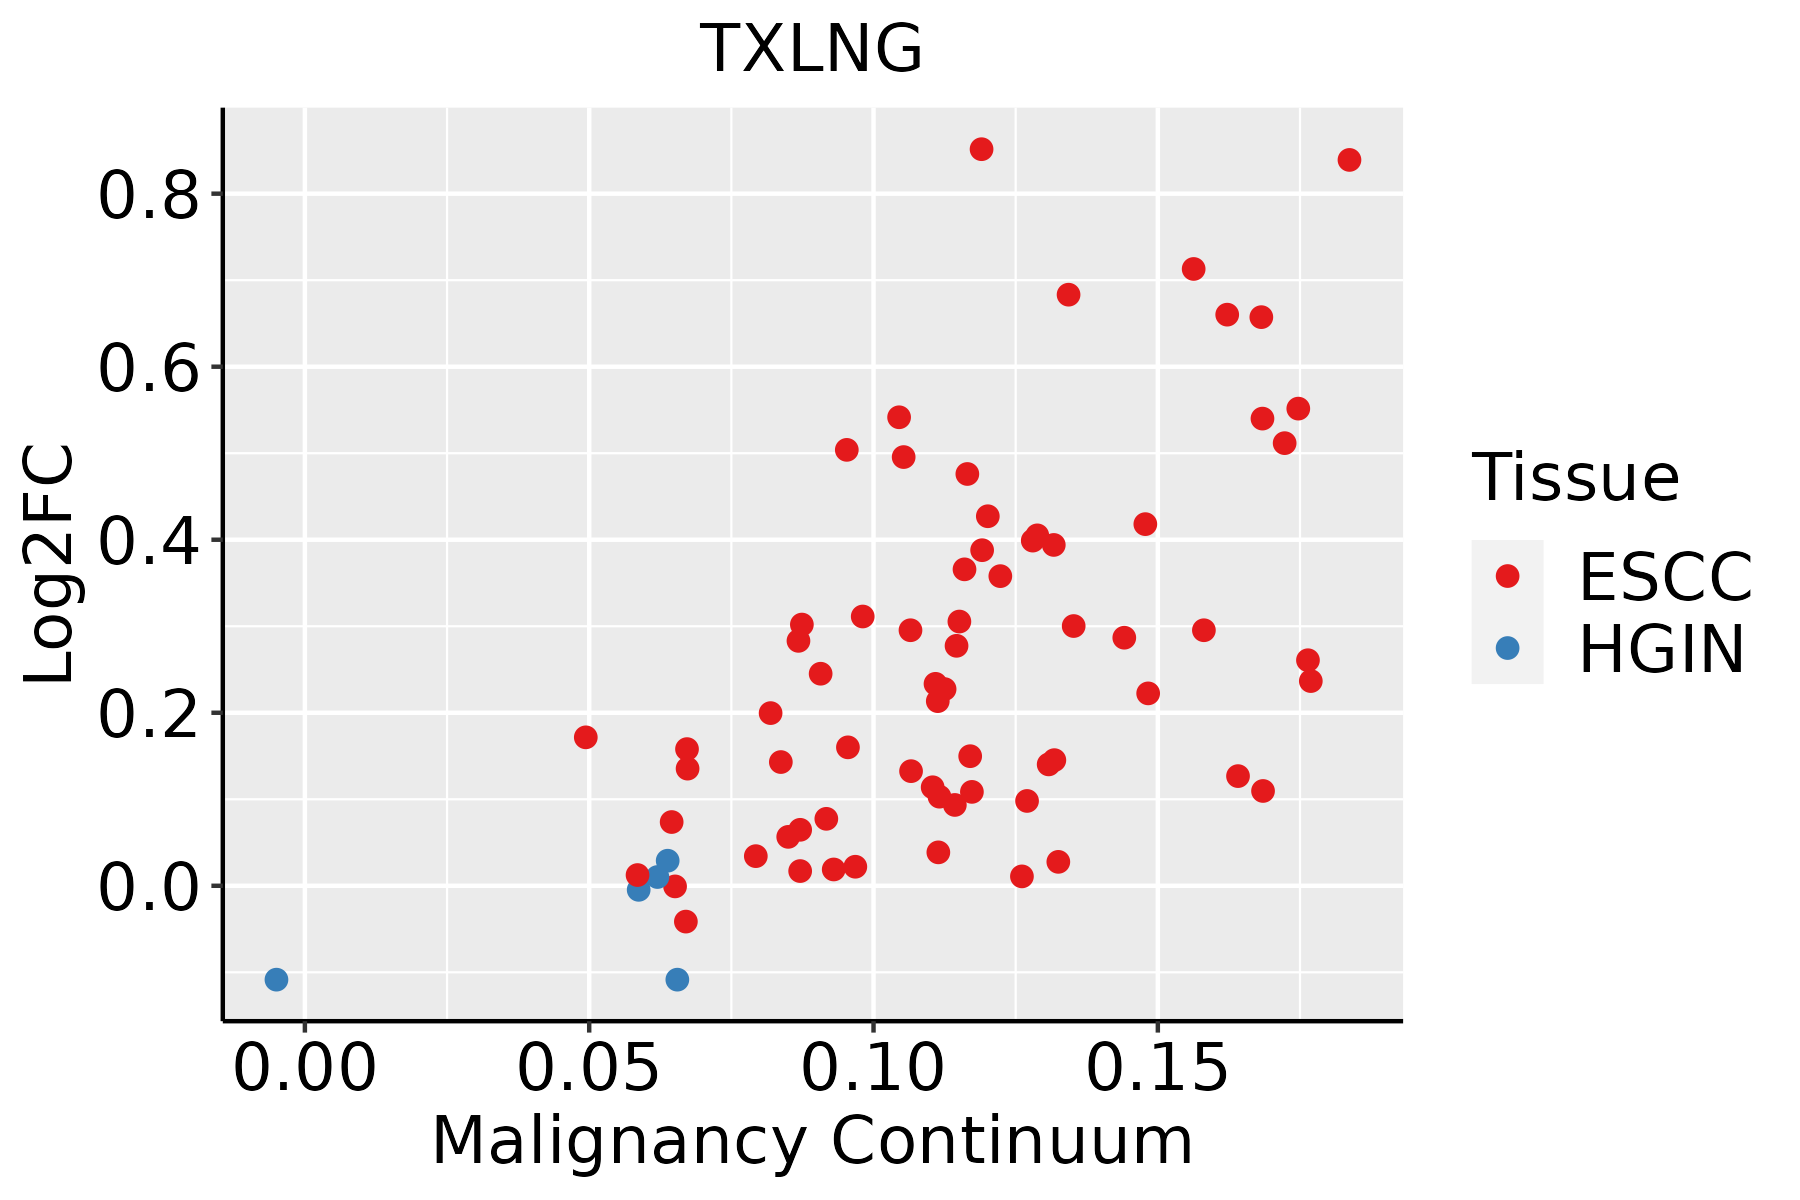 | ESCC: Esophageal squamous cell carcinoma |
| HGIN: High-grade intraepithelial neoplasias | ||
| LGIN: Low-grade intraepithelial neoplasias | ||
| Liver | 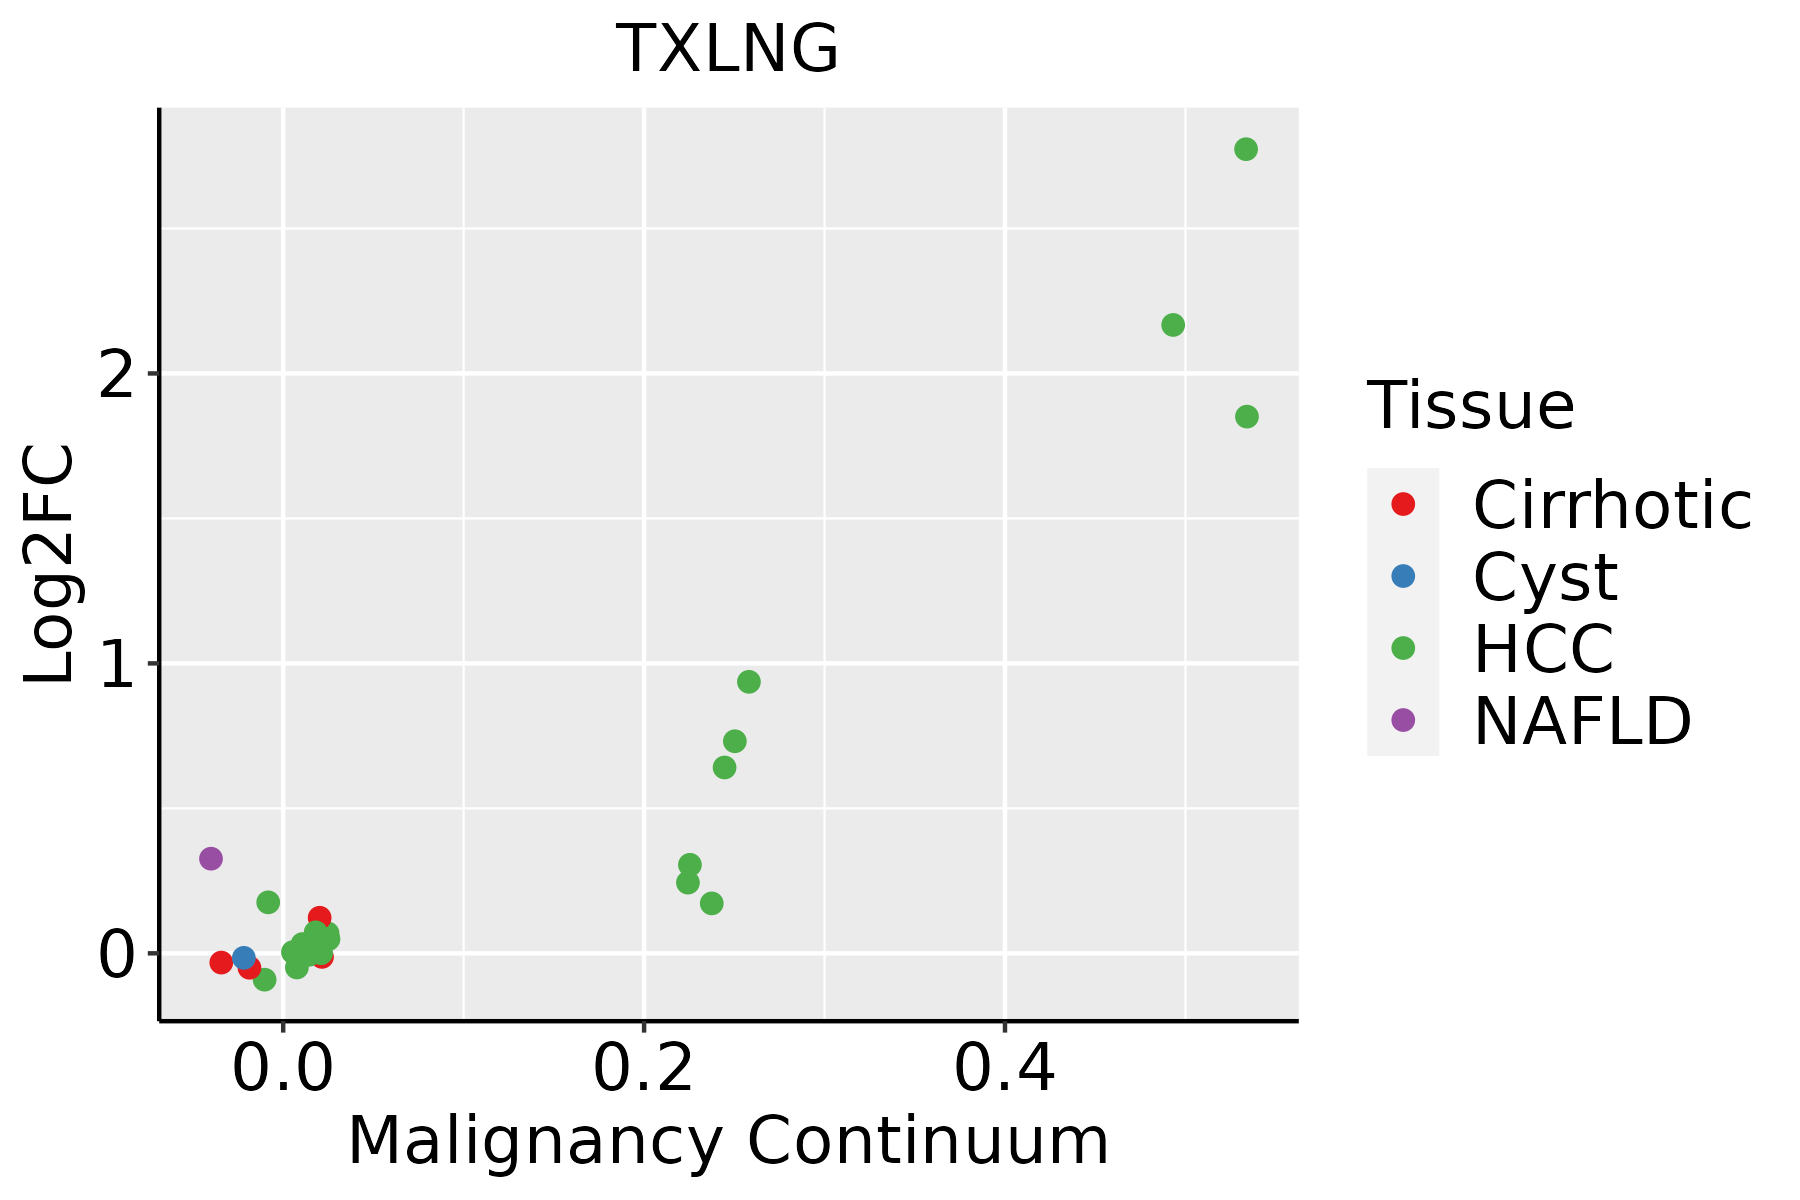 | HCC: Hepatocellular carcinoma |
| NAFLD: Non-alcoholic fatty liver disease | ||
| Oral Cavity | 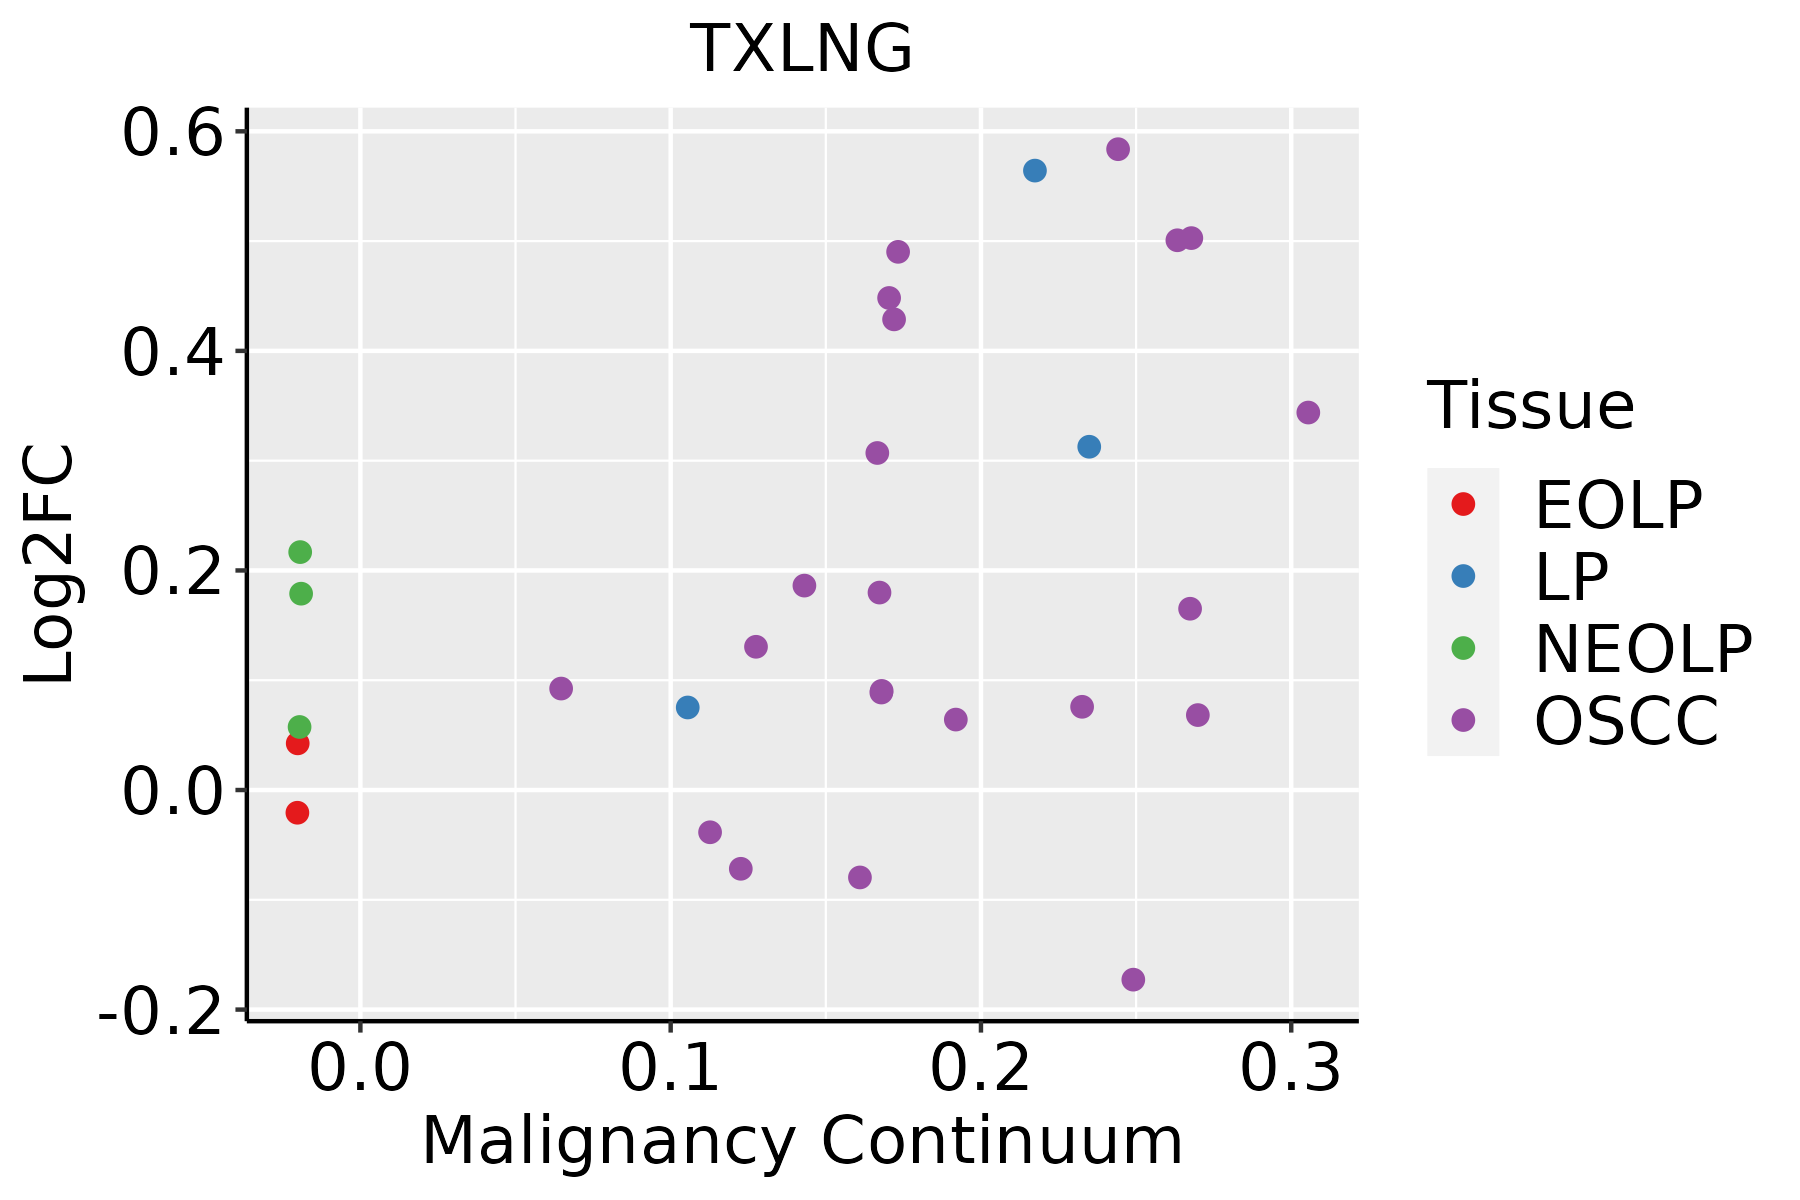 | EOLP: Erosive Oral lichen planus |
| LP: leukoplakia | ||
| NEOLP: Non-erosive oral lichen planus | ||
| OSCC: Oral squamous cell carcinoma | ||
| Thyroid | 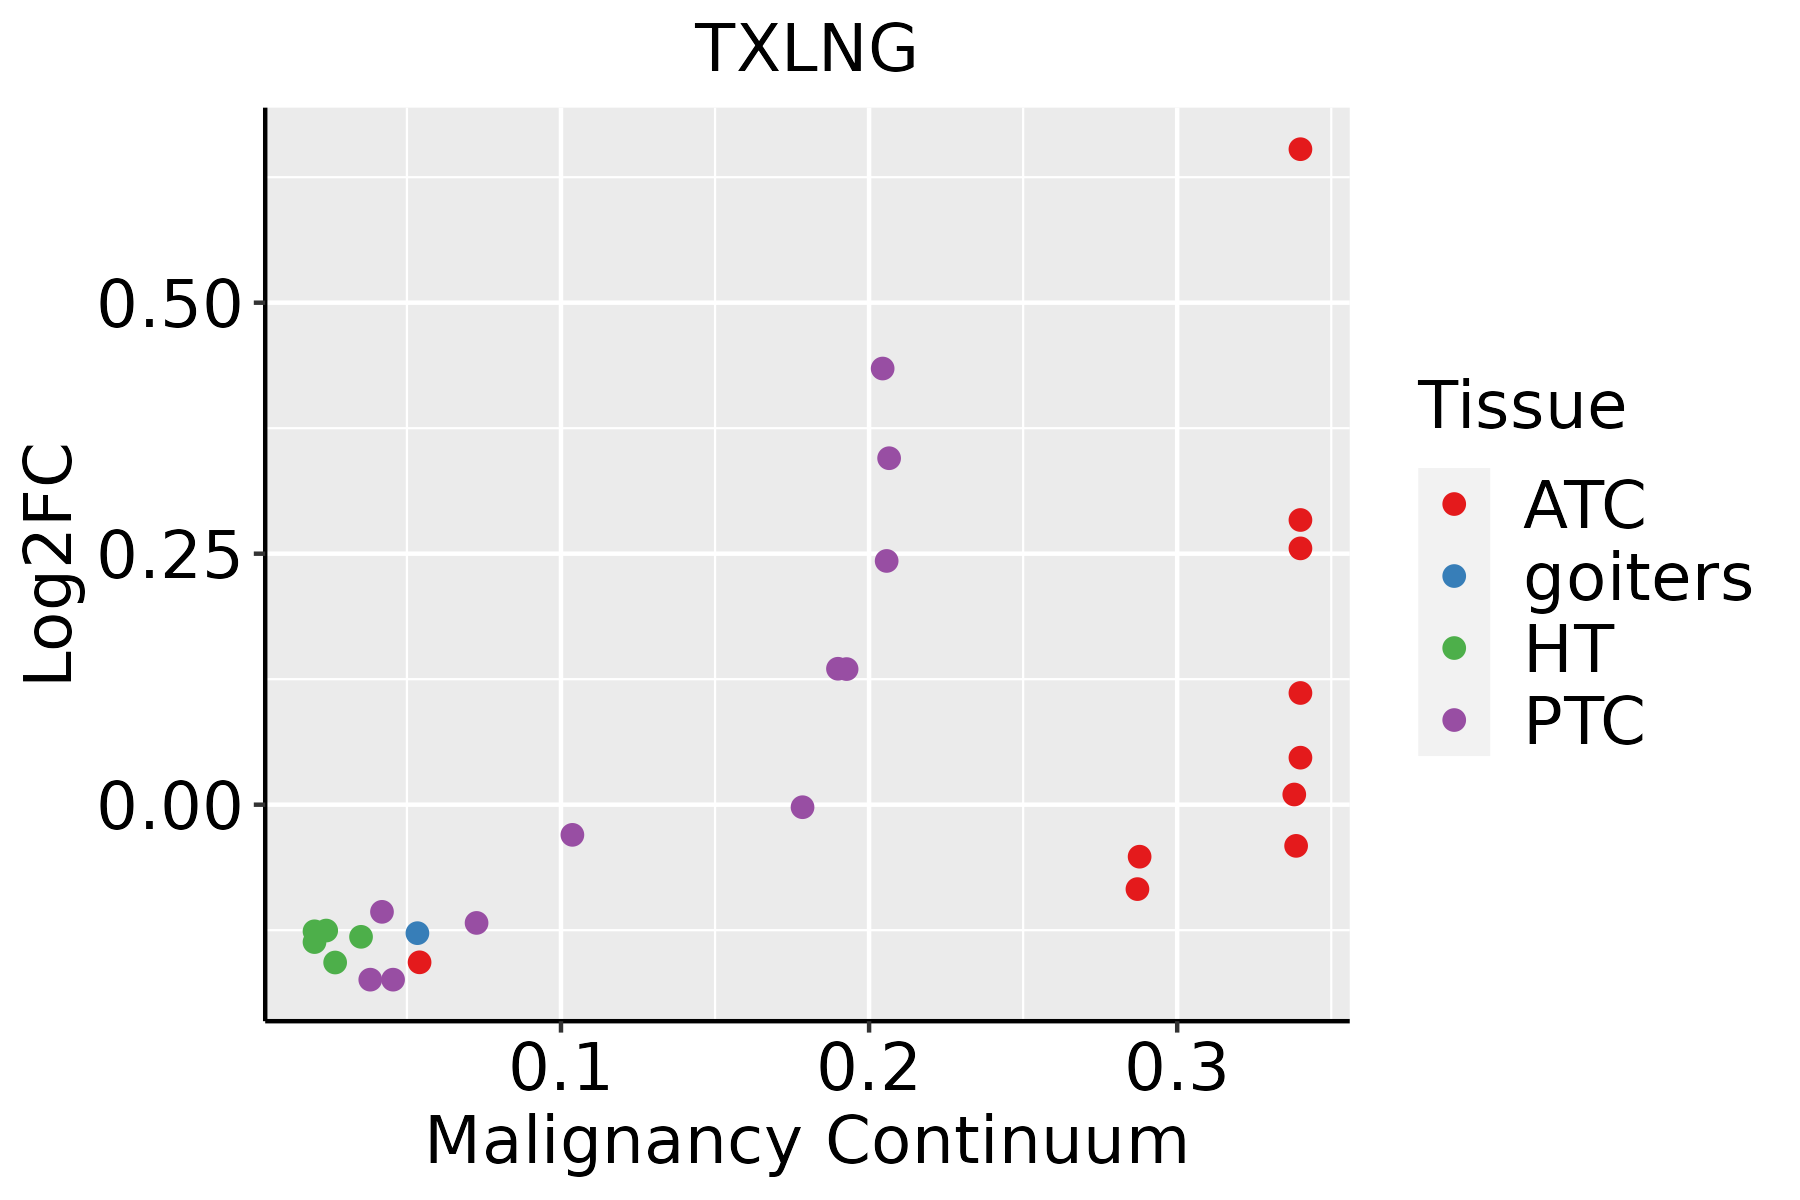 | ATC: Anaplastic thyroid cancer |
| HT: Hashimoto's thyroiditis | ||
| PTC: Papillary thyroid cancer |
| ∗log2FC in expression of this searched gene in stem-like cells from each diseased tissue sample relative to stem-like cells in normal samples in each tissue plotted against the malignancy continuum. Samples are colored based on if they are from different disease stage. |
Top |
Malignant transformation related pathway analysis |
| Find out the enriched GO biological processes and KEGG pathways involved in transition from healthy to precancer to cancer |
| Tissue | Disease Stage | Enriched GO biological Processes |
| Colorectum | AD |  |
| Colorectum | SER |  |
| Colorectum | MSS |  |
| Colorectum | MSI-H |  |
| Colorectum | FAP |  |
| ∗Top 15 enriched GO BP terms are showed in the bar plot of each disease state in each tissue. Each row represents a significant GO biological process which is colored according to the -log10(p.adjust). |
| Page: 1 2 3 4 5 6 7 8 9 |
| GO ID | Tissue | Disease Stage | Description | Gene Ratio | Bg Ratio | pvalue | p.adjust | Count |
| GO:000150317 | Esophagus | ESCC | ossification | 232/8552 | 408/18723 | 3.00e-06 | 3.40e-05 | 232 |
| GO:000150310 | Oral cavity | OSCC | ossification | 203/7305 | 408/18723 | 5.54e-06 | 6.19e-05 | 203 |
| GO:0001503110 | Thyroid | PTC | ossification | 176/5968 | 408/18723 | 9.26e-07 | 1.40e-05 | 176 |
| GO:00302785 | Thyroid | PTC | regulation of ossification | 51/5968 | 115/18723 | 3.30e-03 | 1.61e-02 | 51 |
| GO:000150332 | Thyroid | ATC | ossification | 206/6293 | 408/18723 | 9.23e-13 | 3.95e-11 | 206 |
| GO:003027813 | Thyroid | ATC | regulation of ossification | 60/6293 | 115/18723 | 3.01e-05 | 2.51e-04 | 60 |
| GO:01101492 | Thyroid | ATC | regulation of biomineralization | 45/6293 | 99/18723 | 9.34e-03 | 3.44e-02 | 45 |
| GO:00701672 | Thyroid | ATC | regulation of biomineral tissue development | 44/6293 | 97/18723 | 1.05e-02 | 3.81e-02 | 44 |
| GO:0030500 | Thyroid | ATC | regulation of bone mineralization | 36/6293 | 78/18723 | 1.43e-02 | 4.92e-02 | 36 |
| Page: 1 |
| Pathway ID | Tissue | Disease Stage | Description | Gene Ratio | Bg Ratio | pvalue | p.adjust | qvalue | Count |
| Page: 1 |
Top |
Cell-cell communication analysis |
| Identification of potential cell-cell interactions between two cell types and their ligand-receptor pairs for different disease states |
| Ligand | Receptor | LRpair | Pathway | Tissue | Disease Stage |
| Page: 1 |
Top |
Single-cell gene regulatory network inference analysis |
| Find out the significant the regulons (TFs) and the target genes of each regulon across cell types for different disease states |
| TF | Cell Type | Tissue | Disease Stage | Target Gene | RSS | Regulon Activity |
| ∗The dot plots of a searched regulon are shown for all cell subpopulations in each disease state of each tissue based on the regulon specific score inferred using pySCENIC and by calculating the average expression. |
| Page: 1 |
Top |
Somatic mutation of malignant transformation related genes |
| Annotation of somatic variants for genes involved in malignant transformation |
| Hugo Symbol | Variant Class | Variant Classification | dbSNP RS | HGVSc | HGVSp | HGVSp Short | SWISSPROT | BIOTYPE | SIFT | PolyPhen | Tumor Sample Barcode | Tissue | Histology | Sex | Age | Stage | Therapy Types | Drugs | Outcome |
| TXLNG | SNV | Missense_Mutation | c.427A>T | p.Met143Leu | p.M143L | Q9NUQ3 | protein_coding | tolerated(0.11) | possibly_damaging(0.499) | TCGA-AN-A0FS-01 | Breast | breast invasive carcinoma | Female | <65 | I/II | Unknown | Unknown | SD | |
| TXLNG | SNV | Missense_Mutation | c.848N>G | p.Tyr283Cys | p.Y283C | Q9NUQ3 | protein_coding | tolerated(0.06) | probably_damaging(0.999) | TCGA-D8-A1XK-01 | Breast | breast invasive carcinoma | Female | <65 | I/II | Chemotherapy | doxorubicine+cyclophosphamide | SD | |
| TXLNG | insertion | Frame_Shift_Ins | novel | c.1517_1518insTTGCTTGAACCTGG | p.Lys506AsnfsTer50 | p.K506Nfs*50 | Q9NUQ3 | protein_coding | TCGA-BH-A0HF-01 | Breast | breast invasive carcinoma | Female | >=65 | I/II | Hormone Therapy | arimidex | SD | ||
| TXLNG | SNV | Missense_Mutation | novel | c.1161N>C | p.Lys387Asn | p.K387N | Q9NUQ3 | protein_coding | deleterious(0) | probably_damaging(1) | TCGA-C5-A8XJ-01 | Cervix | cervical & endocervical cancer | Female | >=65 | I/II | Chemotherapy | cisplatin | SD |
| TXLNG | SNV | Missense_Mutation | c.244N>A | p.Glu82Lys | p.E82K | Q9NUQ3 | protein_coding | tolerated(0.1) | benign(0.049) | TCGA-Q1-A73P-01 | Cervix | cervical & endocervical cancer | Female | <65 | I/II | Unknown | Unknown | SD | |
| TXLNG | SNV | Missense_Mutation | novel | c.748N>A | p.Glu250Lys | p.E250K | Q9NUQ3 | protein_coding | deleterious(0.05) | possibly_damaging(0.867) | TCGA-VS-A8EL-01 | Cervix | cervical & endocervical cancer | Female | <65 | I/II | Chemotherapy | cisplatin | CR |
| TXLNG | SNV | Missense_Mutation | rs182737478 | c.1199N>A | p.Arg400His | p.R400H | Q9NUQ3 | protein_coding | deleterious(0) | possibly_damaging(0.782) | TCGA-AA-3977-01 | Colorectum | colon adenocarcinoma | Male | >=65 | I/II | Unknown | Unknown | SD |
| TXLNG | SNV | Missense_Mutation | c.875N>C | p.Lys292Thr | p.K292T | Q9NUQ3 | protein_coding | deleterious(0) | possibly_damaging(0.791) | TCGA-AA-A010-01 | Colorectum | colon adenocarcinoma | Female | <65 | I/II | Chemotherapy | folinic | CR | |
| TXLNG | SNV | Missense_Mutation | novel | c.1305G>T | p.Glu435Asp | p.E435D | Q9NUQ3 | protein_coding | deleterious(0.01) | probably_damaging(0.997) | TCGA-AZ-4315-01 | Colorectum | colon adenocarcinoma | Male | <65 | I/II | Unknown | Unknown | SD |
| TXLNG | SNV | Missense_Mutation | c.1005N>C | p.Glu335Asp | p.E335D | Q9NUQ3 | protein_coding | tolerated(0.09) | possibly_damaging(0.679) | TCGA-D5-6920-01 | Colorectum | colon adenocarcinoma | Female | >=65 | I/II | Unknown | Unknown | SD |
| Page: 1 2 3 4 5 |
Top |
Related drugs of malignant transformation related genes |
| Identification of chemicals and drugs interact with genes involved in malignant transfromation |
| (DGIdb 4.0) |
| Entrez ID | Symbol | Category | Interaction Types | Drug Claim Name | Drug Name | PMIDs |
| Page: 1 |

Copyright 2023-Present -The University of Texas Health Science Center at Houston |