
|
|||||
|
 | |
| |
| |
| |
| |
| |
|
Gene: TXLNA |
Gene summary for TXLNA |
| Gene information | Species | Human | Gene symbol | TXLNA | Gene ID | 200081 |
| Gene name | taxilin alpha | |
| Gene Alias | IL14 | |
| Cytomap | 1p35.2 | |
| Gene Type | protein-coding | GO ID | GO:0001775 | UniProtAcc | P40222 |
Top |
Malignant transformation analysis |
| Identification of the aberrant gene expression in precancerous and cancerous lesions by comparing the gene expression of stem-like cells in diseased tissues with normal stem cells |
| Entrez ID | Symbol | Replicates | Species | Organ | Tissue | Adj P-value | Log2FC | Malignancy |
| 200081 | TXLNA | LZE4T | Human | Esophagus | ESCC | 3.52e-09 | 1.34e-01 | 0.0811 |
| 200081 | TXLNA | LZE7T | Human | Esophagus | ESCC | 1.12e-03 | 2.86e-01 | 0.0667 |
| 200081 | TXLNA | LZE24T | Human | Esophagus | ESCC | 1.32e-04 | 2.11e-01 | 0.0596 |
| 200081 | TXLNA | LZE6T | Human | Esophagus | ESCC | 9.09e-03 | 2.63e-01 | 0.0845 |
| 200081 | TXLNA | P1T-E | Human | Esophagus | ESCC | 6.67e-09 | 3.83e-01 | 0.0875 |
| 200081 | TXLNA | P2T-E | Human | Esophagus | ESCC | 7.89e-25 | 3.81e-01 | 0.1177 |
| 200081 | TXLNA | P4T-E | Human | Esophagus | ESCC | 2.64e-13 | 1.68e-01 | 0.1323 |
| 200081 | TXLNA | P5T-E | Human | Esophagus | ESCC | 8.48e-10 | 2.28e-01 | 0.1327 |
| 200081 | TXLNA | P8T-E | Human | Esophagus | ESCC | 2.30e-09 | 1.92e-01 | 0.0889 |
| 200081 | TXLNA | P9T-E | Human | Esophagus | ESCC | 1.85e-17 | 1.80e-01 | 0.1131 |
| 200081 | TXLNA | P10T-E | Human | Esophagus | ESCC | 7.02e-20 | 4.77e-01 | 0.116 |
| 200081 | TXLNA | P11T-E | Human | Esophagus | ESCC | 1.27e-06 | 3.14e-01 | 0.1426 |
| 200081 | TXLNA | P12T-E | Human | Esophagus | ESCC | 3.12e-08 | 1.35e-01 | 0.1122 |
| 200081 | TXLNA | P15T-E | Human | Esophagus | ESCC | 1.30e-10 | 1.44e-01 | 0.1149 |
| 200081 | TXLNA | P16T-E | Human | Esophagus | ESCC | 3.72e-09 | 1.41e-01 | 0.1153 |
| 200081 | TXLNA | P17T-E | Human | Esophagus | ESCC | 1.84e-09 | 3.67e-01 | 0.1278 |
| 200081 | TXLNA | P19T-E | Human | Esophagus | ESCC | 2.99e-07 | 4.70e-01 | 0.1662 |
| 200081 | TXLNA | P20T-E | Human | Esophagus | ESCC | 3.57e-13 | 2.88e-01 | 0.1124 |
| 200081 | TXLNA | P21T-E | Human | Esophagus | ESCC | 6.42e-18 | 4.11e-01 | 0.1617 |
| 200081 | TXLNA | P22T-E | Human | Esophagus | ESCC | 8.77e-13 | 1.38e-01 | 0.1236 |
| Page: 1 2 3 4 5 |
| Tissue | Expression Dynamics | Abbreviation |
| Esophagus | 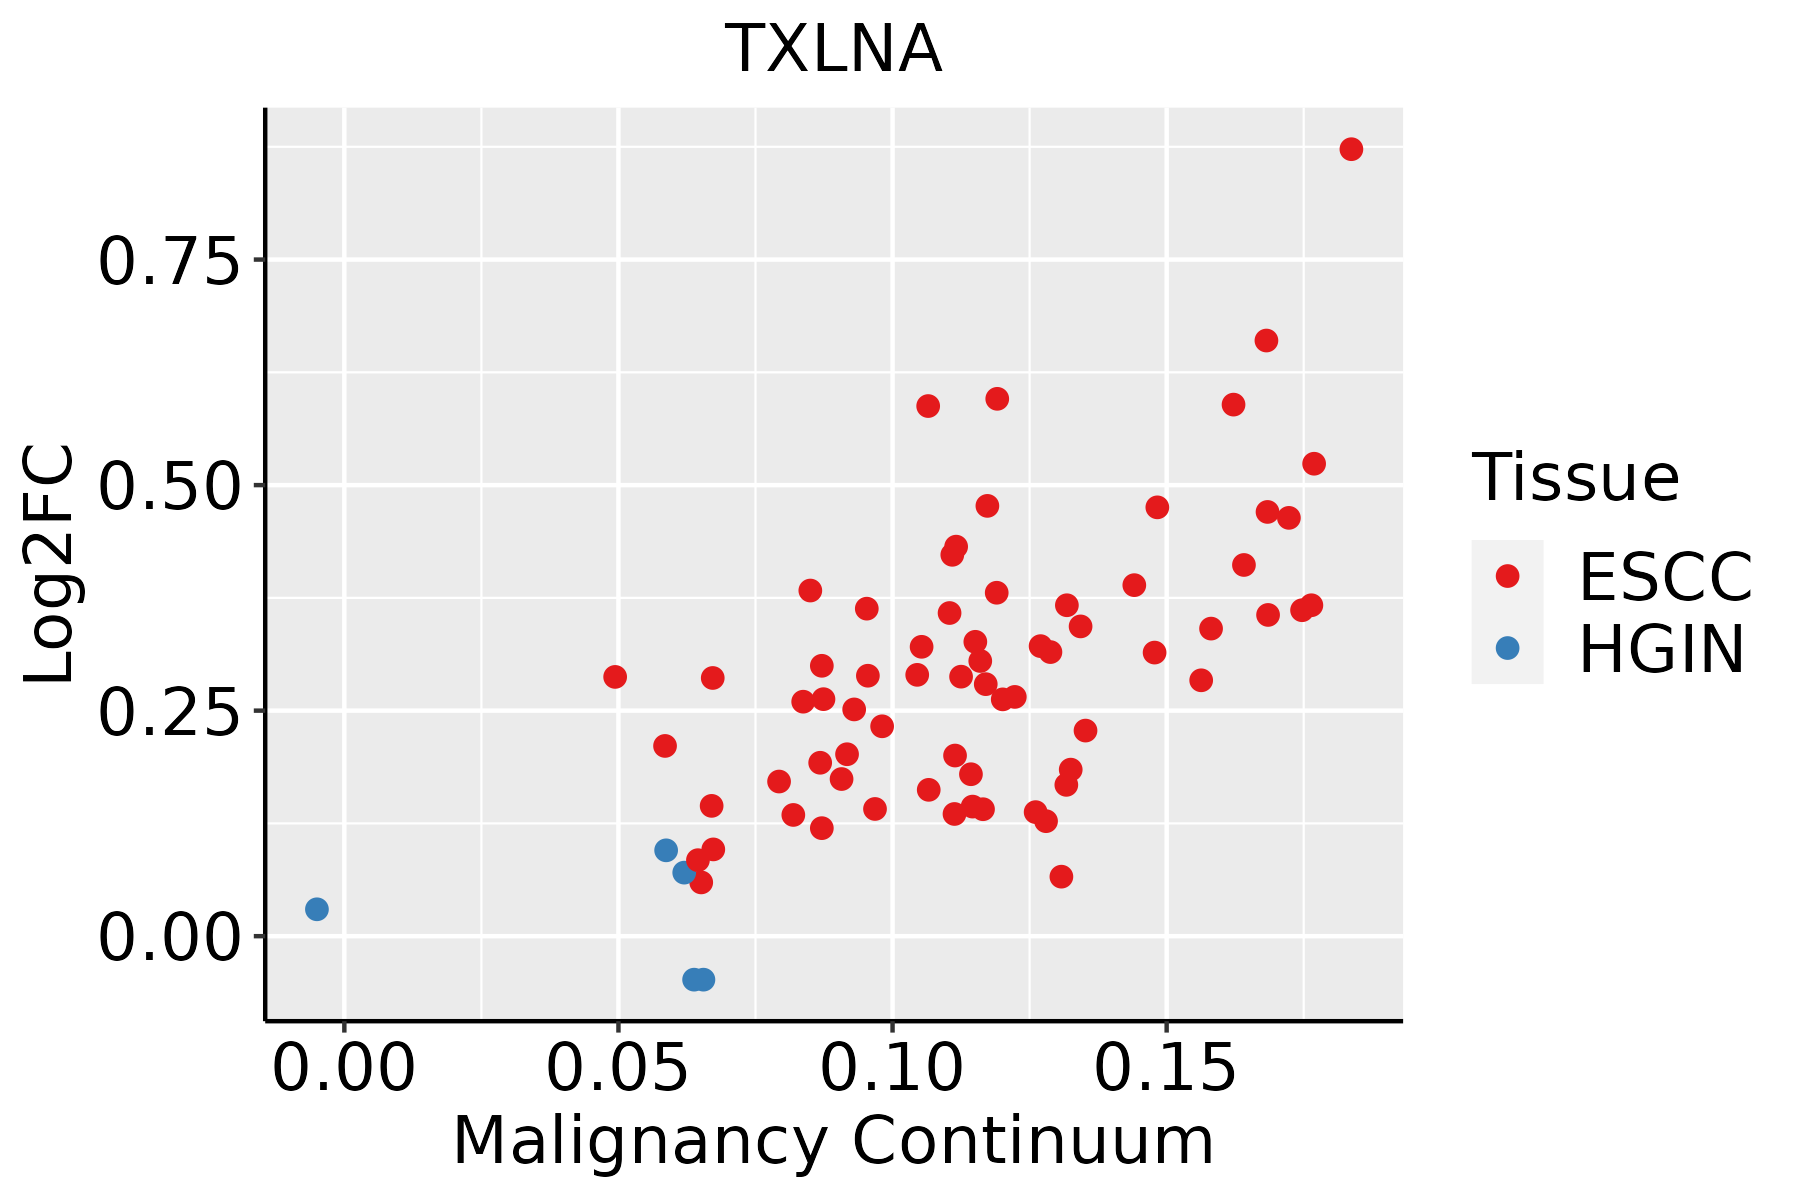 | ESCC: Esophageal squamous cell carcinoma |
| HGIN: High-grade intraepithelial neoplasias | ||
| LGIN: Low-grade intraepithelial neoplasias | ||
| Liver | 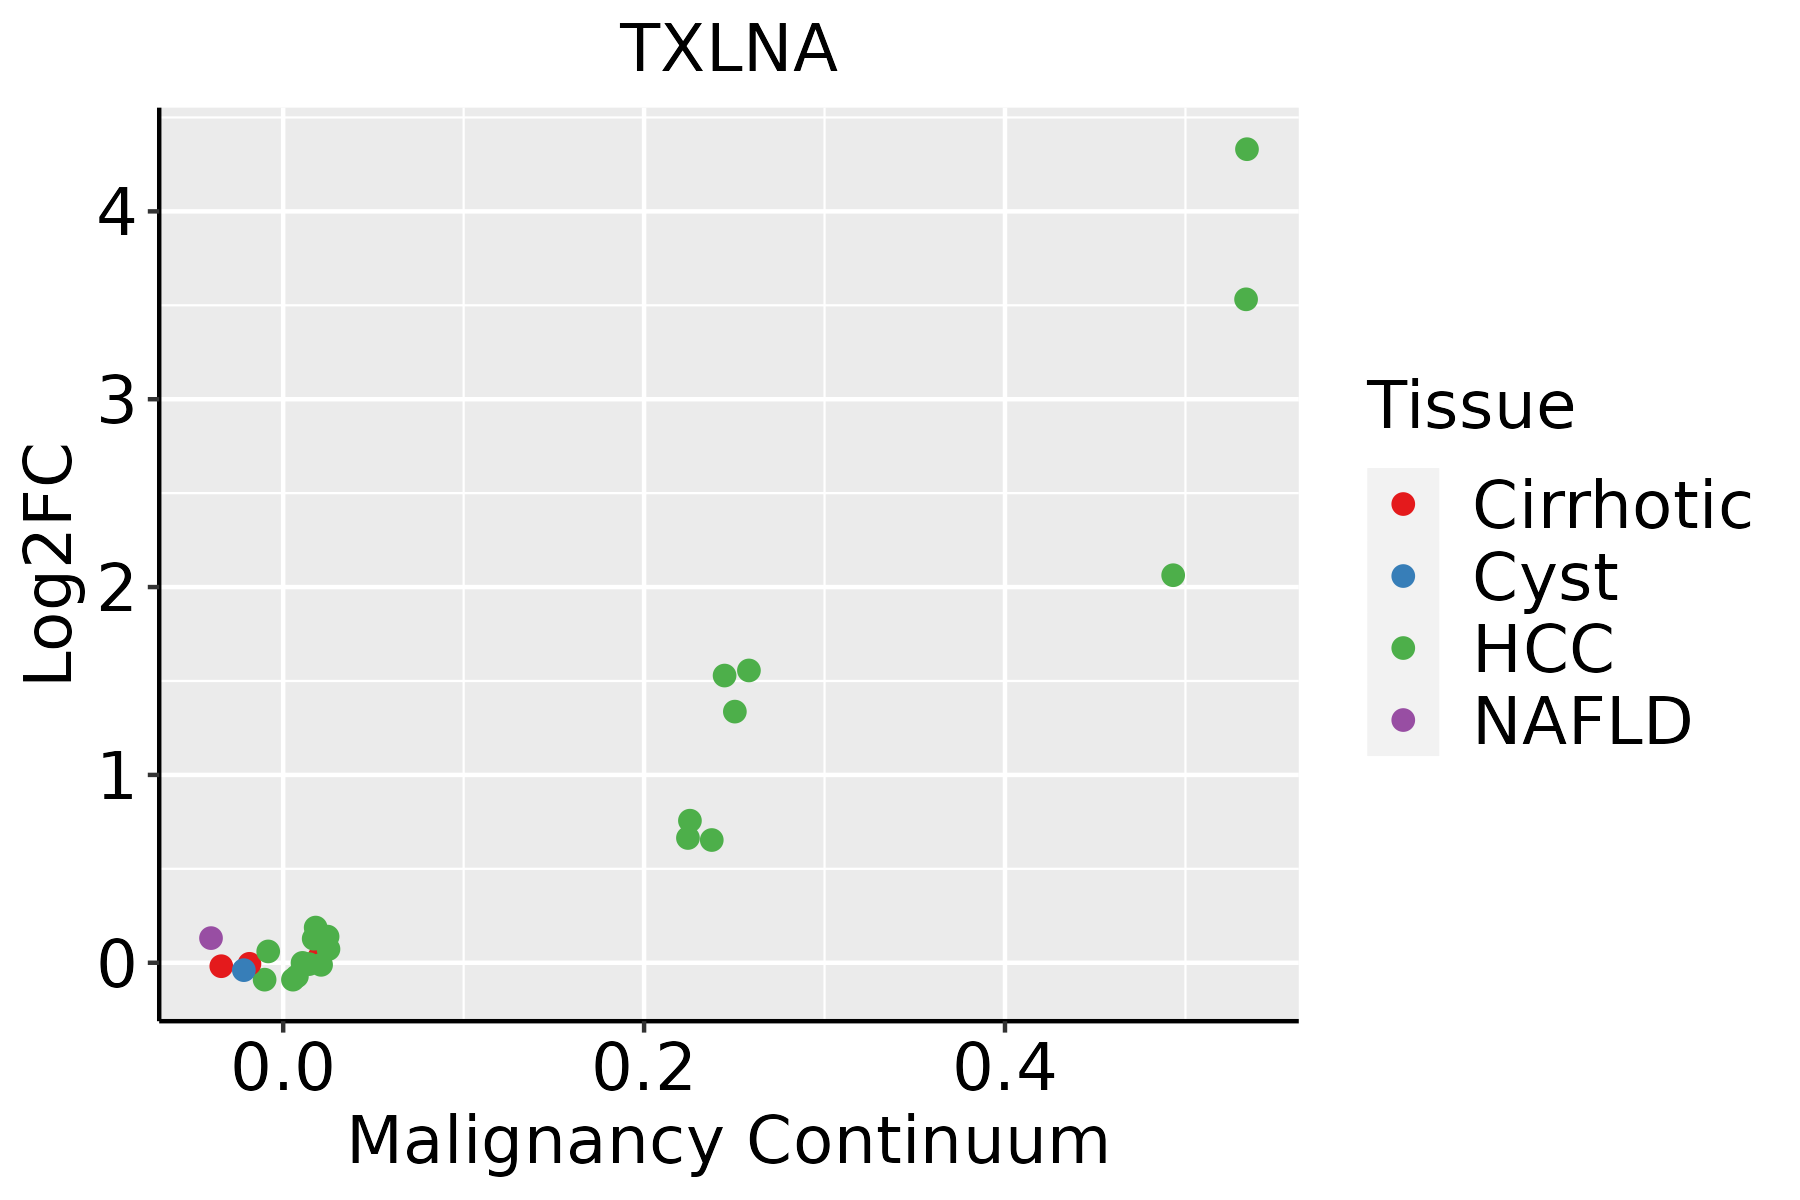 | HCC: Hepatocellular carcinoma |
| NAFLD: Non-alcoholic fatty liver disease | ||
| Oral Cavity |  | EOLP: Erosive Oral lichen planus |
| LP: leukoplakia | ||
| NEOLP: Non-erosive oral lichen planus | ||
| OSCC: Oral squamous cell carcinoma | ||
| Thyroid | 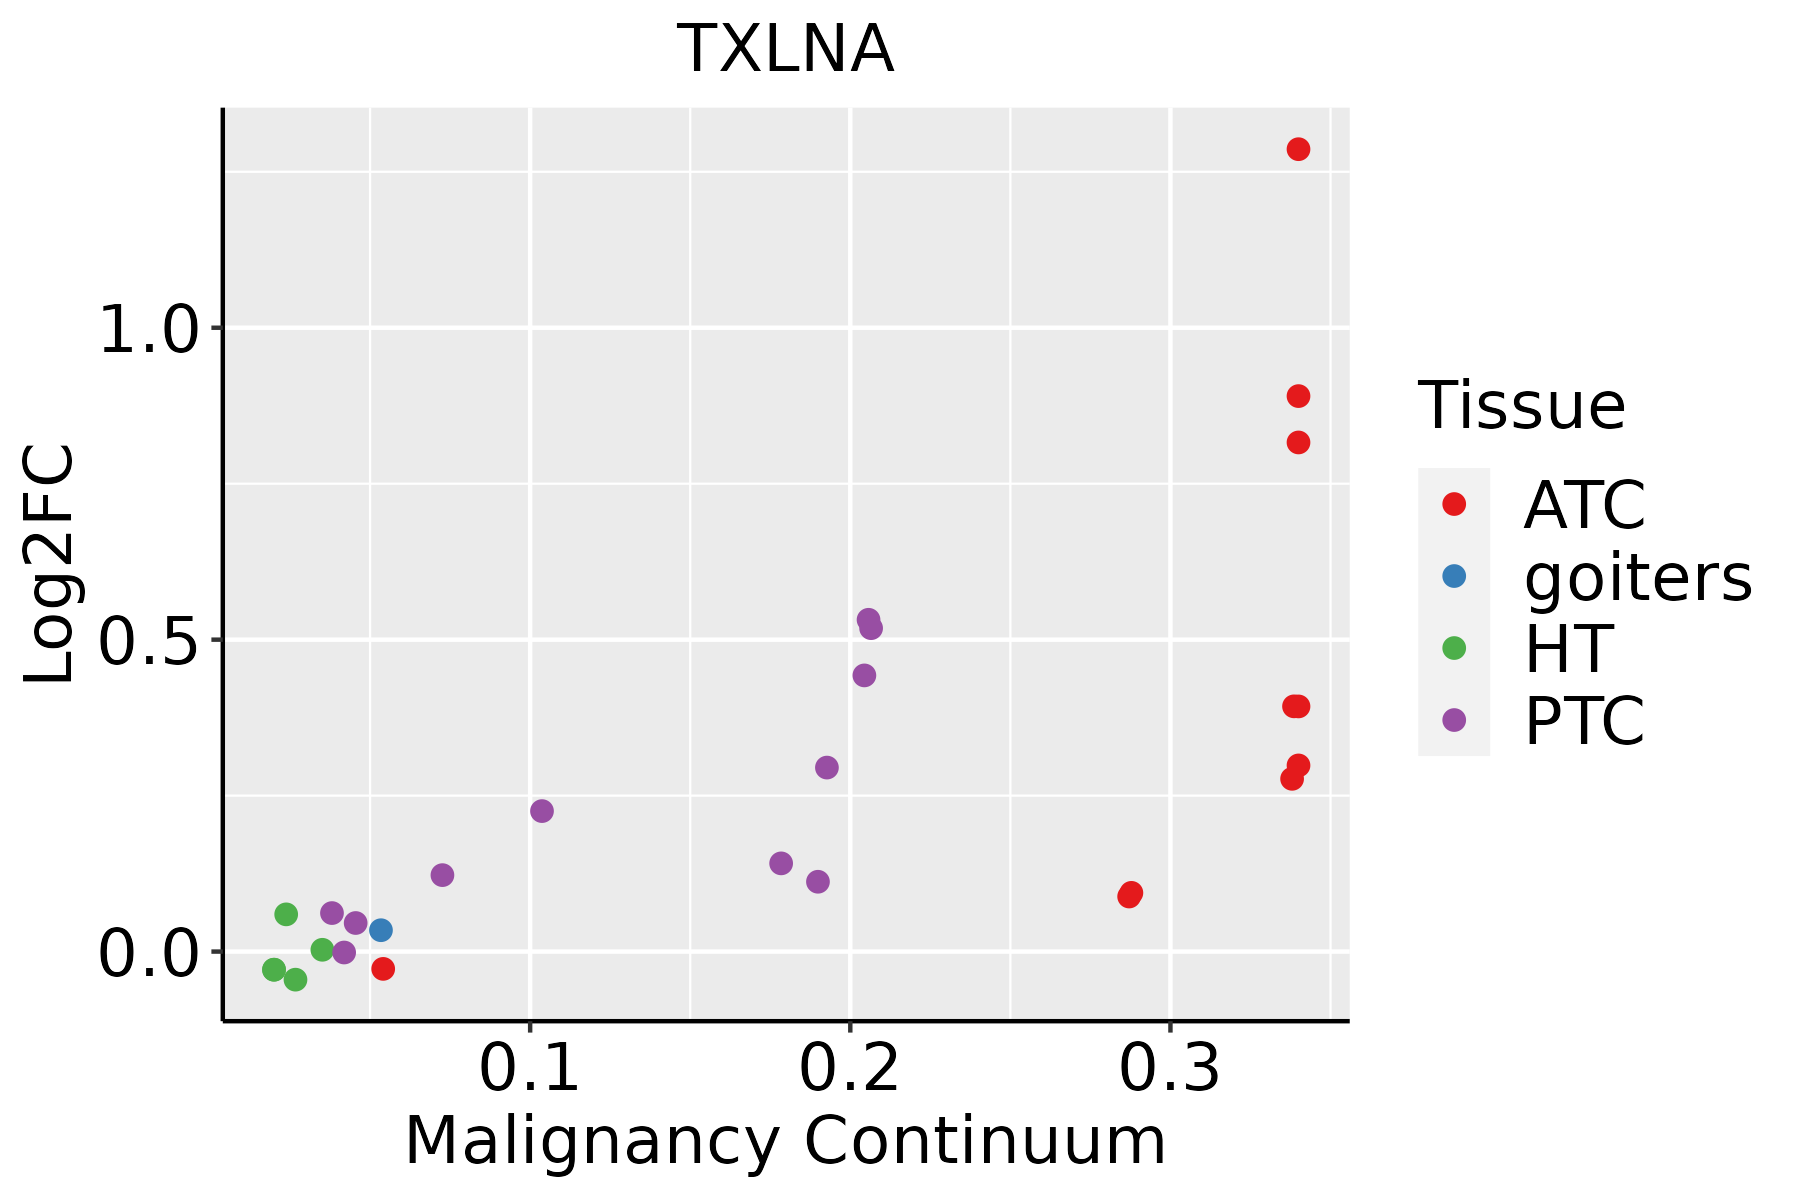 | ATC: Anaplastic thyroid cancer |
| HT: Hashimoto's thyroiditis | ||
| PTC: Papillary thyroid cancer |
| ∗log2FC in expression of this searched gene in stem-like cells from each diseased tissue sample relative to stem-like cells in normal samples in each tissue plotted against the malignancy continuum. Samples are colored based on if they are from different disease stage. |
Top |
Malignant transformation related pathway analysis |
| Find out the enriched GO biological processes and KEGG pathways involved in transition from healthy to precancer to cancer |
| Tissue | Disease Stage | Enriched GO biological Processes |
| Colorectum | AD |  |
| Colorectum | SER |  |
| Colorectum | MSS |  |
| Colorectum | MSI-H |  |
| Colorectum | FAP |  |
| ∗Top 15 enriched GO BP terms are showed in the bar plot of each disease state in each tissue. Each row represents a significant GO biological process which is colored according to the -log10(p.adjust). |
| Page: 1 2 3 4 5 6 7 8 9 |
| GO ID | Tissue | Disease Stage | Description | Gene Ratio | Bg Ratio | pvalue | p.adjust | Count |
| Page: 1 |
| Pathway ID | Tissue | Disease Stage | Description | Gene Ratio | Bg Ratio | pvalue | p.adjust | qvalue | Count |
| Page: 1 |
Top |
Cell-cell communication analysis |
| Identification of potential cell-cell interactions between two cell types and their ligand-receptor pairs for different disease states |
| Ligand | Receptor | LRpair | Pathway | Tissue | Disease Stage |
| Page: 1 |
Top |
Single-cell gene regulatory network inference analysis |
| Find out the significant the regulons (TFs) and the target genes of each regulon across cell types for different disease states |
| TF | Cell Type | Tissue | Disease Stage | Target Gene | RSS | Regulon Activity |
| ∗The dot plots of a searched regulon are shown for all cell subpopulations in each disease state of each tissue based on the regulon specific score inferred using pySCENIC and by calculating the average expression. |
| Page: 1 |
Top |
Somatic mutation of malignant transformation related genes |
| Annotation of somatic variants for genes involved in malignant transformation |
| Hugo Symbol | Variant Class | Variant Classification | dbSNP RS | HGVSc | HGVSp | HGVSp Short | SWISSPROT | BIOTYPE | SIFT | PolyPhen | Tumor Sample Barcode | Tissue | Histology | Sex | Age | Stage | Therapy Types | Drugs | Outcome |
| TXLNA | SNV | Missense_Mutation | novel | c.651N>C | p.Gln217His | p.Q217H | P40222 | protein_coding | deleterious(0.02) | possibly_damaging(0.823) | TCGA-BH-A2L8-01 | Breast | breast invasive carcinoma | Female | <65 | I/II | Chemotherapy | cytoxan | CR |
| TXLNA | SNV | Missense_Mutation | rs746949166 | c.400N>A | p.Glu134Lys | p.E134K | P40222 | protein_coding | tolerated(0.07) | probably_damaging(0.985) | TCGA-D8-A1XJ-01 | Breast | breast invasive carcinoma | Female | >=65 | III/IV | Hormone Therapy | tamoxiphen | SD |
| TXLNA | SNV | Missense_Mutation | c.995T>A | p.Leu332Gln | p.L332Q | P40222 | protein_coding | deleterious(0) | probably_damaging(0.999) | TCGA-E9-A1N8-01 | Breast | breast invasive carcinoma | Female | <65 | I/II | Chemotherapy | doxorubicin | SD | |
| TXLNA | insertion | Frame_Shift_Ins | novel | c.1502_1503insACCA | p.Glu502ProfsTer2 | p.E502Pfs*2 | P40222 | protein_coding | TCGA-A2-A0CT-01 | Breast | breast invasive carcinoma | Female | >=65 | I/II | Chemotherapy | cytoxan | SD | ||
| TXLNA | insertion | Frame_Shift_Ins | novel | c.1504_1505insCCTGGCTAATTTTTTCTTTCTTTTTTTTTTGTATTTTT | p.Glu502AlafsTer79 | p.E502Afs*79 | P40222 | protein_coding | TCGA-A2-A0CT-01 | Breast | breast invasive carcinoma | Female | >=65 | I/II | Chemotherapy | cytoxan | SD | ||
| TXLNA | insertion | Nonsense_Mutation | novel | c.250_251insCTTTTCCGTAAAATGG | p.Ser84ThrfsTer4 | p.S84Tfs*4 | P40222 | protein_coding | TCGA-A8-A09C-01 | Breast | breast invasive carcinoma | Female | >=65 | I/II | Unknown | Unknown | SD | ||
| TXLNA | deletion | Frame_Shift_Del | novel | c.355delA | p.Arg119GlyfsTer10 | p.R119Gfs*10 | P40222 | protein_coding | TCGA-EW-A2FV-01 | Breast | breast invasive carcinoma | Female | <65 | III/IV | Chemotherapy | docetaxel | SD | ||
| TXLNA | SNV | Missense_Mutation | rs780644587 | c.205C>T | p.Arg69Cys | p.R69C | P40222 | protein_coding | tolerated(0.21) | benign(0) | TCGA-2W-A8YY-01 | Cervix | cervical & endocervical cancer | Female | <65 | I/II | Chemotherapy | cisplatin | CR |
| TXLNA | SNV | Missense_Mutation | rs776440607 | c.809G>A | p.Arg270His | p.R270H | P40222 | protein_coding | deleterious(0.01) | probably_damaging(0.998) | TCGA-2W-A8YY-01 | Cervix | cervical & endocervical cancer | Female | <65 | I/II | Chemotherapy | cisplatin | CR |
| TXLNA | SNV | Missense_Mutation | novel | c.1378C>A | p.Leu460Met | p.L460M | P40222 | protein_coding | deleterious(0.01) | probably_damaging(0.992) | TCGA-2W-A8YY-01 | Cervix | cervical & endocervical cancer | Female | <65 | I/II | Chemotherapy | cisplatin | CR |
| Page: 1 2 3 4 5 6 |
Top |
Related drugs of malignant transformation related genes |
| Identification of chemicals and drugs interact with genes involved in malignant transfromation |
| (DGIdb 4.0) |
| Entrez ID | Symbol | Category | Interaction Types | Drug Claim Name | Drug Name | PMIDs |
| Page: 1 |

Copyright 2023-Present -The University of Texas Health Science Center at Houston |