
|
|||||
|
 | |
| |
| |
| |
| |
| |
|
Gene: TWIST2 |
Gene summary for TWIST2 |
| Gene information | Species | Human | Gene symbol | TWIST2 | Gene ID | 117581 |
| Gene name | twist family bHLH transcription factor 2 | |
| Gene Alias | AMS | |
| Cytomap | 2q37.3 | |
| Gene Type | protein-coding | GO ID | GO:0001503 | UniProtAcc | A0A024R4D4 |
Top |
Malignant transformation analysis |
| Identification of the aberrant gene expression in precancerous and cancerous lesions by comparing the gene expression of stem-like cells in diseased tissues with normal stem cells |
| Entrez ID | Symbol | Replicates | Species | Organ | Tissue | Adj P-value | Log2FC | Malignancy |
| 117581 | TWIST2 | AEH-subject1 | Human | Endometrium | AEH | 1.43e-25 | -5.53e-01 | -0.3059 |
| 117581 | TWIST2 | AEH-subject2 | Human | Endometrium | AEH | 3.24e-30 | -5.98e-01 | -0.2525 |
| 117581 | TWIST2 | AEH-subject3 | Human | Endometrium | AEH | 3.25e-22 | -5.11e-01 | -0.2576 |
| 117581 | TWIST2 | AEH-subject4 | Human | Endometrium | AEH | 2.26e-06 | -3.93e-01 | -0.2657 |
| 117581 | TWIST2 | AEH-subject5 | Human | Endometrium | AEH | 6.52e-34 | -5.99e-01 | -0.2953 |
| 117581 | TWIST2 | EEC-subject1 | Human | Endometrium | EEC | 2.89e-24 | -5.80e-01 | -0.2682 |
| 117581 | TWIST2 | EEC-subject2 | Human | Endometrium | EEC | 3.80e-37 | -6.03e-01 | -0.2607 |
| 117581 | TWIST2 | EEC-subject3 | Human | Endometrium | EEC | 2.04e-27 | -5.44e-01 | -0.2525 |
| 117581 | TWIST2 | EEC-subject4 | Human | Endometrium | EEC | 4.10e-25 | -5.50e-01 | -0.2571 |
| 117581 | TWIST2 | EEC-subject5 | Human | Endometrium | EEC | 3.87e-24 | -5.59e-01 | -0.249 |
| 117581 | TWIST2 | GSM5276934 | Human | Endometrium | EEC | 7.68e-08 | -4.48e-01 | -0.0913 |
| 117581 | TWIST2 | GSM5276935 | Human | Endometrium | EEC | 9.53e-32 | -5.97e-01 | -0.123 |
| 117581 | TWIST2 | GSM5276937 | Human | Endometrium | EEC | 4.72e-03 | -3.21e-01 | -0.0897 |
| 117581 | TWIST2 | GSM6177620_NYU_UCEC1_lib1_lib1 | Human | Endometrium | EEC | 6.16e-25 | -5.52e-01 | -0.1869 |
| 117581 | TWIST2 | GSM6177620_NYU_UCEC1_lib2_lib2 | Human | Endometrium | EEC | 6.78e-25 | -5.56e-01 | -0.1875 |
| 117581 | TWIST2 | GSM6177620_NYU_UCEC1_lib3_lib3 | Human | Endometrium | EEC | 7.61e-26 | -5.91e-01 | -0.1883 |
| 117581 | TWIST2 | GSM6177621_NYU_UCEC2_lib1_lib1 | Human | Endometrium | EEC | 3.80e-37 | -5.99e-01 | -0.1934 |
| 117581 | TWIST2 | GSM6177622_NYU_UCEC3_lib1_lib1 | Human | Endometrium | EEC | 1.06e-35 | -5.97e-01 | -0.1917 |
| 117581 | TWIST2 | GSM6177622_NYU_UCEC3_lib2_lib2 | Human | Endometrium | EEC | 1.72e-36 | -6.06e-01 | -0.1916 |
| 117581 | TWIST2 | GSM6177623_NYU_UCEC3_Vis | Human | Endometrium | EEC | 2.62e-11 | -5.05e-01 | -0.1269 |
| Page: 1 2 3 |
| Tissue | Expression Dynamics | Abbreviation |
| Endometrium | 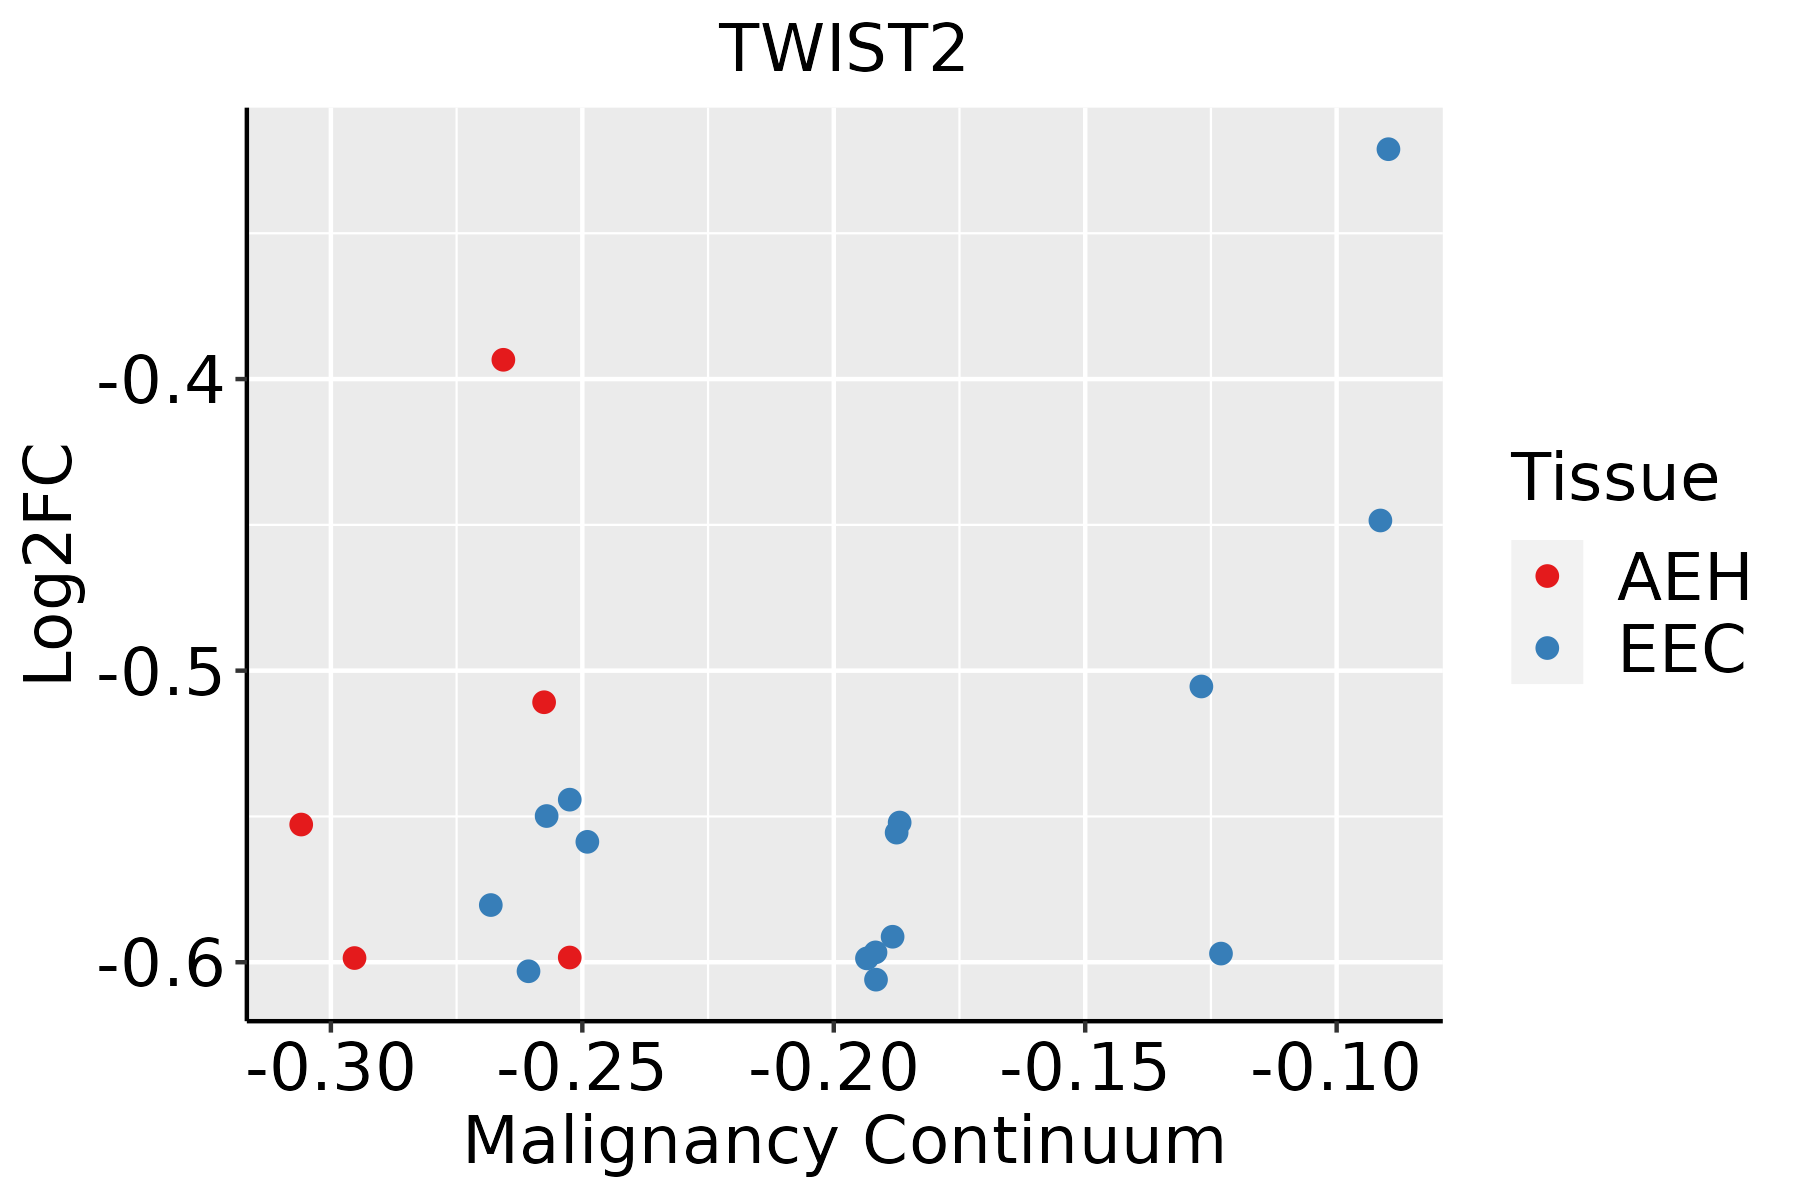 | AEH: Atypical endometrial hyperplasia |
| EEC: Endometrioid Cancer | ||
| Esophagus | 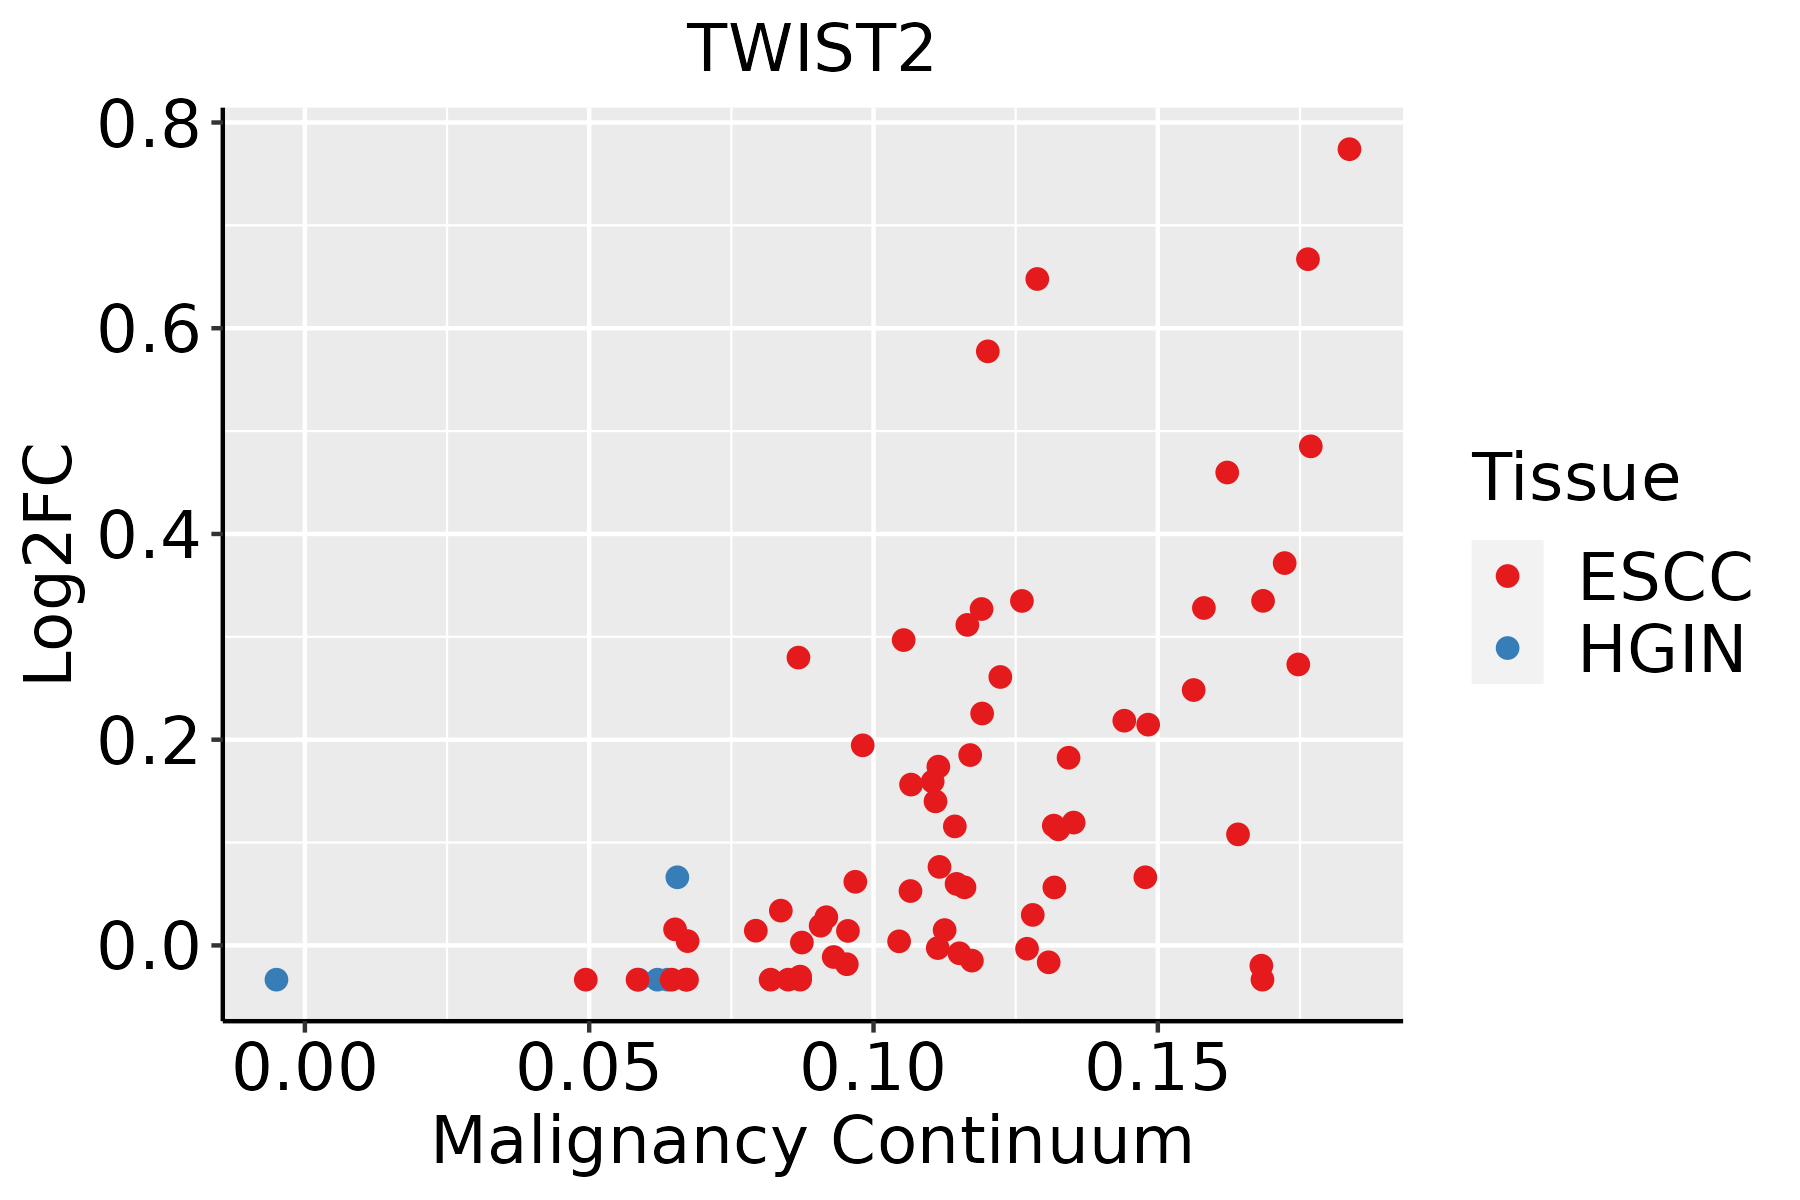 | ESCC: Esophageal squamous cell carcinoma |
| HGIN: High-grade intraepithelial neoplasias | ||
| LGIN: Low-grade intraepithelial neoplasias | ||
| Oral Cavity | 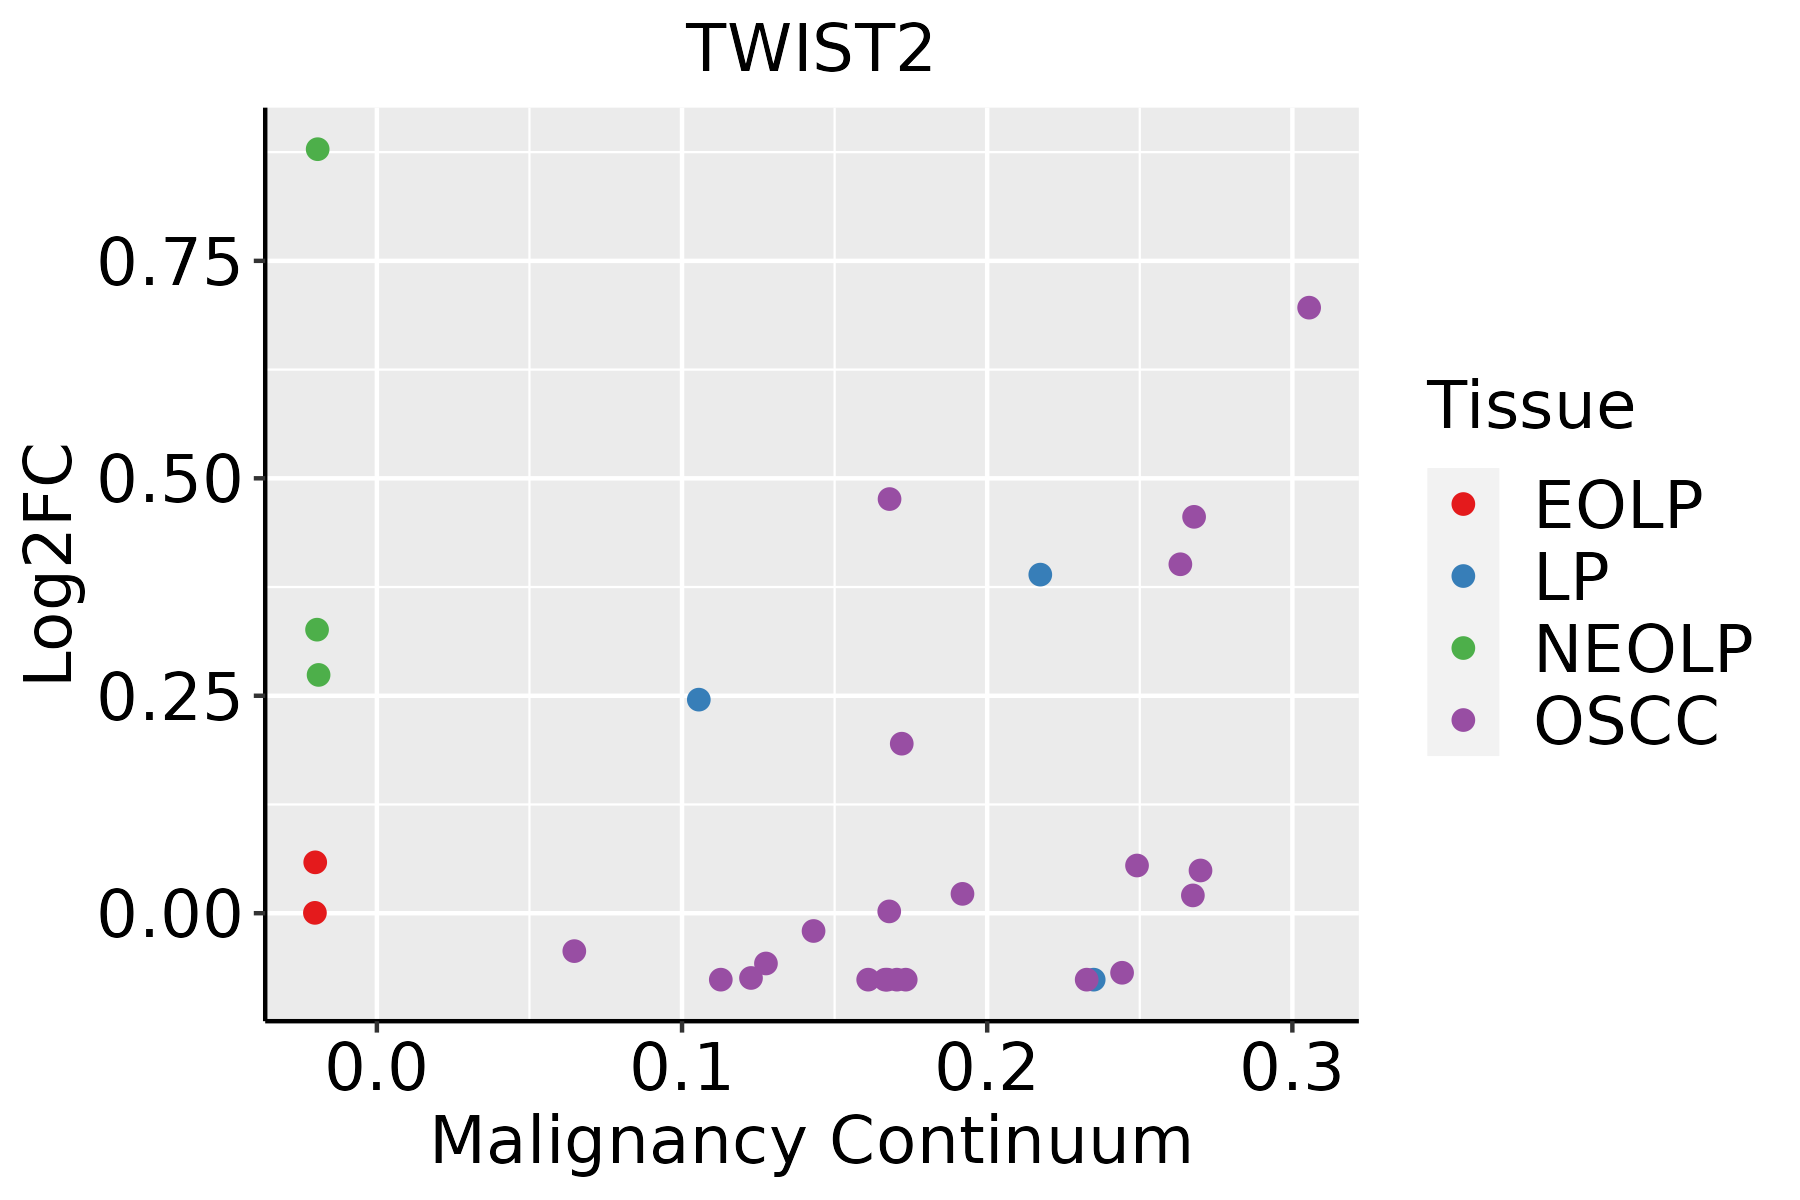 | EOLP: Erosive Oral lichen planus |
| LP: leukoplakia | ||
| NEOLP: Non-erosive oral lichen planus | ||
| OSCC: Oral squamous cell carcinoma | ||
| Thyroid | 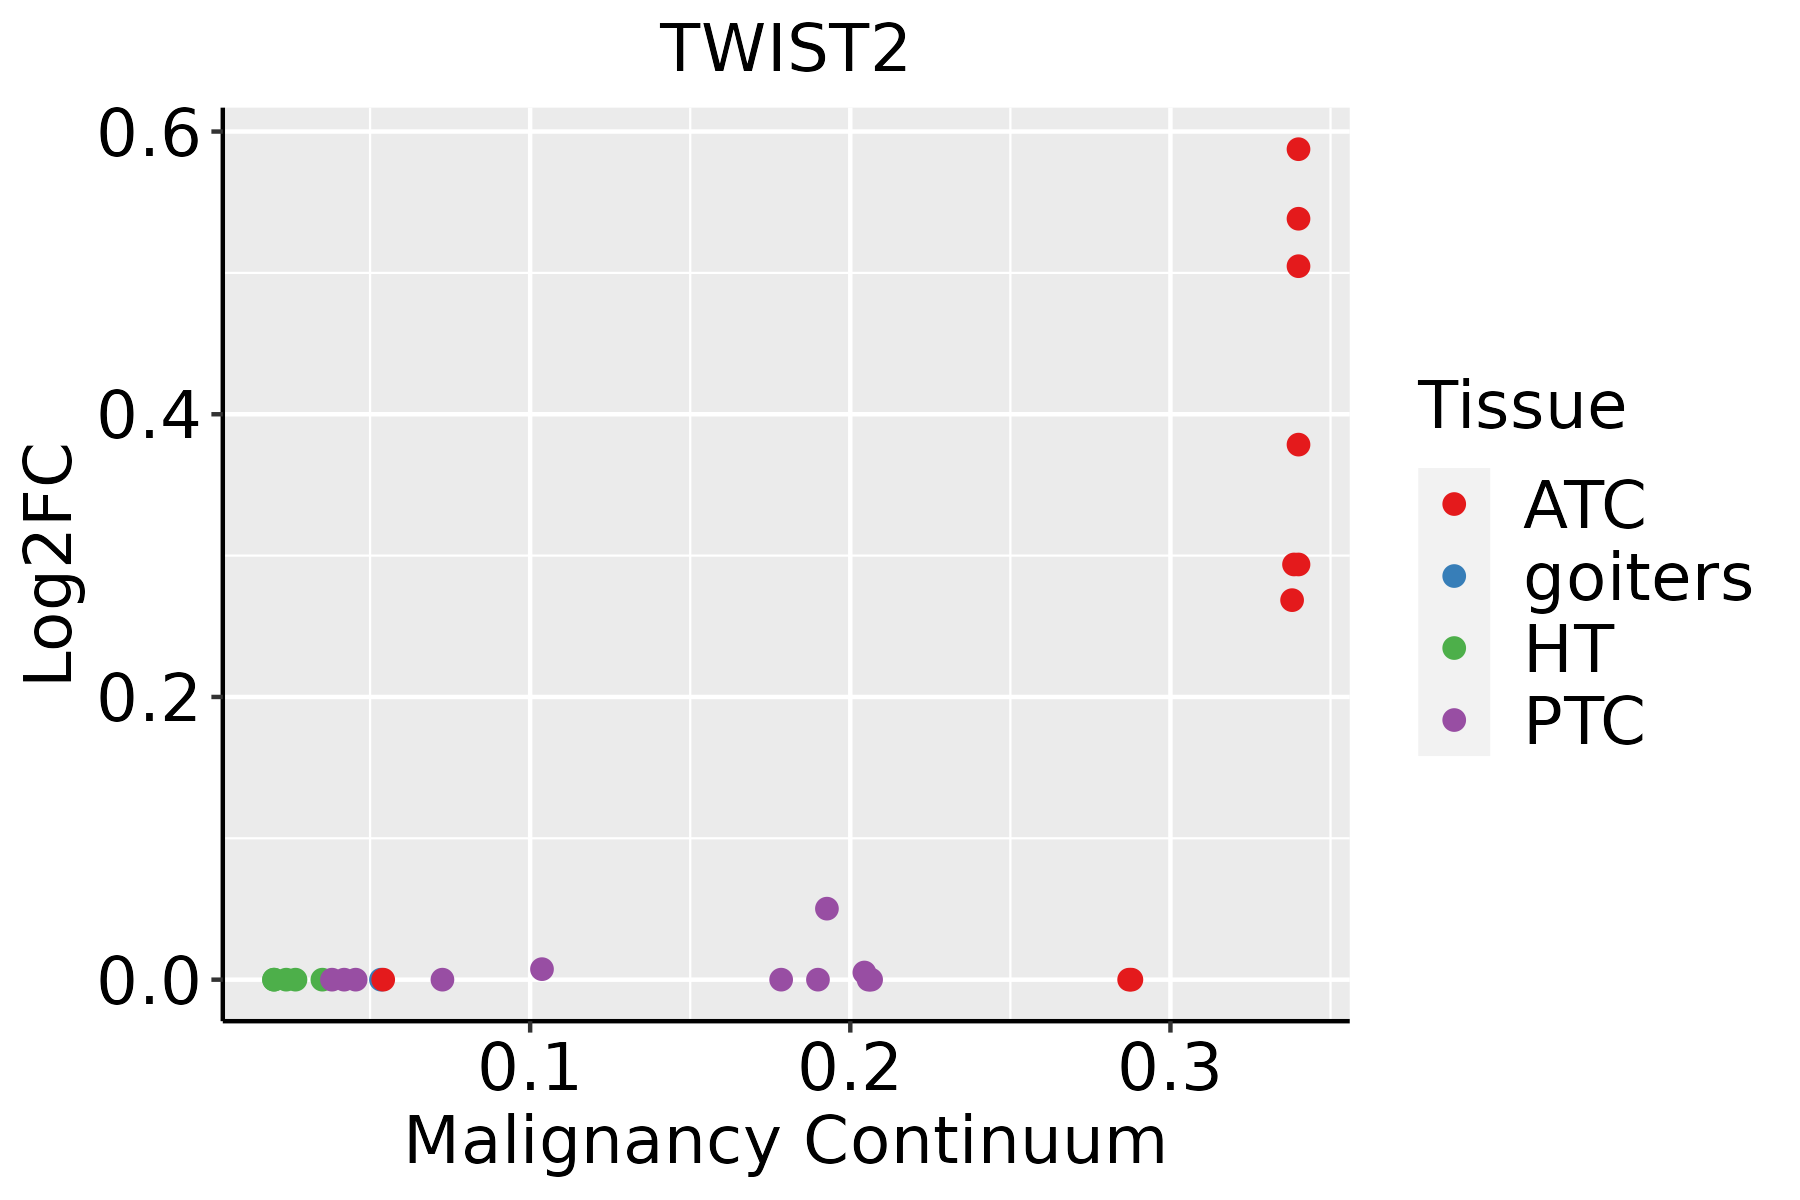 | ATC: Anaplastic thyroid cancer |
| HT: Hashimoto's thyroiditis | ||
| PTC: Papillary thyroid cancer |
| ∗log2FC in expression of this searched gene in stem-like cells from each diseased tissue sample relative to stem-like cells in normal samples in each tissue plotted against the malignancy continuum. Samples are colored based on if they are from different disease stage. |
Top |
Malignant transformation related pathway analysis |
| Find out the enriched GO biological processes and KEGG pathways involved in transition from healthy to precancer to cancer |
| Tissue | Disease Stage | Enriched GO biological Processes |
| Colorectum | AD |  |
| Colorectum | SER |  |
| Colorectum | MSS |  |
| Colorectum | MSI-H |  |
| Colorectum | FAP |  |
| ∗Top 15 enriched GO BP terms are showed in the bar plot of each disease state in each tissue. Each row represents a significant GO biological process which is colored according to the -log10(p.adjust). |
| Page: 1 2 3 4 5 6 7 8 9 |
| GO ID | Tissue | Disease Stage | Description | Gene Ratio | Bg Ratio | pvalue | p.adjust | Count |
| GO:00016498 | Endometrium | AEH | osteoblast differentiation | 52/2100 | 229/18723 | 4.74e-07 | 1.92e-05 | 52 |
| GO:00015038 | Endometrium | AEH | ossification | 78/2100 | 408/18723 | 1.54e-06 | 4.85e-05 | 78 |
| GO:00456672 | Endometrium | AEH | regulation of osteoblast differentiation | 27/2100 | 132/18723 | 1.40e-03 | 1.18e-02 | 27 |
| GO:000164914 | Endometrium | EEC | osteoblast differentiation | 53/2168 | 229/18723 | 5.32e-07 | 2.02e-05 | 53 |
| GO:000150313 | Endometrium | EEC | ossification | 79/2168 | 408/18723 | 2.72e-06 | 7.67e-05 | 79 |
| GO:00456671 | Endometrium | EEC | regulation of osteoblast differentiation | 27/2168 | 132/18723 | 2.23e-03 | 1.66e-02 | 27 |
| GO:000164918 | Esophagus | ESCC | osteoblast differentiation | 140/8552 | 229/18723 | 1.63e-06 | 1.95e-05 | 140 |
| GO:000150317 | Esophagus | ESCC | ossification | 232/8552 | 408/18723 | 3.00e-06 | 3.40e-05 | 232 |
| GO:00456675 | Esophagus | ESCC | regulation of osteoblast differentiation | 77/8552 | 132/18723 | 2.28e-03 | 1.00e-02 | 77 |
| GO:000150310 | Oral cavity | OSCC | ossification | 203/7305 | 408/18723 | 5.54e-06 | 6.19e-05 | 203 |
| GO:000164910 | Oral cavity | OSCC | osteoblast differentiation | 118/7305 | 229/18723 | 7.51e-05 | 5.85e-04 | 118 |
| GO:00456674 | Oral cavity | OSCC | regulation of osteoblast differentiation | 65/7305 | 132/18723 | 1.06e-02 | 3.60e-02 | 65 |
| GO:000150331 | Oral cavity | NEOLP | ossification | 81/2005 | 408/18723 | 2.67e-08 | 1.15e-06 | 81 |
| GO:000164931 | Oral cavity | NEOLP | osteoblast differentiation | 47/2005 | 229/18723 | 8.59e-06 | 1.66e-04 | 47 |
| GO:004566712 | Oral cavity | NEOLP | regulation of osteoblast differentiation | 25/2005 | 132/18723 | 3.27e-03 | 1.95e-02 | 25 |
| GO:000150332 | Thyroid | ATC | ossification | 206/6293 | 408/18723 | 9.23e-13 | 3.95e-11 | 206 |
| GO:000164932 | Thyroid | ATC | osteoblast differentiation | 122/6293 | 229/18723 | 6.04e-10 | 1.60e-08 | 122 |
| GO:004566721 | Thyroid | ATC | regulation of osteoblast differentiation | 66/6293 | 132/18723 | 7.03e-05 | 5.36e-04 | 66 |
| Page: 1 |
| Pathway ID | Tissue | Disease Stage | Description | Gene Ratio | Bg Ratio | pvalue | p.adjust | qvalue | Count |
| hsa0520518 | Endometrium | AEH | Proteoglycans in cancer | 53/1197 | 205/8465 | 5.43e-06 | 6.53e-05 | 4.78e-05 | 53 |
| hsa0520519 | Endometrium | AEH | Proteoglycans in cancer | 53/1197 | 205/8465 | 5.43e-06 | 6.53e-05 | 4.78e-05 | 53 |
| hsa0520524 | Endometrium | EEC | Proteoglycans in cancer | 52/1237 | 205/8465 | 3.01e-05 | 3.19e-04 | 2.38e-04 | 52 |
| hsa0520534 | Endometrium | EEC | Proteoglycans in cancer | 52/1237 | 205/8465 | 3.01e-05 | 3.19e-04 | 2.38e-04 | 52 |
| hsa0520529 | Esophagus | ESCC | Proteoglycans in cancer | 138/4205 | 205/8465 | 1.79e-07 | 1.40e-06 | 7.15e-07 | 138 |
| hsa0520537 | Esophagus | ESCC | Proteoglycans in cancer | 138/4205 | 205/8465 | 1.79e-07 | 1.40e-06 | 7.15e-07 | 138 |
| hsa0520526 | Oral cavity | OSCC | Proteoglycans in cancer | 128/3704 | 205/8465 | 4.00e-08 | 3.12e-07 | 1.59e-07 | 128 |
| hsa05205111 | Oral cavity | OSCC | Proteoglycans in cancer | 128/3704 | 205/8465 | 4.00e-08 | 3.12e-07 | 1.59e-07 | 128 |
| hsa0520562 | Oral cavity | NEOLP | Proteoglycans in cancer | 56/1112 | 205/8465 | 3.49e-08 | 5.85e-07 | 3.68e-07 | 56 |
| hsa0520572 | Oral cavity | NEOLP | Proteoglycans in cancer | 56/1112 | 205/8465 | 3.49e-08 | 5.85e-07 | 3.68e-07 | 56 |
| Page: 1 |
Top |
Cell-cell communication analysis |
| Identification of potential cell-cell interactions between two cell types and their ligand-receptor pairs for different disease states |
| Ligand | Receptor | LRpair | Pathway | Tissue | Disease Stage |
| Page: 1 |
Top |
Single-cell gene regulatory network inference analysis |
| Find out the significant the regulons (TFs) and the target genes of each regulon across cell types for different disease states |
| TF | Cell Type | Tissue | Disease Stage | Target Gene | RSS | Regulon Activity |
| TWIST2 | ICAF | Breast | ADJ | PTGES,RAMP1,MMP2, etc. | 7.42e-01 |  |
| TWIST2 | ICAF | Breast | Healthy | PTGES,RAMP1,MMP2, etc. | 2.37e-01 |  |
| TWIST2 | CAF | Breast | Healthy | PTGES,RAMP1,MMP2, etc. | 4.46e-01 | |
| TWIST2 | MSC | Breast | Healthy | PTGES,RAMP1,MMP2, etc. | 5.34e-02 | |
| TWIST2 | ICAF | Breast | Precancer | PTGES,RAMP1,MMP2, etc. | 5.13e-01 |  |
| TWIST2 | BAS | Cervix | N_HPV | CACNA1C,LUM,LOXL2, etc. | 1.75e-01 |  |
| TWIST2 | LUM | Endometrium | Healthy | LGALS1,PTCH1,TMSB4X, etc. | 3.48e-01 |  |
| TWIST2 | BAS | Endometrium | Healthy | LGALS1,PTCH1,TMSB4X, etc. | 3.00e-01 | |
| TWIST2 | STM | Esophagus | LGIN | PRR16,IGFBP4,C1S, etc. | 6.93e-01 |  |
| TWIST2 | ICAF | Esophagus | ESCC | MASP1,IL24,WNT5A, etc. | 3.18e-01 |  |
| ∗The dot plots of a searched regulon are shown for all cell subpopulations in each disease state of each tissue based on the regulon specific score inferred using pySCENIC and by calculating the average expression. |
| Page: 1 2 3 |
Top |
Somatic mutation of malignant transformation related genes |
| Annotation of somatic variants for genes involved in malignant transformation |
| Hugo Symbol | Variant Class | Variant Classification | dbSNP RS | HGVSc | HGVSp | HGVSp Short | SWISSPROT | BIOTYPE | SIFT | PolyPhen | Tumor Sample Barcode | Tissue | Histology | Sex | Age | Stage | Therapy Types | Drugs | Outcome |
| TWIST2 | SNV | Missense_Mutation | c.183C>G | p.Phe61Leu | p.F61L | Q8WVJ9 | protein_coding | tolerated(0.33) | benign(0.001) | TCGA-EK-A2PG-01 | Cervix | cervical & endocervical cancer | Female | >=65 | I/II | Unknown | Unknown | SD | |
| TWIST2 | SNV | Missense_Mutation | novel | c.337N>C | p.Tyr113His | p.Y113H | Q8WVJ9 | protein_coding | deleterious(0) | probably_damaging(1) | TCGA-5M-AAT6-01 | Colorectum | colon adenocarcinoma | Female | <65 | III/IV | Unknown | Unknown | PD |
| TWIST2 | SNV | Missense_Mutation | novel | c.425N>A | p.Ser142Asn | p.S142N | Q8WVJ9 | protein_coding | deleterious(0.01) | probably_damaging(0.98) | TCGA-AA-A022-01 | Colorectum | colon adenocarcinoma | Female | >=65 | I/II | Unknown | Unknown | SD |
| TWIST2 | SNV | Missense_Mutation | c.298N>G | p.Lys100Glu | p.K100E | Q8WVJ9 | protein_coding | deleterious(0) | probably_damaging(1) | TCGA-AD-6889-01 | Colorectum | colon adenocarcinoma | Male | >=65 | I/II | Chemotherapy | xeloda | PD | |
| TWIST2 | SNV | Missense_Mutation | c.227N>A | p.Arg76His | p.R76H | Q8WVJ9 | protein_coding | deleterious(0) | probably_damaging(1) | TCGA-A5-A0GI-01 | Endometrium | uterine corpus endometrioid carcinoma | Female | <65 | I/II | Unknown | Unknown | SD | |
| TWIST2 | SNV | Missense_Mutation | novel | c.419N>A | p.Arg140His | p.R140H | Q8WVJ9 | protein_coding | deleterious(0.01) | benign(0.038) | TCGA-AJ-A2QO-01 | Endometrium | uterine corpus endometrioid carcinoma | Female | >=65 | I/II | Unknown | Unknown | SD |
| TWIST2 | SNV | Missense_Mutation | c.435C>A | p.Phe145Leu | p.F145L | Q8WVJ9 | protein_coding | deleterious(0.02) | probably_damaging(0.991) | TCGA-BS-A0UV-01 | Endometrium | uterine corpus endometrioid carcinoma | Female | <65 | III/IV | Unknown | Unknown | SD | |
| TWIST2 | SNV | Missense_Mutation | novel | c.421C>A | p.Leu141Ile | p.L141I | Q8WVJ9 | protein_coding | deleterious(0.03) | possibly_damaging(0.505) | TCGA-DF-A2KU-01 | Endometrium | uterine corpus endometrioid carcinoma | Female | Unknown | I/II | Unknown | Unknown | SD |
| TWIST2 | SNV | Missense_Mutation | novel | c.186G>T | p.Glu62Asp | p.E62D | Q8WVJ9 | protein_coding | tolerated(0.12) | benign(0.101) | TCGA-EO-A22X-01 | Endometrium | uterine corpus endometrioid carcinoma | Female | <65 | III/IV | Unspecific | Carboplatin | Complete Response |
| TWIST2 | SNV | Missense_Mutation | novel | c.226C>A | p.Arg76Ser | p.R76S | Q8WVJ9 | protein_coding | deleterious(0) | probably_damaging(1) | TCGA-58-8390-01 | Lung | lung squamous cell carcinoma | Male | >=65 | I/II | Unknown | Unknown | SD |
| Page: 1 |
Top |
Related drugs of malignant transformation related genes |
| Identification of chemicals and drugs interact with genes involved in malignant transfromation |
| (DGIdb 4.0) |
| Entrez ID | Symbol | Category | Interaction Types | Drug Claim Name | Drug Name | PMIDs |
| Page: 1 |

Copyright 2023-Present -The University of Texas Health Science Center at Houston |