
|
|||||
|
 | |
| |
| |
| |
| |
| |
|
Gene: TWIST1 |
Gene summary for TWIST1 |
| Gene information | Species | Human | Gene symbol | TWIST1 | Gene ID | 7291 |
| Gene name | twist family bHLH transcription factor 1 | |
| Gene Alias | ACS3 | |
| Cytomap | 7p21.1 | |
| Gene Type | protein-coding | GO ID | GO:0000122 | UniProtAcc | Q15672 |
Top |
Malignant transformation analysis |
| Identification of the aberrant gene expression in precancerous and cancerous lesions by comparing the gene expression of stem-like cells in diseased tissues with normal stem cells |
| Entrez ID | Symbol | Replicates | Species | Organ | Tissue | Adj P-value | Log2FC | Malignancy |
| 7291 | TWIST1 | C30 | Human | Oral cavity | OSCC | 6.80e-05 | 4.27e-01 | 0.3055 |
| 7291 | TWIST1 | C43 | Human | Oral cavity | OSCC | 2.55e-05 | 6.19e-03 | 0.1704 |
| 7291 | TWIST1 | EOLP-1 | Human | Oral cavity | EOLP | 5.02e-03 | 1.80e-01 | -0.0202 |
| 7291 | TWIST1 | NEOLP-1 | Human | Oral cavity | NEOLP | 4.84e-18 | 6.42e-01 | -0.0194 |
| 7291 | TWIST1 | NEOLP-2 | Human | Oral cavity | NEOLP | 4.77e-22 | 5.80e-01 | -0.0196 |
| 7291 | TWIST1 | NEOLP-3 | Human | Oral cavity | NEOLP | 1.28e-12 | 4.59e-01 | -0.0191 |
| 7291 | TWIST1 | SYSMH1 | Human | Oral cavity | OSCC | 2.45e-02 | -1.99e-01 | 0.1127 |
| 7291 | TWIST1 | SYSMH4 | Human | Oral cavity | OSCC | 7.87e-03 | -2.08e-01 | 0.1226 |
| 7291 | TWIST1 | SYSMH6 | Human | Oral cavity | OSCC | 3.73e-03 | -2.00e-01 | 0.1275 |
| 7291 | TWIST1 | ATC12 | Human | Thyroid | ATC | 7.59e-25 | 5.16e-01 | 0.34 |
| 7291 | TWIST1 | ATC13 | Human | Thyroid | ATC | 1.61e-39 | 6.97e-01 | 0.34 |
| 7291 | TWIST1 | ATC2 | Human | Thyroid | ATC | 5.68e-36 | 2.26e+00 | 0.34 |
| 7291 | TWIST1 | ATC4 | Human | Thyroid | ATC | 1.32e-34 | 6.49e-01 | 0.34 |
| 7291 | TWIST1 | ATC5 | Human | Thyroid | ATC | 3.53e-40 | 7.70e-01 | 0.34 |
| Page: 1 |
| Tissue | Expression Dynamics | Abbreviation |
| Oral Cavity |  | EOLP: Erosive Oral lichen planus |
| LP: leukoplakia | ||
| NEOLP: Non-erosive oral lichen planus | ||
| OSCC: Oral squamous cell carcinoma | ||
| Thyroid | 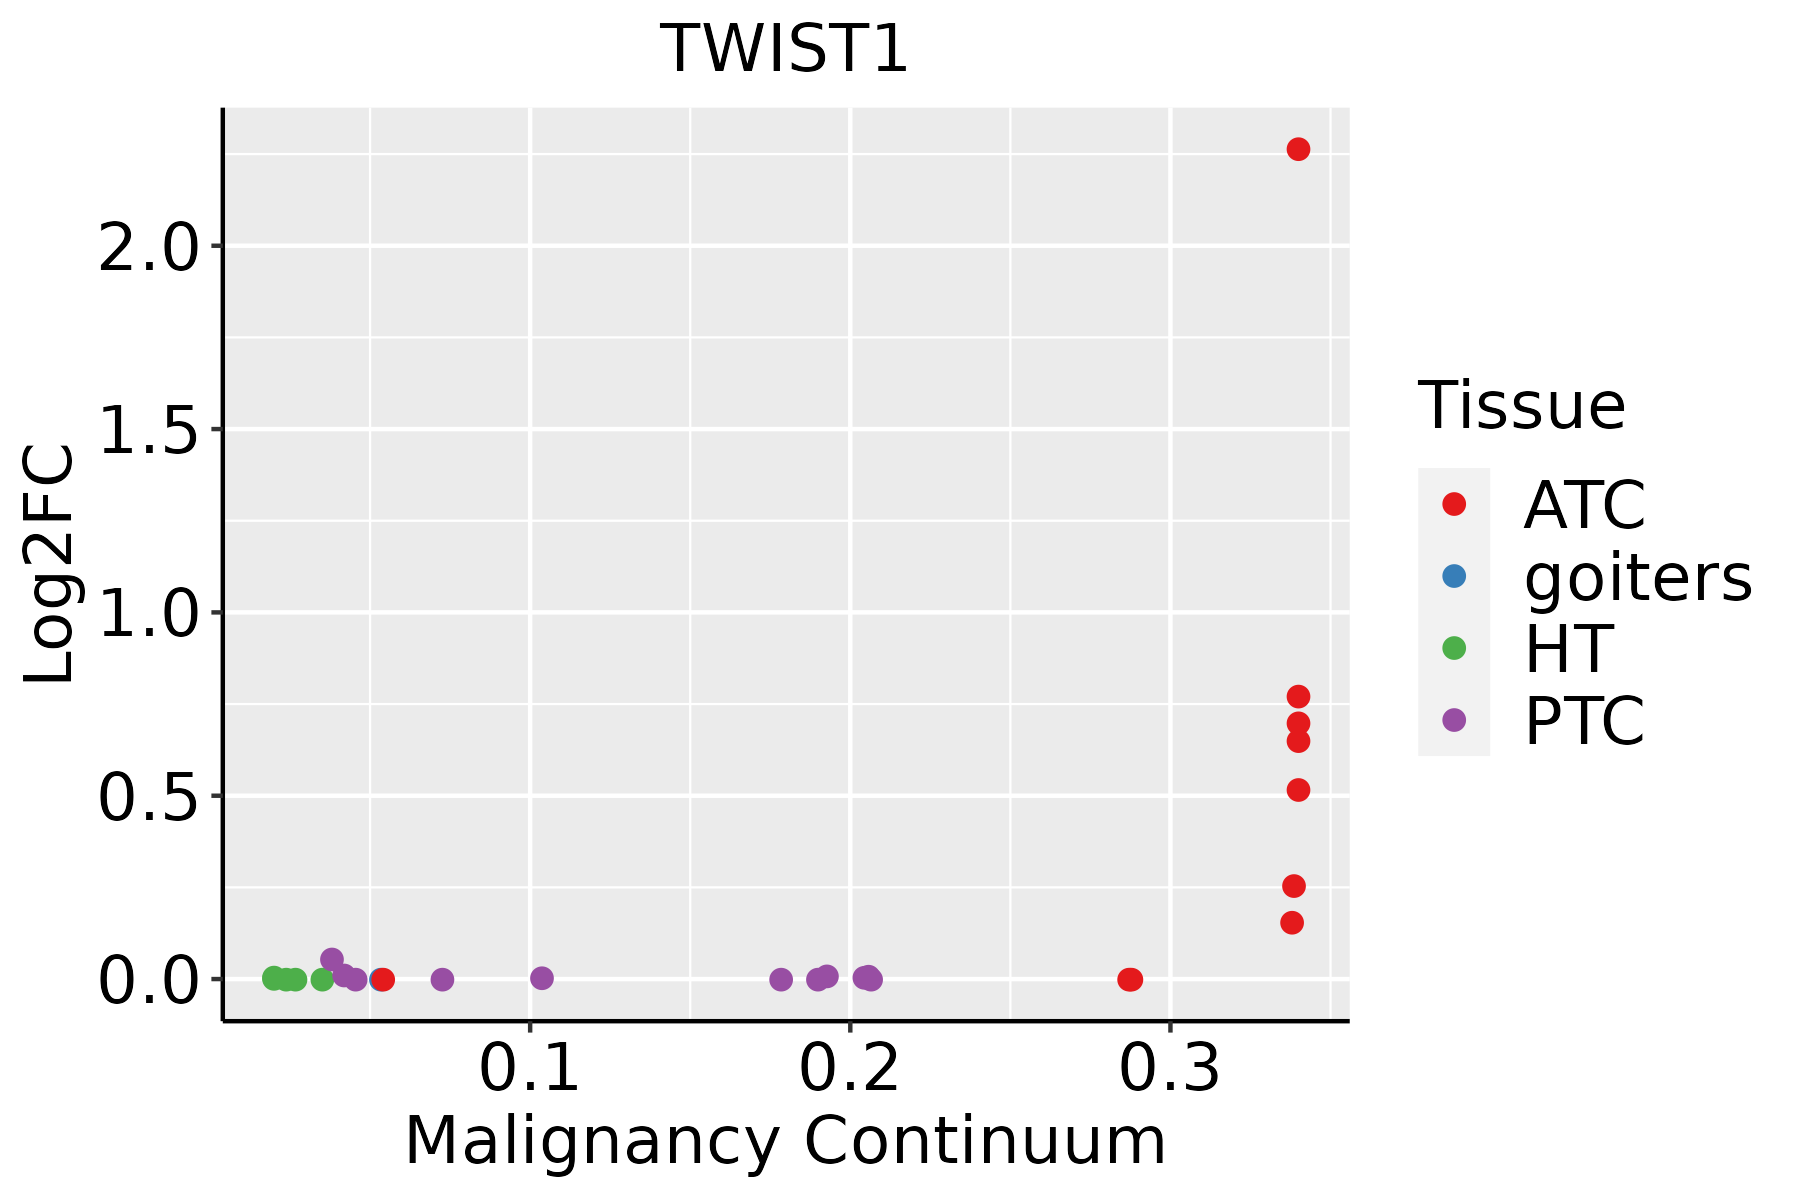 | ATC: Anaplastic thyroid cancer |
| HT: Hashimoto's thyroiditis | ||
| PTC: Papillary thyroid cancer |
| ∗log2FC in expression of this searched gene in stem-like cells from each diseased tissue sample relative to stem-like cells in normal samples in each tissue plotted against the malignancy continuum. Samples are colored based on if they are from different disease stage. |
Top |
Malignant transformation related pathway analysis |
| Find out the enriched GO biological processes and KEGG pathways involved in transition from healthy to precancer to cancer |
| Tissue | Disease Stage | Enriched GO biological Processes |
| Colorectum | AD |  |
| Colorectum | SER |  |
| Colorectum | MSS |  |
| Colorectum | MSI-H |  |
| Colorectum | FAP |  |
| ∗Top 15 enriched GO BP terms are showed in the bar plot of each disease state in each tissue. Each row represents a significant GO biological process which is colored according to the -log10(p.adjust). |
| Page: 1 2 3 4 5 6 7 8 9 |
| GO ID | Tissue | Disease Stage | Description | Gene Ratio | Bg Ratio | pvalue | p.adjust | Count |
| GO:000989620 | Oral cavity | OSCC | positive regulation of catabolic process | 307/7305 | 492/18723 | 2.29e-26 | 7.64e-24 | 307 |
| GO:003133120 | Oral cavity | OSCC | positive regulation of cellular catabolic process | 273/7305 | 427/18723 | 6.39e-26 | 2.02e-23 | 273 |
| GO:00165707 | Oral cavity | OSCC | histone modification | 270/7305 | 463/18723 | 1.59e-17 | 1.50e-15 | 270 |
| GO:005109820 | Oral cavity | OSCC | regulation of binding | 212/7305 | 363/18723 | 3.88e-14 | 2.15e-12 | 212 |
| GO:00182056 | Oral cavity | OSCC | peptidyl-lysine modification | 216/7305 | 376/18723 | 2.32e-13 | 1.16e-11 | 216 |
| GO:005105210 | Oral cavity | OSCC | regulation of DNA metabolic process | 207/7305 | 359/18723 | 4.45e-13 | 2.17e-11 | 207 |
| GO:001056320 | Oral cavity | OSCC | negative regulation of phosphorus metabolic process | 246/7305 | 442/18723 | 6.12e-13 | 2.89e-11 | 246 |
| GO:004593620 | Oral cavity | OSCC | negative regulation of phosphate metabolic process | 245/7305 | 441/18723 | 8.85e-13 | 4.09e-11 | 245 |
| GO:007048219 | Oral cavity | OSCC | response to oxygen levels | 200/7305 | 347/18723 | 1.17e-12 | 5.13e-11 | 200 |
| GO:00435434 | Oral cavity | OSCC | protein acylation | 149/7305 | 243/18723 | 1.33e-12 | 5.80e-11 | 149 |
| GO:007233120 | Oral cavity | OSCC | signal transduction by p53 class mediator | 107/7305 | 163/18723 | 4.75e-12 | 1.83e-10 | 107 |
| GO:000756818 | Oral cavity | OSCC | aging | 194/7305 | 339/18723 | 6.18e-12 | 2.33e-10 | 194 |
| GO:000170116 | Oral cavity | OSCC | in utero embryonic development | 207/7305 | 367/18723 | 7.92e-12 | 2.95e-10 | 207 |
| GO:000166619 | Oral cavity | OSCC | response to hypoxia | 177/7305 | 307/18723 | 2.21e-11 | 7.50e-10 | 177 |
| GO:004232619 | Oral cavity | OSCC | negative regulation of phosphorylation | 214/7305 | 385/18723 | 2.30e-11 | 7.74e-10 | 214 |
| GO:00183944 | Oral cavity | OSCC | peptidyl-lysine acetylation | 108/7305 | 169/18723 | 4.55e-11 | 1.45e-09 | 108 |
| GO:00064734 | Oral cavity | OSCC | protein acetylation | 124/7305 | 201/18723 | 5.59e-11 | 1.74e-09 | 124 |
| GO:003629319 | Oral cavity | OSCC | response to decreased oxygen levels | 182/7305 | 322/18723 | 1.14e-10 | 3.41e-09 | 182 |
| GO:000193319 | Oral cavity | OSCC | negative regulation of protein phosphorylation | 191/7305 | 342/18723 | 1.58e-10 | 4.62e-09 | 191 |
| GO:200102017 | Oral cavity | OSCC | regulation of response to DNA damage stimulus | 131/7305 | 219/18723 | 3.21e-10 | 8.72e-09 | 131 |
| Page: 1 2 3 4 5 6 7 8 9 10 11 12 13 14 15 16 17 18 19 20 |
| Pathway ID | Tissue | Disease Stage | Description | Gene Ratio | Bg Ratio | pvalue | p.adjust | qvalue | Count |
| hsa0520526 | Oral cavity | OSCC | Proteoglycans in cancer | 128/3704 | 205/8465 | 4.00e-08 | 3.12e-07 | 1.59e-07 | 128 |
| hsa05205111 | Oral cavity | OSCC | Proteoglycans in cancer | 128/3704 | 205/8465 | 4.00e-08 | 3.12e-07 | 1.59e-07 | 128 |
| hsa0520543 | Oral cavity | EOLP | Proteoglycans in cancer | 53/1218 | 205/8465 | 9.07e-06 | 5.33e-05 | 3.14e-05 | 53 |
| hsa0520553 | Oral cavity | EOLP | Proteoglycans in cancer | 53/1218 | 205/8465 | 9.07e-06 | 5.33e-05 | 3.14e-05 | 53 |
| hsa0520562 | Oral cavity | NEOLP | Proteoglycans in cancer | 56/1112 | 205/8465 | 3.49e-08 | 5.85e-07 | 3.68e-07 | 56 |
| hsa0520572 | Oral cavity | NEOLP | Proteoglycans in cancer | 56/1112 | 205/8465 | 3.49e-08 | 5.85e-07 | 3.68e-07 | 56 |
| Page: 1 |
Top |
Cell-cell communication analysis |
| Identification of potential cell-cell interactions between two cell types and their ligand-receptor pairs for different disease states |
| Ligand | Receptor | LRpair | Pathway | Tissue | Disease Stage |
| Page: 1 |
Top |
Single-cell gene regulatory network inference analysis |
| Find out the significant the regulons (TFs) and the target genes of each regulon across cell types for different disease states |
| TF | Cell Type | Tissue | Disease Stage | Target Gene | RSS | Regulon Activity |
| TWIST1 | BAS | Breast | ADJ | GJA4,KCNJ8,IGFBP7, etc. | 1.18e-01 |  |
| TWIST1 | CD8TRM | Esophagus | ADJ | ACVR2B-AS1,SNX1,SGPP2, etc. | 3.98e-01 |  |
| TWIST1 | CD8TCM | Esophagus | ADJ | ACVR2B-AS1,SNX1,SGPP2, etc. | 1.11e-01 | |
| TWIST1 | TFH | Esophagus | ADJ | ACVR2B-AS1,SNX1,SGPP2, etc. | 2.88e-02 | |
| TWIST1 | CD8TCM | Esophagus | ESCC | ACVR2B-AS1,SNX1,SGPP2, etc. | 1.35e-01 |  |
| TWIST1 | TFH | Esophagus | ESCC | ACVR2B-AS1,SNX1,SGPP2, etc. | 7.67e-02 | |
| TWIST1 | PSC | Pancreas | ADJ | HTRA1,COL1A2,COL6A2, etc. | 9.56e-02 |  |
| TWIST1 | ICAF | Pancreas | ADJ | HTRA1,COL1A2,COL6A2, etc. | 5.45e-01 | |
| TWIST1 | PSC | Pancreas | PanIN | HTRA1,COL1A2,COL6A2, etc. | 1.26e-01 |  |
| TWIST1 | PSC | Pancreas | PDAC | HTRA1,COL1A2,COL6A2, etc. | 5.05e-01 |  |
| ∗The dot plots of a searched regulon are shown for all cell subpopulations in each disease state of each tissue based on the regulon specific score inferred using pySCENIC and by calculating the average expression. |
| Page: 1 2 |
Top |
Somatic mutation of malignant transformation related genes |
| Annotation of somatic variants for genes involved in malignant transformation |
| Hugo Symbol | Variant Class | Variant Classification | dbSNP RS | HGVSc | HGVSp | HGVSp Short | SWISSPROT | BIOTYPE | SIFT | PolyPhen | Tumor Sample Barcode | Tissue | Histology | Sex | Age | Stage | Therapy Types | Drugs | Outcome |
| TWIST1 | SNV | Missense_Mutation | c.551G>T | p.Ser184Ile | p.S184I | Q15672 | protein_coding | deleterious(0) | probably_damaging(0.921) | TCGA-A8-A09Z-01 | Breast | breast invasive carcinoma | Female | >=65 | I/II | Unknown | Unknown | SD | |
| TWIST1 | SNV | Missense_Mutation | c.513N>C | p.Lys171Asn | p.K171N | Q15672 | protein_coding | deleterious(0.01) | benign(0.306) | TCGA-C5-A1BQ-01 | Cervix | cervical & endocervical cancer | Female | >=65 | III/IV | Chemotherapy | cisplatin | CR | |
| TWIST1 | SNV | Missense_Mutation | c.513G>C | p.Lys171Asn | p.K171N | Q15672 | protein_coding | deleterious(0.01) | benign(0.306) | TCGA-C5-A3HL-01 | Cervix | cervical & endocervical cancer | Female | >=65 | I/II | Unknown | Unknown | SD | |
| TWIST1 | SNV | Missense_Mutation | c.352N>T | p.Arg118Cys | p.R118C | Q15672 | protein_coding | deleterious(0) | probably_damaging(1) | TCGA-A6-2671-01 | Colorectum | colon adenocarcinoma | Male | >=65 | III/IV | Other, specify in notesProtocol AMG 20060464 | study | PD | |
| TWIST1 | SNV | Missense_Mutation | c.341A>G | p.Asn114Ser | p.N114S | Q15672 | protein_coding | deleterious(0) | probably_damaging(1) | TCGA-AA-3492-01 | Colorectum | colon adenocarcinoma | Female | >=65 | I/II | Unknown | Unknown | SD | |
| TWIST1 | SNV | Missense_Mutation | rs762445986 | c.598N>A | p.Ala200Thr | p.A200T | Q15672 | protein_coding | tolerated(0.31) | benign(0.041) | TCGA-AD-5900-01 | Colorectum | colon adenocarcinoma | Male | >=65 | I/II | Unknown | Unknown | SD |
| TWIST1 | SNV | Missense_Mutation | c.388G>A | p.Ala130Thr | p.A130T | Q15672 | protein_coding | tolerated(0.06) | benign(0.121) | TCGA-AG-3885-01 | Colorectum | rectum adenocarcinoma | Female | >=65 | III/IV | Ancillary | zoledronic | SD | |
| TWIST1 | SNV | Missense_Mutation | novel | c.425N>C | p.Lys142Thr | p.K142T | Q15672 | protein_coding | deleterious(0) | probably_damaging(1) | TCGA-B5-A3FA-01 | Endometrium | uterine corpus endometrioid carcinoma | Female | >=65 | I/II | Unknown | Unknown | SD |
| TWIST1 | SNV | Missense_Mutation | novel | c.398N>G | p.Lys133Arg | p.K133R | Q15672 | protein_coding | deleterious(0.01) | possibly_damaging(0.449) | TCGA-D1-A175-01 | Endometrium | uterine corpus endometrioid carcinoma | Female | <65 | I/II | Chemotherapy | paclitaxel | SD |
| TWIST1 | SNV | Missense_Mutation | c.438T>G | p.Ile146Met | p.I146M | Q15672 | protein_coding | deleterious(0.01) | probably_damaging(1) | TCGA-D1-A17Q-01 | Endometrium | uterine corpus endometrioid carcinoma | Female | <65 | I/II | Unknown | Unknown | SD |
| Page: 1 2 |
Top |
Related drugs of malignant transformation related genes |
| Identification of chemicals and drugs interact with genes involved in malignant transfromation |
| (DGIdb 4.0) |
| Entrez ID | Symbol | Category | Interaction Types | Drug Claim Name | Drug Name | PMIDs |
| Page: 1 |

Copyright 2023-Present -The University of Texas Health Science Center at Houston |