
|
|||||
|
 | |
| |
| |
| |
| |
| |
|
Gene: TWF1 |
Gene summary for TWF1 |
| Gene information | Species | Human | Gene symbol | TWF1 | Gene ID | 5756 |
| Gene name | twinfilin actin binding protein 1 | |
| Gene Alias | A6 | |
| Cytomap | 12q12 | |
| Gene Type | protein-coding | GO ID | GO:0001932 | UniProtAcc | Q12792 |
Top |
Malignant transformation analysis |
| Identification of the aberrant gene expression in precancerous and cancerous lesions by comparing the gene expression of stem-like cells in diseased tissues with normal stem cells |
| Entrez ID | Symbol | Replicates | Species | Organ | Tissue | Adj P-value | Log2FC | Malignancy |
| 5756 | TWF1 | LZE2D | Human | Esophagus | HGIN | 5.05e-03 | 2.40e-01 | 0.0642 |
| 5756 | TWF1 | LZE4T | Human | Esophagus | ESCC | 3.42e-15 | 6.04e-01 | 0.0811 |
| 5756 | TWF1 | LZE7T | Human | Esophagus | ESCC | 4.29e-10 | 7.96e-01 | 0.0667 |
| 5756 | TWF1 | LZE8T | Human | Esophagus | ESCC | 2.22e-10 | 3.23e-01 | 0.067 |
| 5756 | TWF1 | LZE20T | Human | Esophagus | ESCC | 7.12e-13 | 7.67e-02 | 0.0662 |
| 5756 | TWF1 | LZE22T | Human | Esophagus | ESCC | 1.90e-06 | 5.32e-01 | 0.068 |
| 5756 | TWF1 | LZE24T | Human | Esophagus | ESCC | 6.84e-24 | 7.67e-01 | 0.0596 |
| 5756 | TWF1 | LZE6T | Human | Esophagus | ESCC | 2.38e-06 | 3.46e-01 | 0.0845 |
| 5756 | TWF1 | P1T-E | Human | Esophagus | ESCC | 2.16e-13 | 6.41e-01 | 0.0875 |
| 5756 | TWF1 | P2T-E | Human | Esophagus | ESCC | 1.06e-40 | 8.24e-01 | 0.1177 |
| 5756 | TWF1 | P4T-E | Human | Esophagus | ESCC | 2.91e-71 | 1.92e+00 | 0.1323 |
| 5756 | TWF1 | P5T-E | Human | Esophagus | ESCC | 4.77e-50 | 1.03e+00 | 0.1327 |
| 5756 | TWF1 | P8T-E | Human | Esophagus | ESCC | 3.93e-39 | 8.64e-01 | 0.0889 |
| 5756 | TWF1 | P9T-E | Human | Esophagus | ESCC | 6.28e-20 | 4.71e-01 | 0.1131 |
| 5756 | TWF1 | P10T-E | Human | Esophagus | ESCC | 8.70e-31 | 6.73e-01 | 0.116 |
| 5756 | TWF1 | P11T-E | Human | Esophagus | ESCC | 6.90e-19 | 4.60e-01 | 0.1426 |
| 5756 | TWF1 | P12T-E | Human | Esophagus | ESCC | 1.77e-26 | 5.93e-01 | 0.1122 |
| 5756 | TWF1 | P15T-E | Human | Esophagus | ESCC | 7.10e-52 | 1.14e+00 | 0.1149 |
| 5756 | TWF1 | P16T-E | Human | Esophagus | ESCC | 6.84e-29 | 5.76e-01 | 0.1153 |
| 5756 | TWF1 | P17T-E | Human | Esophagus | ESCC | 1.97e-20 | 8.44e-01 | 0.1278 |
| Page: 1 2 3 4 5 6 |
| Tissue | Expression Dynamics | Abbreviation |
| Esophagus | 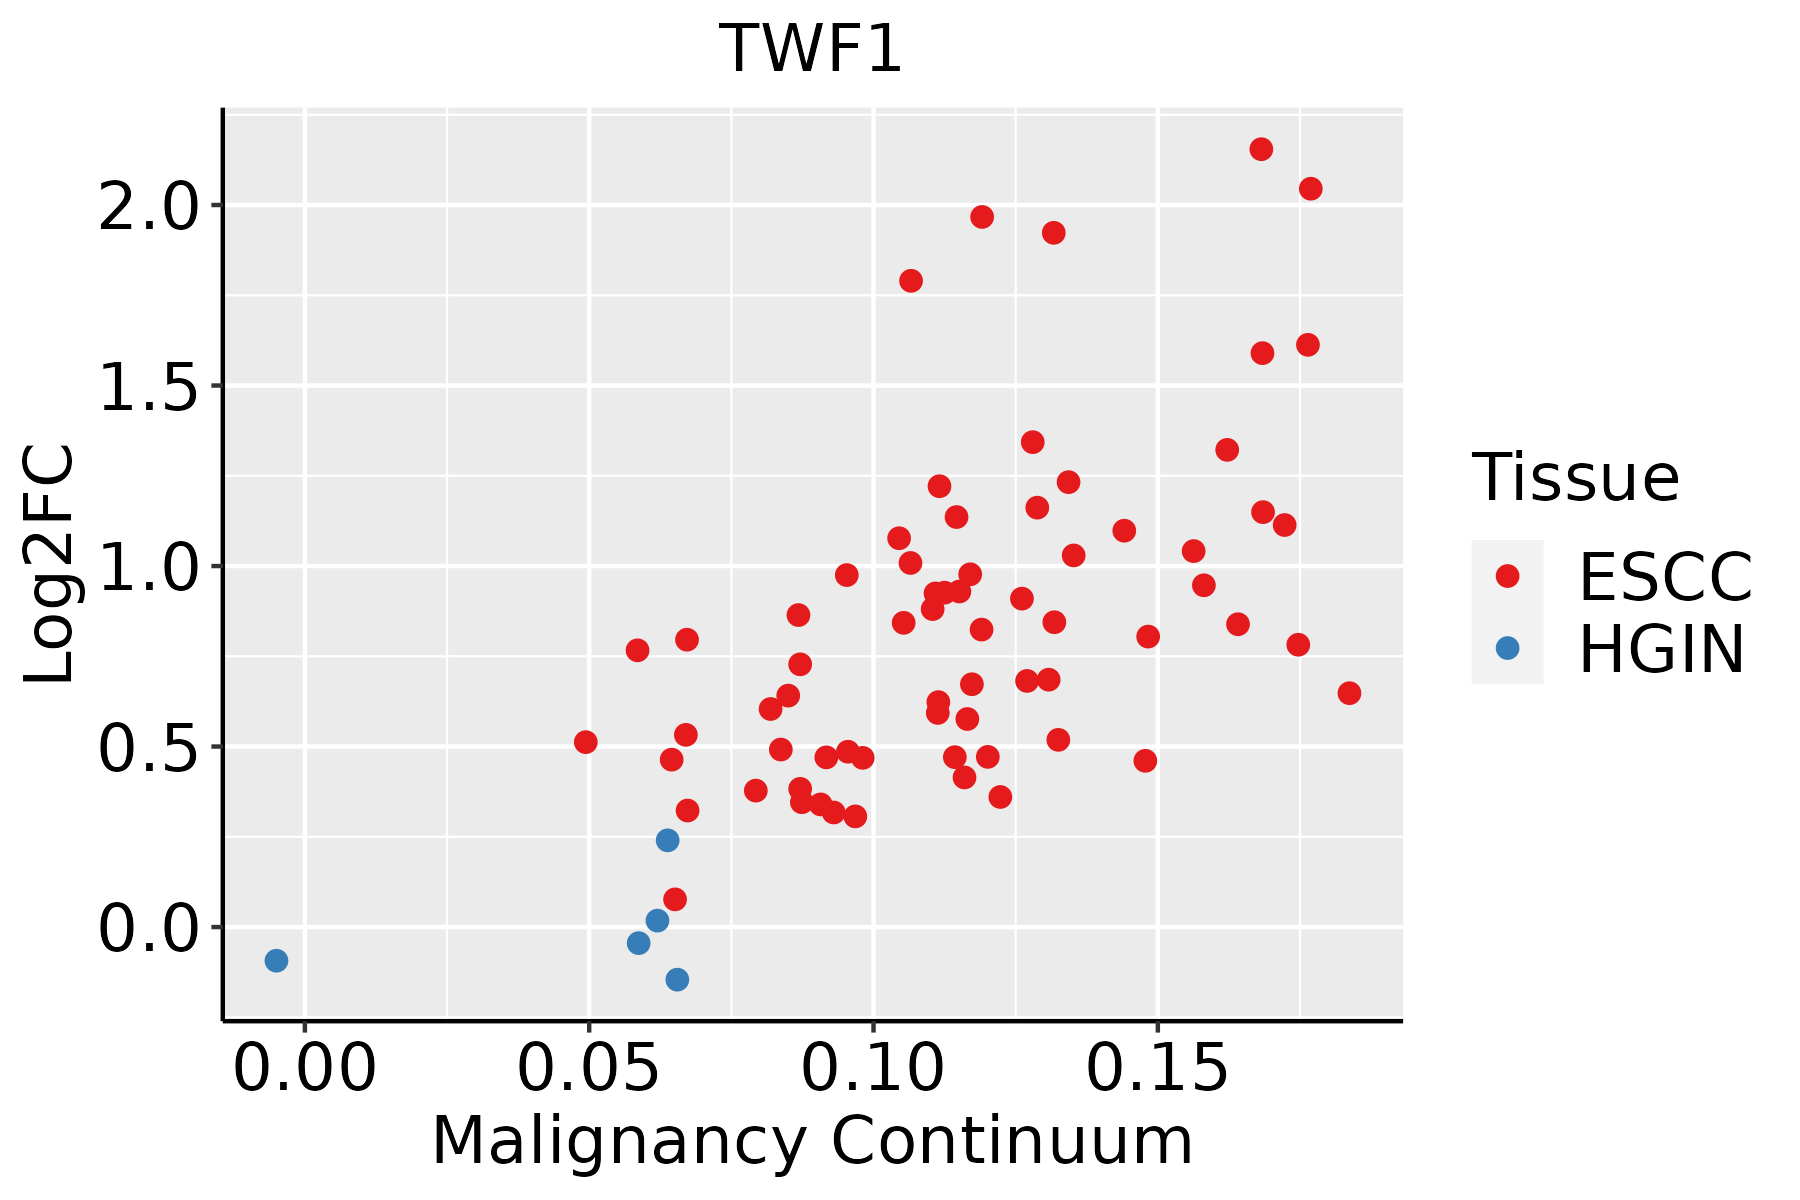 | ESCC: Esophageal squamous cell carcinoma |
| HGIN: High-grade intraepithelial neoplasias | ||
| LGIN: Low-grade intraepithelial neoplasias | ||
| Liver | 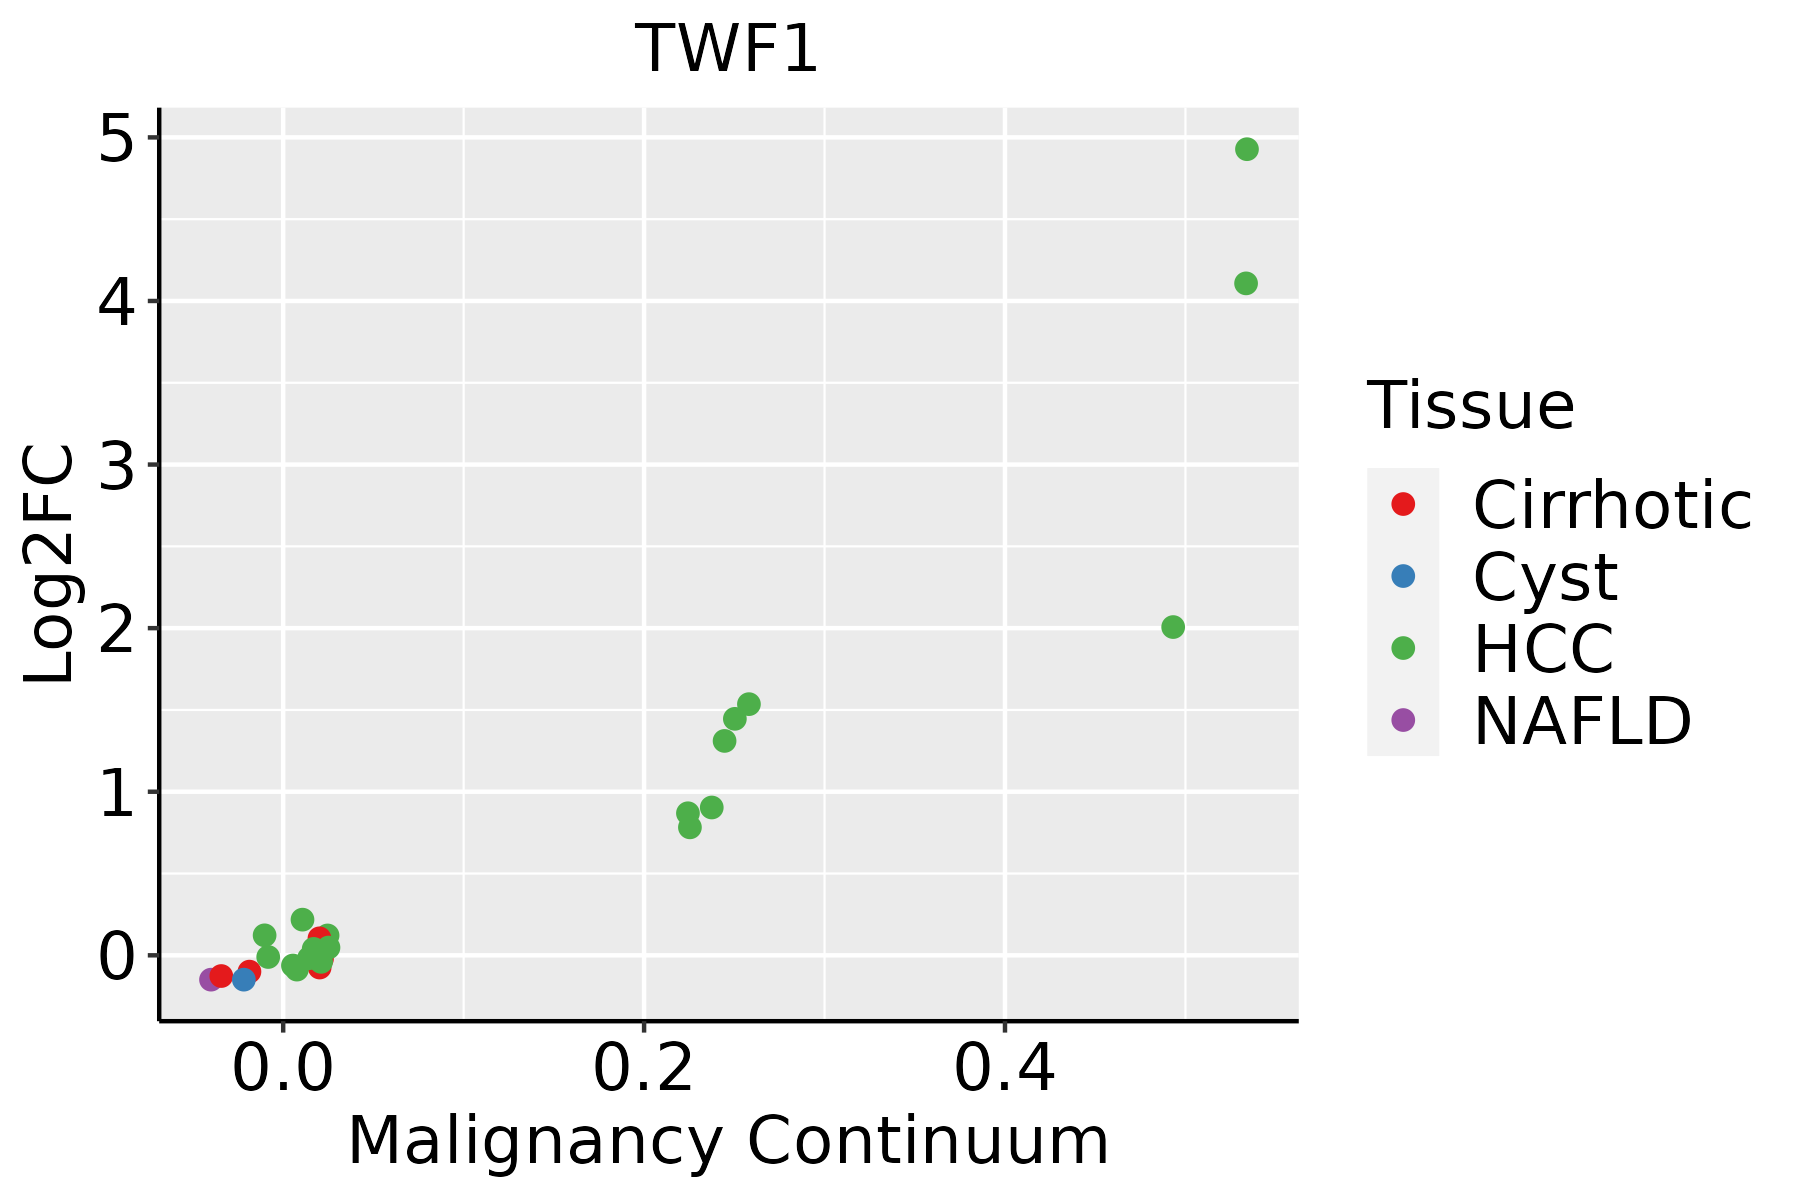 | HCC: Hepatocellular carcinoma |
| NAFLD: Non-alcoholic fatty liver disease | ||
| Oral Cavity | 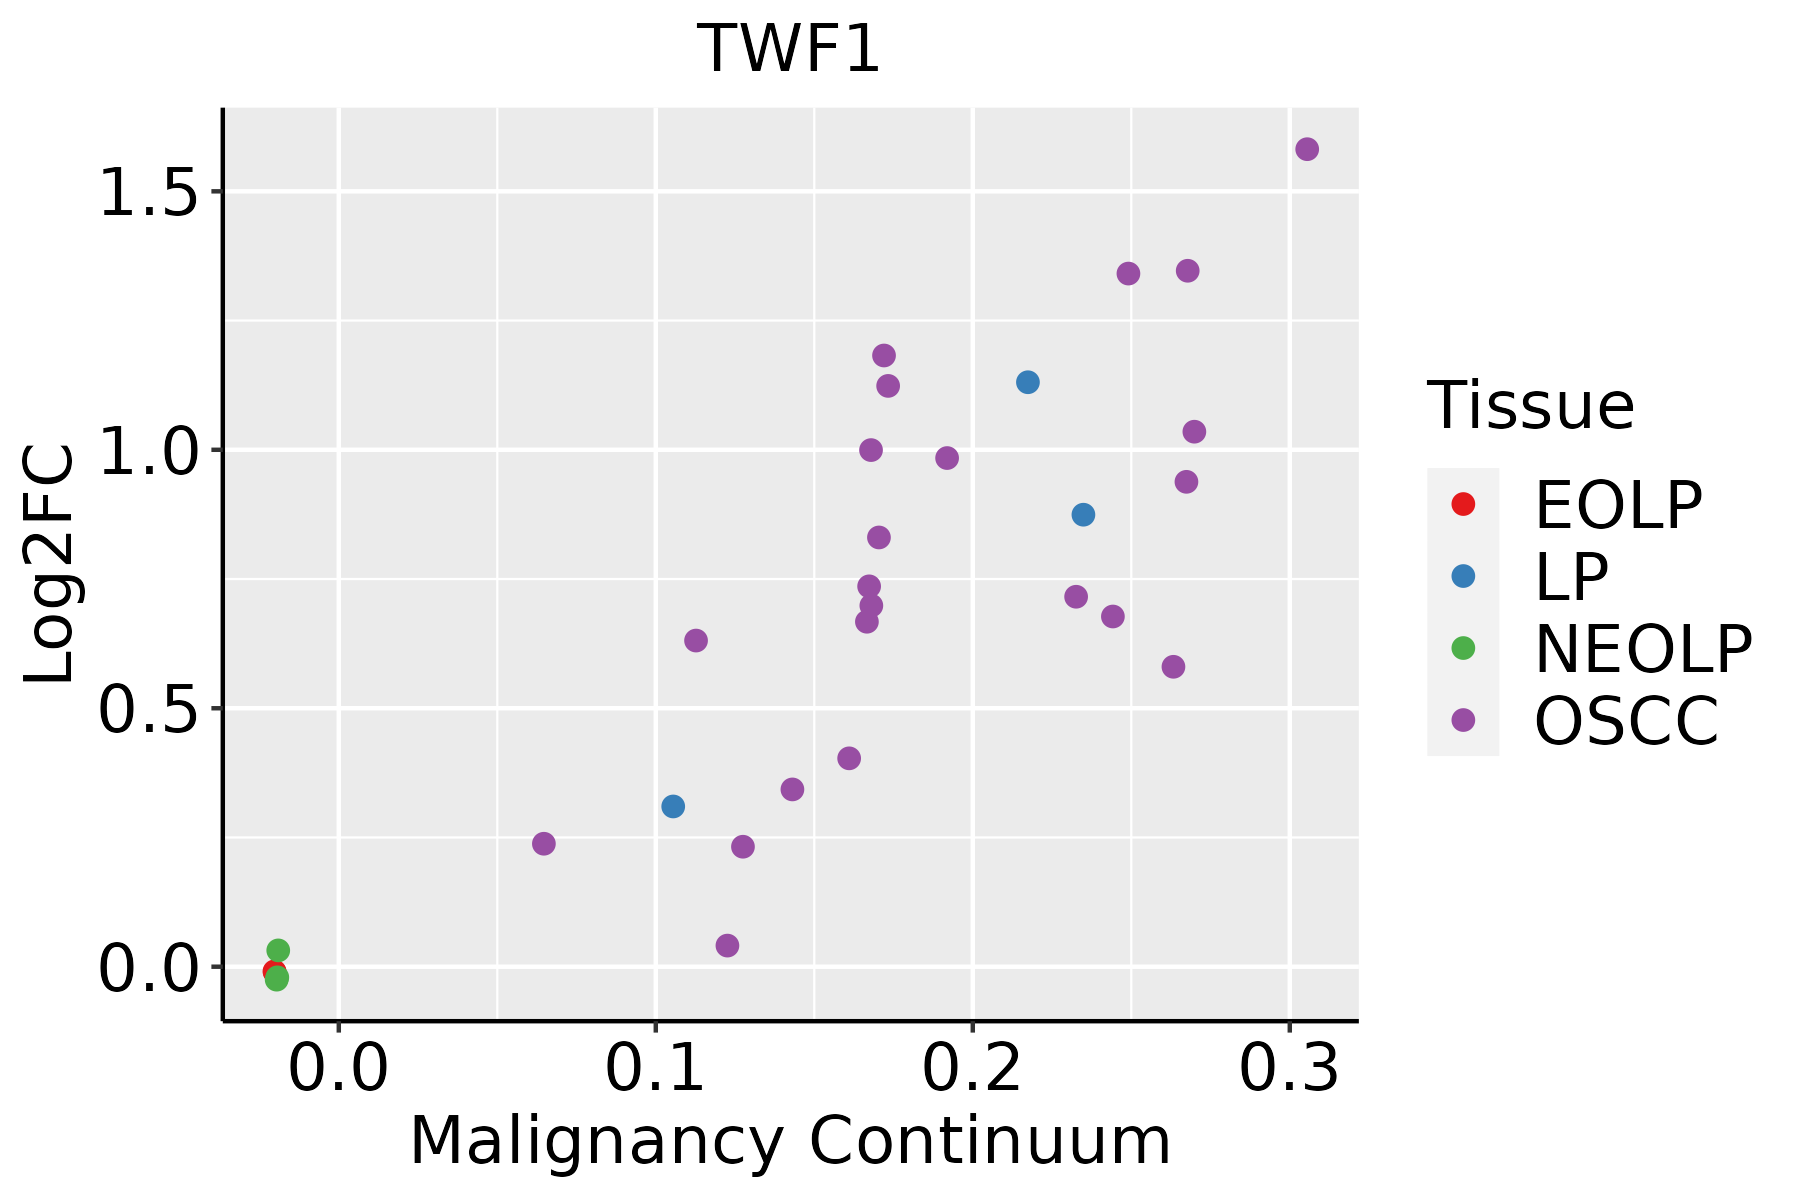 | EOLP: Erosive Oral lichen planus |
| LP: leukoplakia | ||
| NEOLP: Non-erosive oral lichen planus | ||
| OSCC: Oral squamous cell carcinoma | ||
| Skin | 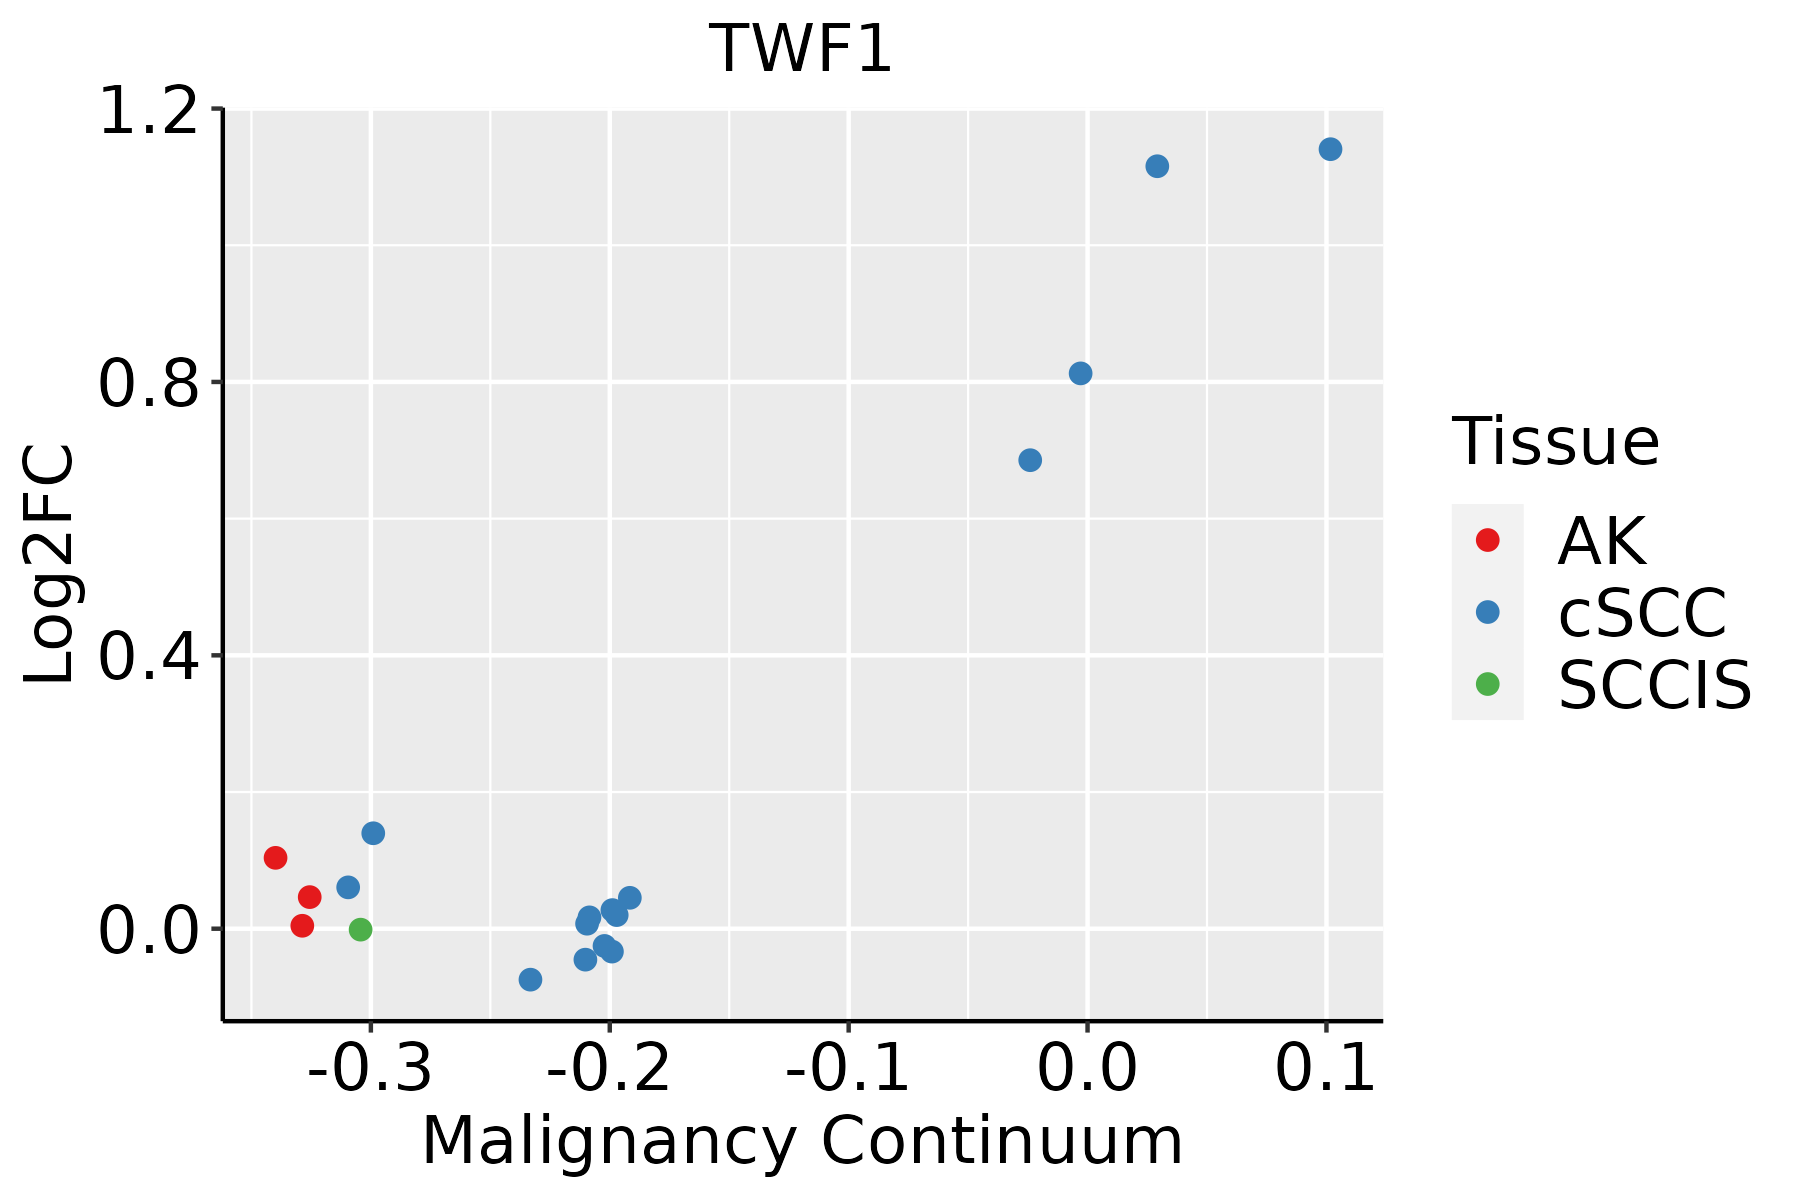 | AK: Actinic keratosis |
| cSCC: Cutaneous squamous cell carcinoma | ||
| SCCIS:squamous cell carcinoma in situ | ||
| Thyroid |  | ATC: Anaplastic thyroid cancer |
| HT: Hashimoto's thyroiditis | ||
| PTC: Papillary thyroid cancer |
| ∗log2FC in expression of this searched gene in stem-like cells from each diseased tissue sample relative to stem-like cells in normal samples in each tissue plotted against the malignancy continuum. Samples are colored based on if they are from different disease stage. |
Top |
Malignant transformation related pathway analysis |
| Find out the enriched GO biological processes and KEGG pathways involved in transition from healthy to precancer to cancer |
| Tissue | Disease Stage | Enriched GO biological Processes |
| Colorectum | AD |  |
| Colorectum | SER |  |
| Colorectum | MSS |  |
| Colorectum | MSI-H |  |
| Colorectum | FAP |  |
| ∗Top 15 enriched GO BP terms are showed in the bar plot of each disease state in each tissue. Each row represents a significant GO biological process which is colored according to the -log10(p.adjust). |
| Page: 1 2 3 4 5 6 7 8 9 |
| GO ID | Tissue | Disease Stage | Description | Gene Ratio | Bg Ratio | pvalue | p.adjust | Count |
| GO:002241120 | Esophagus | HGIN | cellular component disassembly | 102/2587 | 443/18723 | 8.31e-08 | 4.33e-06 | 102 |
| GO:004325427 | Esophagus | HGIN | regulation of protein-containing complex assembly | 94/2587 | 428/18723 | 2.39e-06 | 8.55e-05 | 94 |
| GO:001063920 | Esophagus | HGIN | negative regulation of organelle organization | 79/2587 | 348/18723 | 4.12e-06 | 1.37e-04 | 79 |
| GO:005165126 | Esophagus | HGIN | maintenance of location in cell | 53/2587 | 214/18723 | 1.22e-05 | 3.45e-04 | 53 |
| GO:005123520 | Esophagus | HGIN | maintenance of location | 73/2587 | 327/18723 | 1.73e-05 | 4.71e-04 | 73 |
| GO:004518523 | Esophagus | HGIN | maintenance of protein location | 28/2587 | 94/18723 | 4.52e-05 | 1.09e-03 | 28 |
| GO:005125826 | Esophagus | HGIN | protein polymerization | 66/2587 | 297/18723 | 4.96e-05 | 1.19e-03 | 66 |
| GO:190290327 | Esophagus | HGIN | regulation of supramolecular fiber organization | 79/2587 | 383/18723 | 1.40e-04 | 2.81e-03 | 79 |
| GO:003250719 | Esophagus | HGIN | maintenance of protein location in cell | 20/2587 | 65/18723 | 3.31e-04 | 5.48e-03 | 20 |
| GO:003298415 | Esophagus | HGIN | protein-containing complex disassembly | 50/2587 | 224/18723 | 3.43e-04 | 5.56e-03 | 50 |
| GO:003297027 | Esophagus | HGIN | regulation of actin filament-based process | 77/2587 | 397/18723 | 1.14e-03 | 1.39e-02 | 77 |
| GO:003227126 | Esophagus | HGIN | regulation of protein polymerization | 49/2587 | 233/18723 | 1.56e-03 | 1.79e-02 | 49 |
| GO:003295627 | Esophagus | HGIN | regulation of actin cytoskeleton organization | 69/2587 | 358/18723 | 2.35e-03 | 2.39e-02 | 69 |
| GO:003133320 | Esophagus | HGIN | negative regulation of protein-containing complex assembly | 32/2587 | 141/18723 | 2.80e-03 | 2.74e-02 | 32 |
| GO:003004120 | Esophagus | HGIN | actin filament polymerization | 40/2587 | 191/18723 | 4.29e-03 | 3.82e-02 | 40 |
| GO:006049117 | Esophagus | HGIN | regulation of cell projection assembly | 39/2587 | 188/18723 | 5.61e-03 | 4.57e-02 | 39 |
| GO:0022411111 | Esophagus | ESCC | cellular component disassembly | 305/8552 | 443/18723 | 1.94e-23 | 4.57e-21 | 305 |
| GO:0043254111 | Esophagus | ESCC | regulation of protein-containing complex assembly | 278/8552 | 428/18723 | 3.81e-16 | 2.77e-14 | 278 |
| GO:003298416 | Esophagus | ESCC | protein-containing complex disassembly | 151/8552 | 224/18723 | 3.45e-11 | 1.15e-09 | 151 |
| GO:1902903111 | Esophagus | ESCC | regulation of supramolecular fiber organization | 237/8552 | 383/18723 | 9.06e-11 | 2.75e-09 | 237 |
| Page: 1 2 3 4 5 6 7 8 9 10 11 12 13 14 15 16 |
| Pathway ID | Tissue | Disease Stage | Description | Gene Ratio | Bg Ratio | pvalue | p.adjust | qvalue | Count |
| Page: 1 |
Top |
Cell-cell communication analysis |
| Identification of potential cell-cell interactions between two cell types and their ligand-receptor pairs for different disease states |
| Ligand | Receptor | LRpair | Pathway | Tissue | Disease Stage |
| Page: 1 |
Top |
Single-cell gene regulatory network inference analysis |
| Find out the significant the regulons (TFs) and the target genes of each regulon across cell types for different disease states |
| TF | Cell Type | Tissue | Disease Stage | Target Gene | RSS | Regulon Activity |
| ∗The dot plots of a searched regulon are shown for all cell subpopulations in each disease state of each tissue based on the regulon specific score inferred using pySCENIC and by calculating the average expression. |
| Page: 1 |
Top |
Somatic mutation of malignant transformation related genes |
| Annotation of somatic variants for genes involved in malignant transformation |
| Hugo Symbol | Variant Class | Variant Classification | dbSNP RS | HGVSc | HGVSp | HGVSp Short | SWISSPROT | BIOTYPE | SIFT | PolyPhen | Tumor Sample Barcode | Tissue | Histology | Sex | Age | Stage | Therapy Types | Drugs | Outcome |
| TWF1 | SNV | Missense_Mutation | c.130N>G | p.Gln44Glu | p.Q44E | Q12792 | protein_coding | tolerated(1) | benign(0) | TCGA-D8-A1J8-01 | Breast | breast invasive carcinoma | Female | >=65 | I/II | Hormone Therapy | nolvadex | SD | |
| TWF1 | SNV | Missense_Mutation | c.554T>C | p.Val185Ala | p.V185A | Q12792 | protein_coding | deleterious(0) | benign(0.042) | TCGA-D8-A1JL-01 | Breast | breast invasive carcinoma | Female | >=65 | I/II | Unknown | Unknown | SD | |
| TWF1 | SNV | Missense_Mutation | c.538N>G | p.Gln180Glu | p.Q180E | Q12792 | protein_coding | deleterious(0) | possibly_damaging(0.702) | TCGA-D8-A27G-01 | Breast | breast invasive carcinoma | Female | >=65 | I/II | Unknown | Unknown | SD | |
| TWF1 | SNV | Missense_Mutation | novel | c.92N>G | p.Ser31Cys | p.S31C | Q12792 | protein_coding | tolerated(0.15) | benign(0.007) | TCGA-C5-A8XH-01 | Cervix | cervical & endocervical cancer | Female | <65 | I/II | Unknown | Unknown | SD |
| TWF1 | SNV | Missense_Mutation | novel | c.431N>A | p.Pro144His | p.P144H | Q12792 | protein_coding | deleterious(0) | probably_damaging(0.997) | TCGA-AA-3949-01 | Colorectum | colon adenocarcinoma | Female | >=65 | III/IV | Unknown | Unknown | SD |
| TWF1 | SNV | Missense_Mutation | c.702N>T | p.Lys234Asn | p.K234N | Q12792 | protein_coding | tolerated(0.26) | benign(0.011) | TCGA-AA-A010-01 | Colorectum | colon adenocarcinoma | Female | <65 | I/II | Chemotherapy | folinic | CR | |
| TWF1 | SNV | Missense_Mutation | c.301T>C | p.Tyr101His | p.Y101H | Q12792 | protein_coding | deleterious(0.01) | possibly_damaging(0.737) | TCGA-CK-5913-01 | Colorectum | colon adenocarcinoma | Female | <65 | I/II | Unknown | Unknown | SD | |
| TWF1 | SNV | Missense_Mutation | novel | c.888N>T | p.Met296Ile | p.M296I | Q12792 | protein_coding | tolerated(0.65) | benign(0.007) | TCGA-AG-A002-01 | Colorectum | rectum adenocarcinoma | Male | <65 | I/II | Unknown | Unknown | SD |
| TWF1 | SNV | Missense_Mutation | c.405N>C | p.Lys135Asn | p.K135N | Q12792 | protein_coding | tolerated(0.17) | benign(0.147) | TCGA-AG-A002-01 | Colorectum | rectum adenocarcinoma | Male | <65 | I/II | Unknown | Unknown | SD | |
| TWF1 | SNV | Missense_Mutation | novel | c.245N>C | p.Glu82Ala | p.E82A | Q12792 | protein_coding | tolerated(0.07) | probably_damaging(0.977) | TCGA-F5-6814-01 | Colorectum | rectum adenocarcinoma | Male | <65 | I/II | Unknown | Unknown | SD |
| Page: 1 2 3 4 5 6 |
Top |
Related drugs of malignant transformation related genes |
| Identification of chemicals and drugs interact with genes involved in malignant transfromation |
| (DGIdb 4.0) |
| Entrez ID | Symbol | Category | Interaction Types | Drug Claim Name | Drug Name | PMIDs |
| Page: 1 |

Copyright 2023-Present -The University of Texas Health Science Center at Houston |