
|
|||||
|
 | |
| |
| |
| |
| |
| |
|
Gene: TVP23C |
Gene summary for TVP23C |
| Gene information | Species | Human | Gene symbol | TVP23C | Gene ID | 201158 |
| Gene name | trans-golgi network vesicle protein 23 homolog C | |
| Gene Alias | FAM18B2 | |
| Cytomap | 17p12 | |
| Gene Type | protein-coding | GO ID | GO:0006810 | UniProtAcc | Q96ET8 |
Top |
Malignant transformation analysis |
| Identification of the aberrant gene expression in precancerous and cancerous lesions by comparing the gene expression of stem-like cells in diseased tissues with normal stem cells |
| Entrez ID | Symbol | Replicates | Species | Organ | Tissue | Adj P-value | Log2FC | Malignancy |
| 201158 | TVP23C | HTA11_3410_2000001011 | Human | Colorectum | AD | 7.75e-07 | 1.74e-01 | 0.0155 |
| 201158 | TVP23C | HTA11_2487_2000001011 | Human | Colorectum | SER | 2.86e-10 | 3.08e-01 | -0.1808 |
| 201158 | TVP23C | HTA11_2951_2000001011 | Human | Colorectum | AD | 3.03e-06 | 3.63e-01 | 0.0216 |
| 201158 | TVP23C | HTA11_1938_2000001011 | Human | Colorectum | AD | 8.04e-15 | 4.31e-01 | -0.0811 |
| 201158 | TVP23C | HTA11_78_2000001011 | Human | Colorectum | AD | 6.14e-23 | 5.68e-01 | -0.1088 |
| 201158 | TVP23C | HTA11_347_2000001011 | Human | Colorectum | AD | 2.45e-44 | 8.35e-01 | -0.1954 |
| 201158 | TVP23C | HTA11_411_2000001011 | Human | Colorectum | SER | 2.50e-11 | 5.38e-01 | -0.2602 |
| 201158 | TVP23C | HTA11_2112_2000001011 | Human | Colorectum | SER | 1.50e-04 | 3.07e-01 | -0.2196 |
| 201158 | TVP23C | HTA11_3361_2000001011 | Human | Colorectum | AD | 1.09e-06 | 2.35e-01 | -0.1207 |
| 201158 | TVP23C | HTA11_83_2000001011 | Human | Colorectum | SER | 2.83e-15 | 5.21e-01 | -0.1526 |
| 201158 | TVP23C | HTA11_696_2000001011 | Human | Colorectum | AD | 3.80e-25 | 4.61e-01 | -0.1464 |
| 201158 | TVP23C | HTA11_866_2000001011 | Human | Colorectum | AD | 3.45e-30 | 5.27e-01 | -0.1001 |
| 201158 | TVP23C | HTA11_1391_2000001011 | Human | Colorectum | AD | 6.14e-20 | 4.47e-01 | -0.059 |
| 201158 | TVP23C | HTA11_2992_2000001011 | Human | Colorectum | SER | 2.31e-08 | 4.01e-01 | -0.1706 |
| 201158 | TVP23C | HTA11_5212_2000001011 | Human | Colorectum | AD | 5.12e-05 | 2.80e-01 | -0.2061 |
| 201158 | TVP23C | HTA11_5216_2000001011 | Human | Colorectum | SER | 3.34e-04 | 2.80e-01 | -0.1462 |
| 201158 | TVP23C | HTA11_546_2000001011 | Human | Colorectum | AD | 2.21e-18 | 5.91e-01 | -0.0842 |
| 201158 | TVP23C | HTA11_7862_2000001011 | Human | Colorectum | AD | 1.67e-07 | 3.39e-01 | -0.0179 |
| 201158 | TVP23C | HTA11_866_3004761011 | Human | Colorectum | AD | 2.43e-14 | 3.25e-01 | 0.096 |
| 201158 | TVP23C | HTA11_4255_2000001011 | Human | Colorectum | SER | 1.51e-11 | 5.15e-01 | 0.0446 |
| Page: 1 2 3 4 |
| Tissue | Expression Dynamics | Abbreviation |
| Colorectum (GSE201348) |  | FAP: Familial adenomatous polyposis |
| CRC: Colorectal cancer | ||
| Colorectum (HTA11) |  | AD: Adenomas |
| SER: Sessile serrated lesions | ||
| MSI-H: Microsatellite-high colorectal cancer | ||
| MSS: Microsatellite stable colorectal cancer | ||
| Lung | 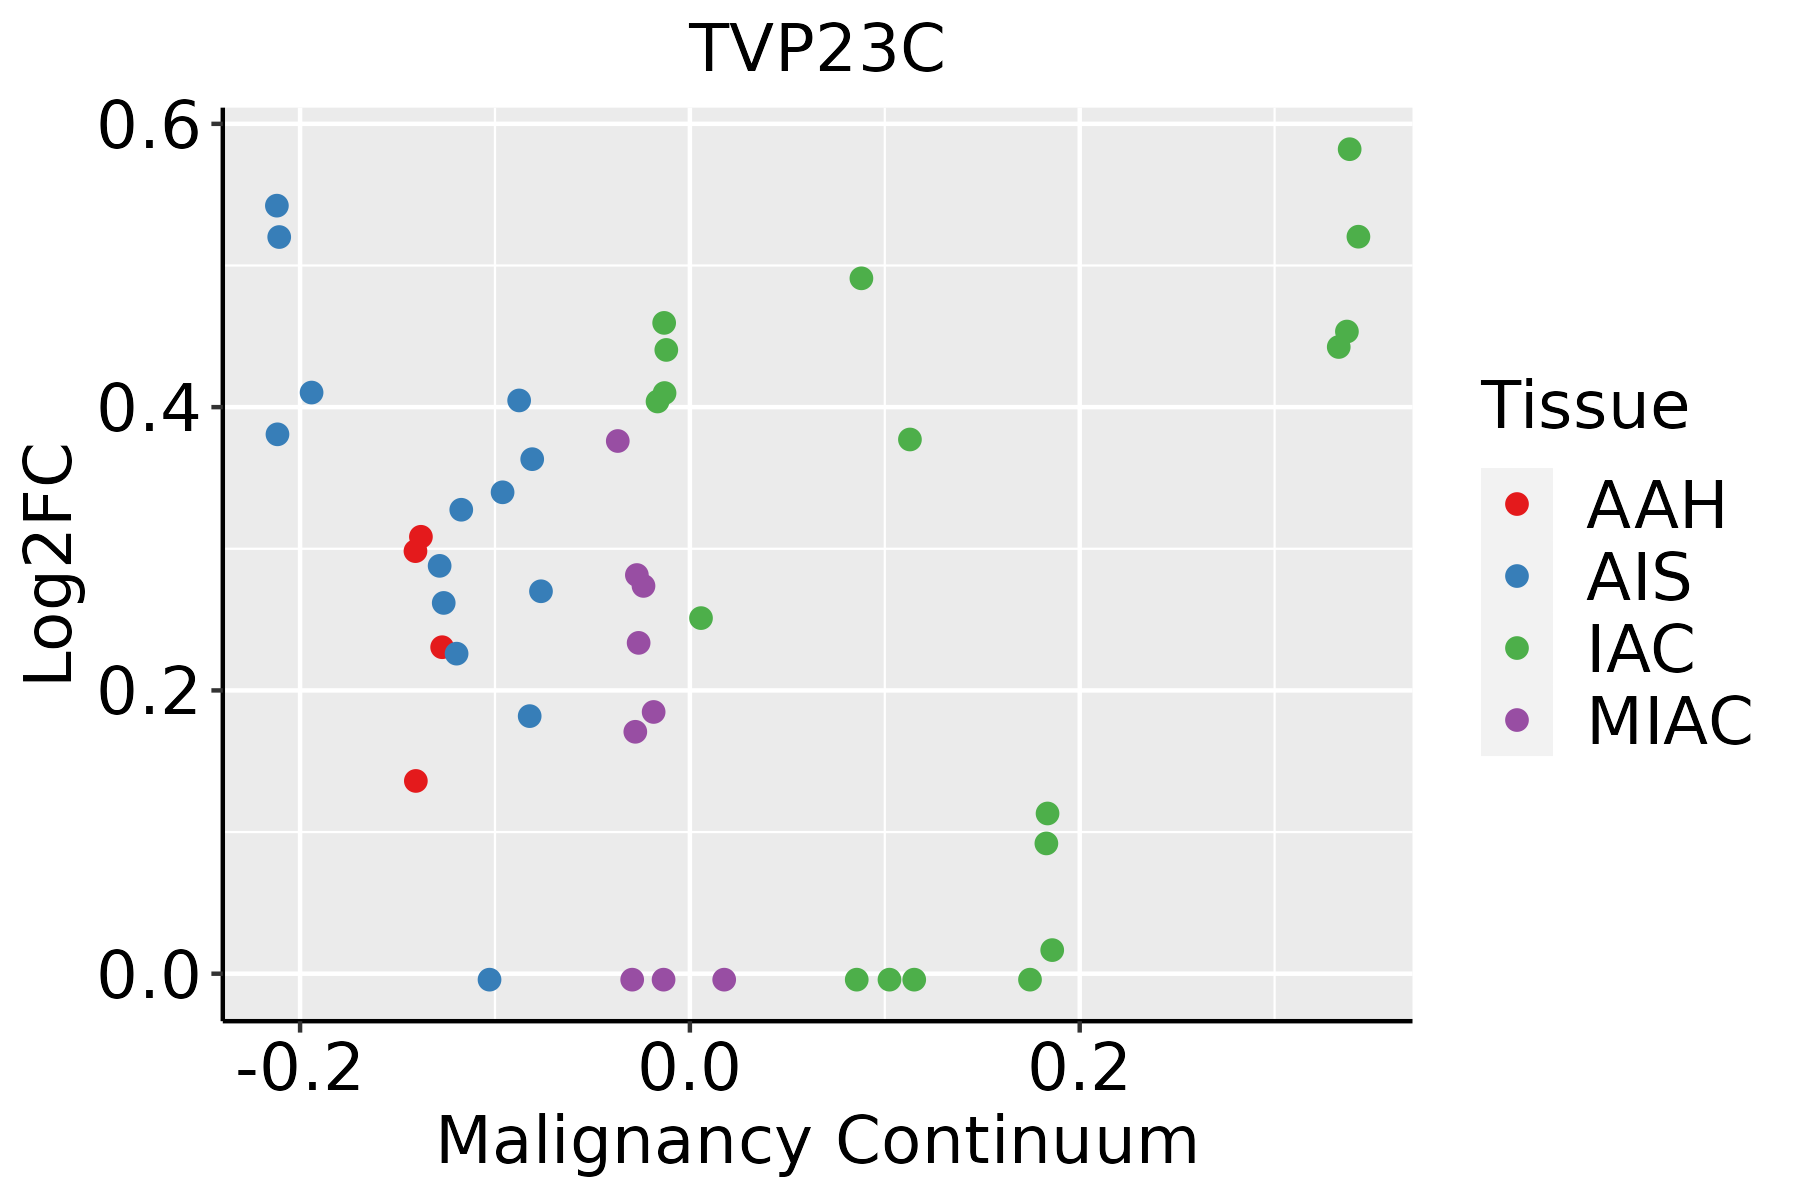 | AAH: Atypical adenomatous hyperplasia |
| AIS: Adenocarcinoma in situ | ||
| IAC: Invasive lung adenocarcinoma | ||
| MIA: Minimally invasive adenocarcinoma | ||
| Prostate | 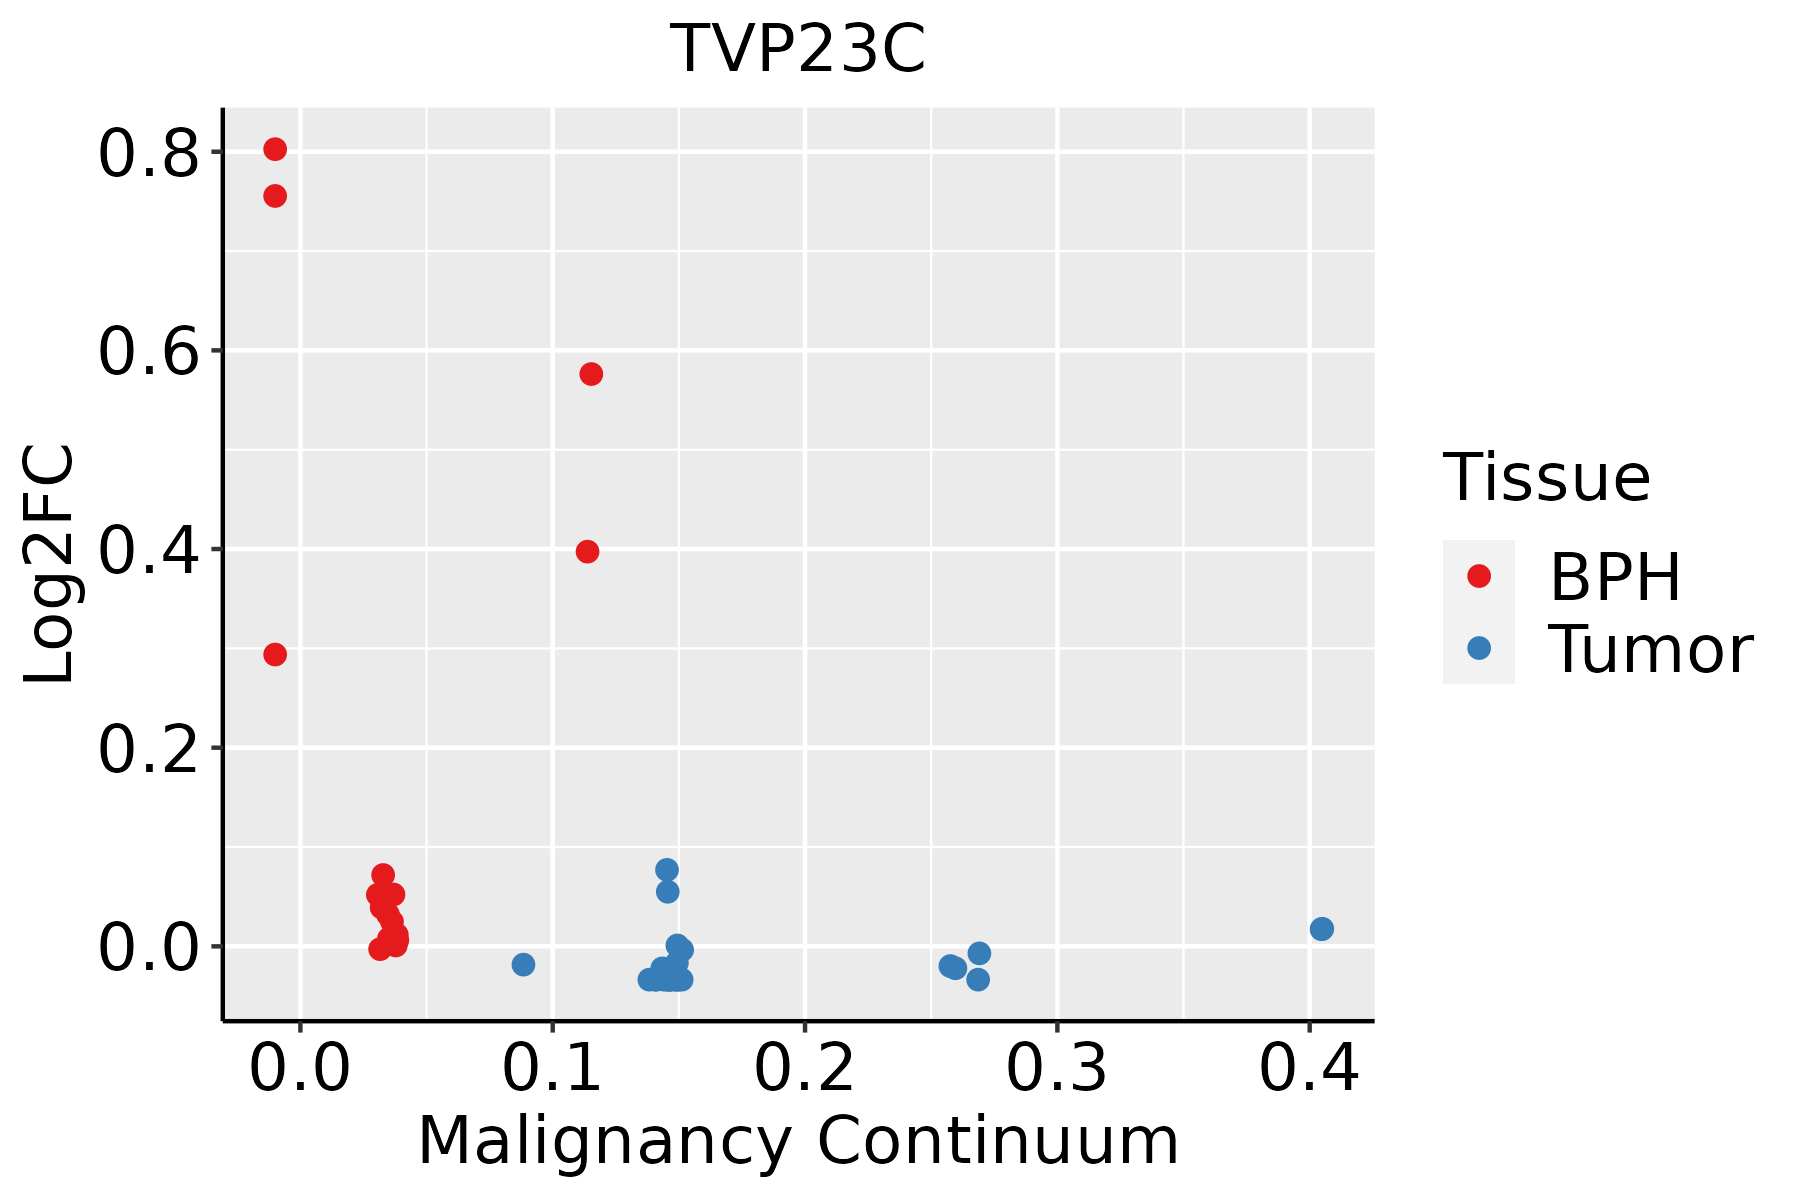 | BPH: Benign Prostatic Hyperplasia |
| ∗log2FC in expression of this searched gene in stem-like cells from each diseased tissue sample relative to stem-like cells in normal samples in each tissue plotted against the malignancy continuum. Samples are colored based on if they are from different disease stage. |
Top |
Malignant transformation related pathway analysis |
| Find out the enriched GO biological processes and KEGG pathways involved in transition from healthy to precancer to cancer |
| Tissue | Disease Stage | Enriched GO biological Processes |
| Colorectum | AD |  |
| Colorectum | SER |  |
| Colorectum | MSS |  |
| Colorectum | MSI-H |  |
| Colorectum | FAP |  |
| ∗Top 15 enriched GO BP terms are showed in the bar plot of each disease state in each tissue. Each row represents a significant GO biological process which is colored according to the -log10(p.adjust). |
| Page: 1 2 3 4 5 6 7 8 9 |
| GO ID | Tissue | Disease Stage | Description | Gene Ratio | Bg Ratio | pvalue | p.adjust | Count |
| GO:0009306 | Colorectum | AD | protein secretion | 105/3918 | 359/18723 | 1.05e-04 | 1.57e-03 | 105 |
| GO:0035592 | Colorectum | AD | establishment of protein localization to extracellular region | 105/3918 | 360/18723 | 1.18e-04 | 1.73e-03 | 105 |
| GO:0071692 | Colorectum | AD | protein localization to extracellular region | 106/3918 | 368/18723 | 1.86e-04 | 2.49e-03 | 106 |
| GO:00093061 | Colorectum | SER | protein secretion | 79/2897 | 359/18723 | 5.99e-04 | 8.19e-03 | 79 |
| GO:00355921 | Colorectum | SER | establishment of protein localization to extracellular region | 79/2897 | 360/18723 | 6.54e-04 | 8.77e-03 | 79 |
| GO:00716921 | Colorectum | SER | protein localization to extracellular region | 80/2897 | 368/18723 | 8.13e-04 | 1.01e-02 | 80 |
| GO:00093062 | Colorectum | MSS | protein secretion | 98/3467 | 359/18723 | 2.43e-05 | 5.09e-04 | 98 |
| GO:00355922 | Colorectum | MSS | establishment of protein localization to extracellular region | 98/3467 | 360/18723 | 2.75e-05 | 5.58e-04 | 98 |
| GO:00716922 | Colorectum | MSS | protein localization to extracellular region | 99/3467 | 368/18723 | 4.17e-05 | 7.83e-04 | 99 |
| GO:00716928 | Prostate | BPH | protein localization to extracellular region | 82/3107 | 368/18723 | 2.59e-03 | 1.39e-02 | 82 |
| GO:00093069 | Prostate | BPH | protein secretion | 80/3107 | 359/18723 | 2.89e-03 | 1.52e-02 | 80 |
| GO:00355929 | Prostate | BPH | establishment of protein localization to extracellular region | 80/3107 | 360/18723 | 3.13e-03 | 1.63e-02 | 80 |
| Page: 1 |
| Pathway ID | Tissue | Disease Stage | Description | Gene Ratio | Bg Ratio | pvalue | p.adjust | qvalue | Count |
| Page: 1 |
Top |
Cell-cell communication analysis |
| Identification of potential cell-cell interactions between two cell types and their ligand-receptor pairs for different disease states |
| Ligand | Receptor | LRpair | Pathway | Tissue | Disease Stage |
| Page: 1 |
Top |
Single-cell gene regulatory network inference analysis |
| Find out the significant the regulons (TFs) and the target genes of each regulon across cell types for different disease states |
| TF | Cell Type | Tissue | Disease Stage | Target Gene | RSS | Regulon Activity |
| ∗The dot plots of a searched regulon are shown for all cell subpopulations in each disease state of each tissue based on the regulon specific score inferred using pySCENIC and by calculating the average expression. |
| Page: 1 |
Top |
Somatic mutation of malignant transformation related genes |
| Annotation of somatic variants for genes involved in malignant transformation |
| Hugo Symbol | Variant Class | Variant Classification | dbSNP RS | HGVSc | HGVSp | HGVSp Short | SWISSPROT | BIOTYPE | SIFT | PolyPhen | Tumor Sample Barcode | Tissue | Histology | Sex | Age | Stage | Therapy Types | Drugs | Outcome |
| TVP23C | SNV | Missense_Mutation | novel | c.818N>T | p.Ser273Phe | p.S273F | Q96ET8 | protein_coding | deleterious_low_confidence(0.02) | possibly_damaging(0.907) | TCGA-BH-A0HF-01 | Breast | breast invasive carcinoma | Female | >=65 | I/II | Hormone Therapy | arimidex | SD |
| TVP23C | SNV | Missense_Mutation | novel | c.303N>C | p.Lys101Asn | p.K101N | Q96ET8 | protein_coding | tolerated(0.09) | probably_damaging(0.982) | TCGA-C8-A12K-01 | Breast | breast invasive carcinoma | Female | >=65 | I/II | Unknown | Unknown | SD |
| TVP23C | SNV | Missense_Mutation | c.628G>A | p.Asp210Asn | p.D210N | Q96ET8 | protein_coding | tolerated(0.35) | benign(0) | TCGA-D8-A27G-01 | Breast | breast invasive carcinoma | Female | >=65 | I/II | Unknown | Unknown | SD | |
| TVP23C | SNV | Missense_Mutation | rs779026862 | c.229N>C | p.Trp77Arg | p.W77R | Q96ET8 | protein_coding | deleterious(0) | probably_damaging(1) | TCGA-EA-A3HS-01 | Cervix | cervical & endocervical cancer | Female | <65 | I/II | Unknown | Unknown | SD |
| TVP23C | SNV | Missense_Mutation | novel | c.74N>T | p.Arg25Ile | p.R25I | Q96ET8 | protein_coding | tolerated(0.12) | benign(0.439) | TCGA-AZ-4315-01 | Colorectum | colon adenocarcinoma | Male | <65 | I/II | Unknown | Unknown | SD |
| TVP23C | SNV | Missense_Mutation | c.94N>G | p.Arg32Gly | p.R32G | Q96ET8 | protein_coding | deleterious(0.01) | probably_damaging(0.932) | TCGA-D5-6927-01 | Colorectum | colon adenocarcinoma | Male | <65 | I/II | Unknown | Unknown | SD | |
| TVP23C | SNV | Missense_Mutation | rs374541045 | c.803N>C | p.Lys268Thr | p.K268T | Q96ET8 | protein_coding | deleterious_low_confidence(0) | benign(0.161) | TCGA-AJ-A3EL-01 | Endometrium | uterine corpus endometrioid carcinoma | Female | <65 | I/II | Unknown | Unknown | SD |
| TVP23C | SNV | Missense_Mutation | rs766450760 | c.131N>A | p.Arg44Gln | p.R44Q | Q96ET8 | protein_coding | deleterious(0.01) | probably_damaging(0.992) | TCGA-AX-A05Z-01 | Endometrium | uterine corpus endometrioid carcinoma | Female | <65 | III/IV | Chemotherapy | adriamycin | SD |
| TVP23C | SNV | Missense_Mutation | novel | c.518N>T | p.Pro173Leu | p.P173L | Q96ET8 | protein_coding | tolerated_low_confidence(1) | benign(0) | TCGA-DF-A2KU-01 | Endometrium | uterine corpus endometrioid carcinoma | Female | Unknown | I/II | Unknown | Unknown | SD |
| TVP23C | SNV | Missense_Mutation | c.611N>A | p.Ser204Tyr | p.S204Y | Q96ET8 | protein_coding | tolerated(0.7) | benign(0) | TCGA-E6-A1M0-01 | Endometrium | uterine corpus endometrioid carcinoma | Female | <65 | III/IV | Chemotherapy | carboplatin | SD |
| Page: 1 2 3 |
Top |
Related drugs of malignant transformation related genes |
| Identification of chemicals and drugs interact with genes involved in malignant transfromation |
| (DGIdb 4.0) |
| Entrez ID | Symbol | Category | Interaction Types | Drug Claim Name | Drug Name | PMIDs |
| Page: 1 |

Copyright 2023-Present -The University of Texas Health Science Center at Houston |