
|
|||||
|
 | |
| |
| |
| |
| |
| |
|
Gene: TVP23B |
Gene summary for TVP23B |
| Gene information | Species | Human | Gene symbol | TVP23B | Gene ID | 51030 |
| Gene name | trans-golgi network vesicle protein 23 homolog B | |
| Gene Alias | CGI-148 | |
| Cytomap | 17p11.2 | |
| Gene Type | protein-coding | GO ID | GO:0006810 | UniProtAcc | J3QL63 |
Top |
Malignant transformation analysis |
| Identification of the aberrant gene expression in precancerous and cancerous lesions by comparing the gene expression of stem-like cells in diseased tissues with normal stem cells |
| Entrez ID | Symbol | Replicates | Species | Organ | Tissue | Adj P-value | Log2FC | Malignancy |
| 51030 | TVP23B | LZE2T | Human | Esophagus | ESCC | 1.55e-06 | 6.03e-01 | 0.082 |
| 51030 | TVP23B | LZE4T | Human | Esophagus | ESCC | 1.49e-27 | 7.68e-01 | 0.0811 |
| 51030 | TVP23B | LZE5T | Human | Esophagus | ESCC | 4.42e-08 | 7.08e-01 | 0.0514 |
| 51030 | TVP23B | LZE7T | Human | Esophagus | ESCC | 1.42e-15 | 7.61e-01 | 0.0667 |
| 51030 | TVP23B | LZE8T | Human | Esophagus | ESCC | 1.00e-21 | 6.02e-01 | 0.067 |
| 51030 | TVP23B | LZE20T | Human | Esophagus | ESCC | 7.51e-13 | 3.96e-01 | 0.0662 |
| 51030 | TVP23B | LZE22D1 | Human | Esophagus | HGIN | 6.39e-08 | 3.27e-01 | 0.0595 |
| 51030 | TVP23B | LZE22T | Human | Esophagus | ESCC | 3.68e-10 | 8.25e-01 | 0.068 |
| 51030 | TVP23B | LZE24T | Human | Esophagus | ESCC | 1.52e-44 | 1.10e+00 | 0.0596 |
| 51030 | TVP23B | LZE21T | Human | Esophagus | ESCC | 1.85e-10 | 5.54e-01 | 0.0655 |
| 51030 | TVP23B | LZE6T | Human | Esophagus | ESCC | 2.13e-12 | 5.17e-01 | 0.0845 |
| 51030 | TVP23B | P1T-E | Human | Esophagus | ESCC | 6.96e-14 | 1.10e+00 | 0.0875 |
| 51030 | TVP23B | P2T-E | Human | Esophagus | ESCC | 1.23e-44 | 7.70e-01 | 0.1177 |
| 51030 | TVP23B | P4T-E | Human | Esophagus | ESCC | 3.69e-59 | 1.31e+00 | 0.1323 |
| 51030 | TVP23B | P5T-E | Human | Esophagus | ESCC | 1.53e-28 | 4.48e-01 | 0.1327 |
| 51030 | TVP23B | P8T-E | Human | Esophagus | ESCC | 2.18e-66 | 1.11e+00 | 0.0889 |
| 51030 | TVP23B | P9T-E | Human | Esophagus | ESCC | 3.15e-26 | 6.11e-01 | 0.1131 |
| 51030 | TVP23B | P10T-E | Human | Esophagus | ESCC | 1.20e-63 | 1.05e+00 | 0.116 |
| 51030 | TVP23B | P11T-E | Human | Esophagus | ESCC | 9.52e-35 | 1.08e+00 | 0.1426 |
| 51030 | TVP23B | P12T-E | Human | Esophagus | ESCC | 2.65e-46 | 8.06e-01 | 0.1122 |
| Page: 1 2 3 4 5 |
| Tissue | Expression Dynamics | Abbreviation |
| Esophagus | 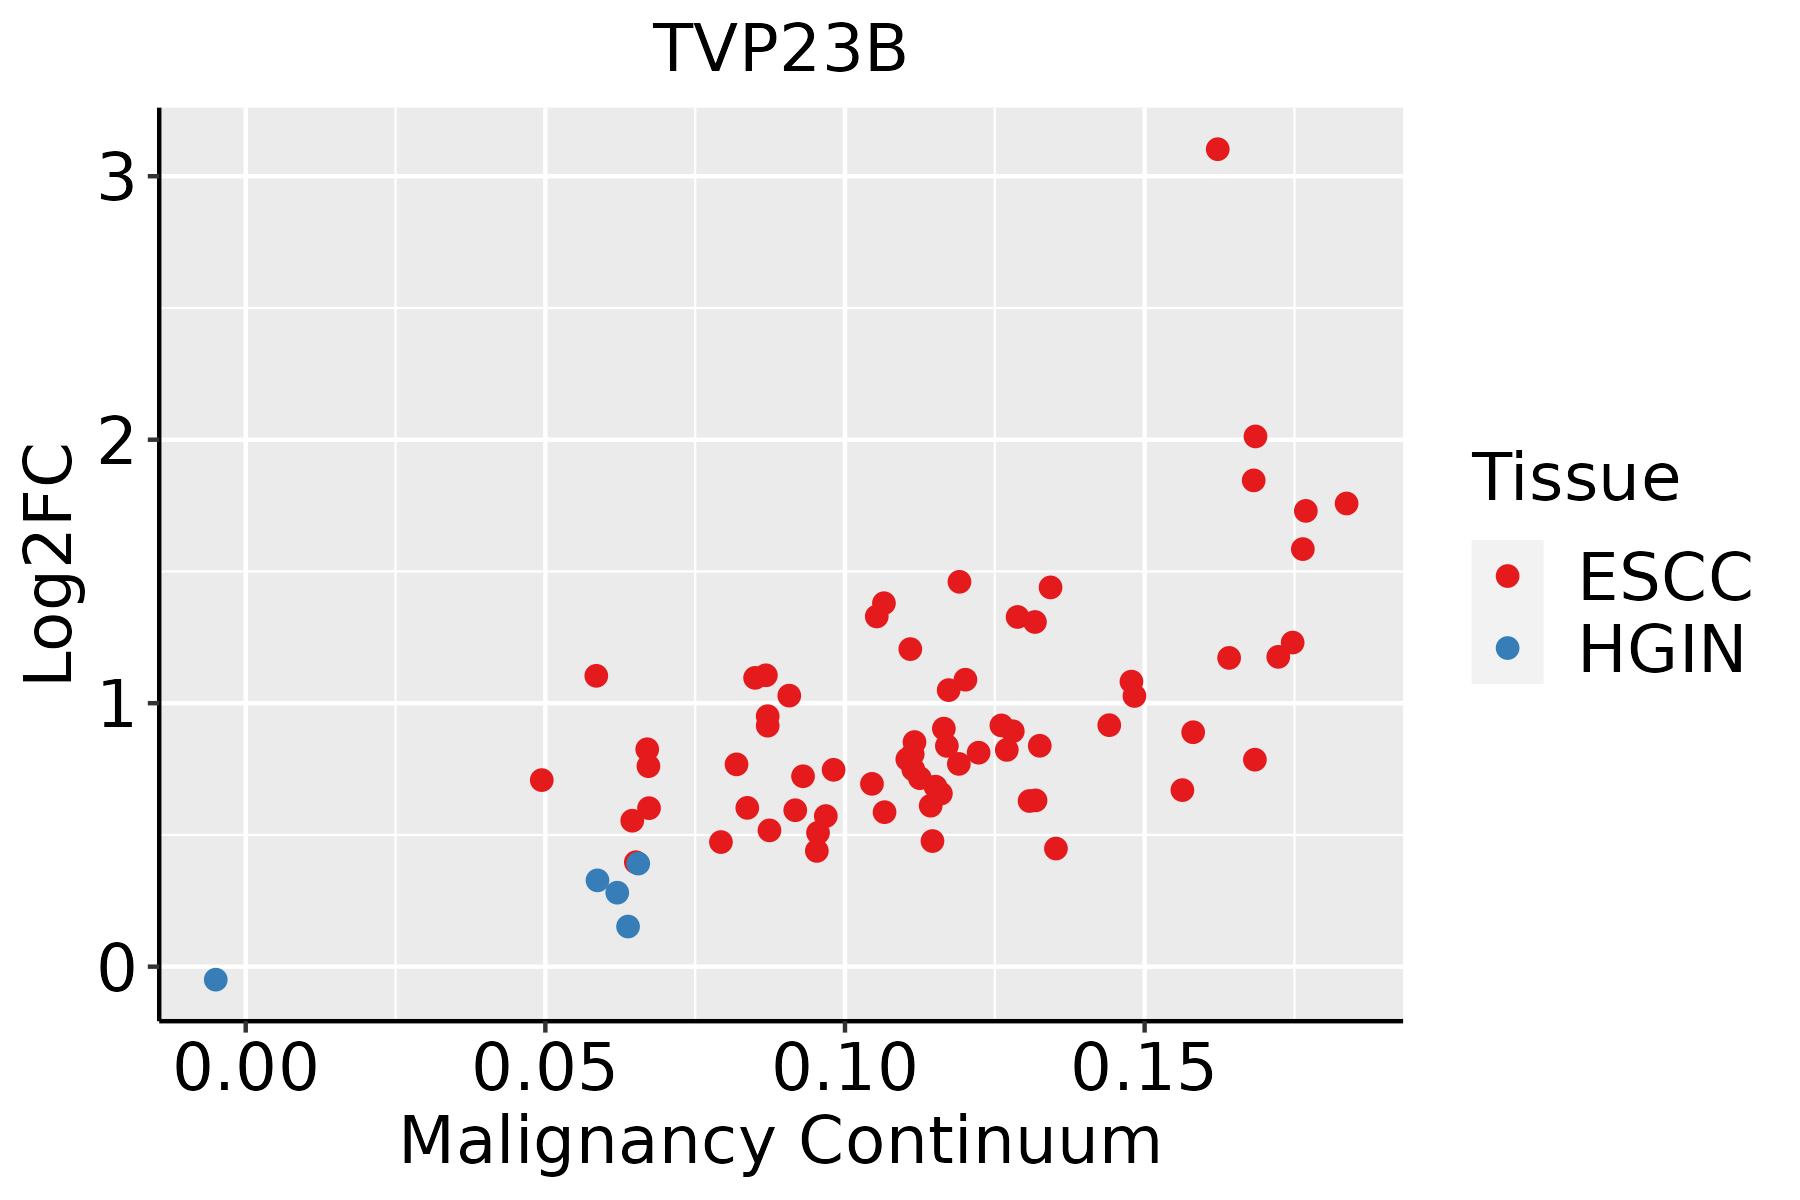 | ESCC: Esophageal squamous cell carcinoma |
| HGIN: High-grade intraepithelial neoplasias | ||
| LGIN: Low-grade intraepithelial neoplasias | ||
| Liver |  | HCC: Hepatocellular carcinoma |
| NAFLD: Non-alcoholic fatty liver disease | ||
| Oral Cavity | 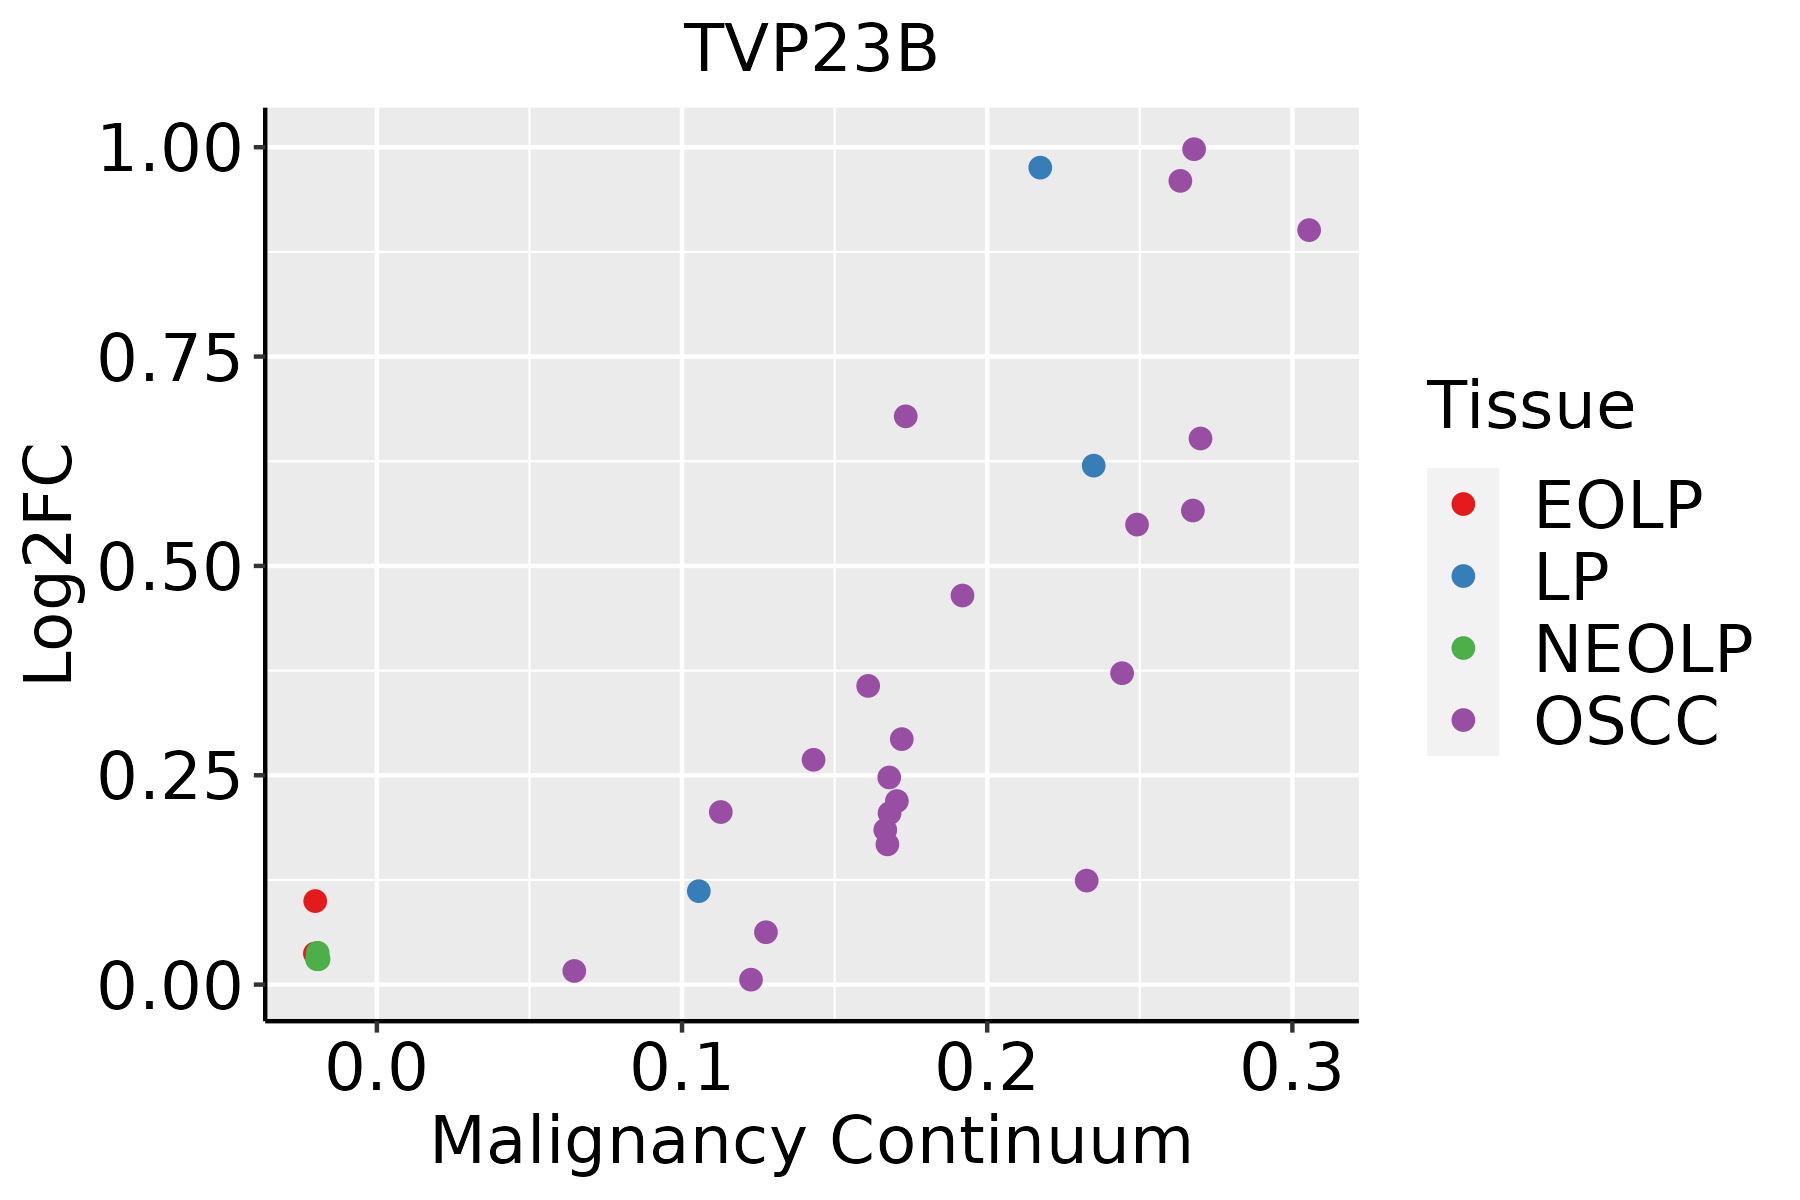 | EOLP: Erosive Oral lichen planus |
| LP: leukoplakia | ||
| NEOLP: Non-erosive oral lichen planus | ||
| OSCC: Oral squamous cell carcinoma | ||
| Skin | 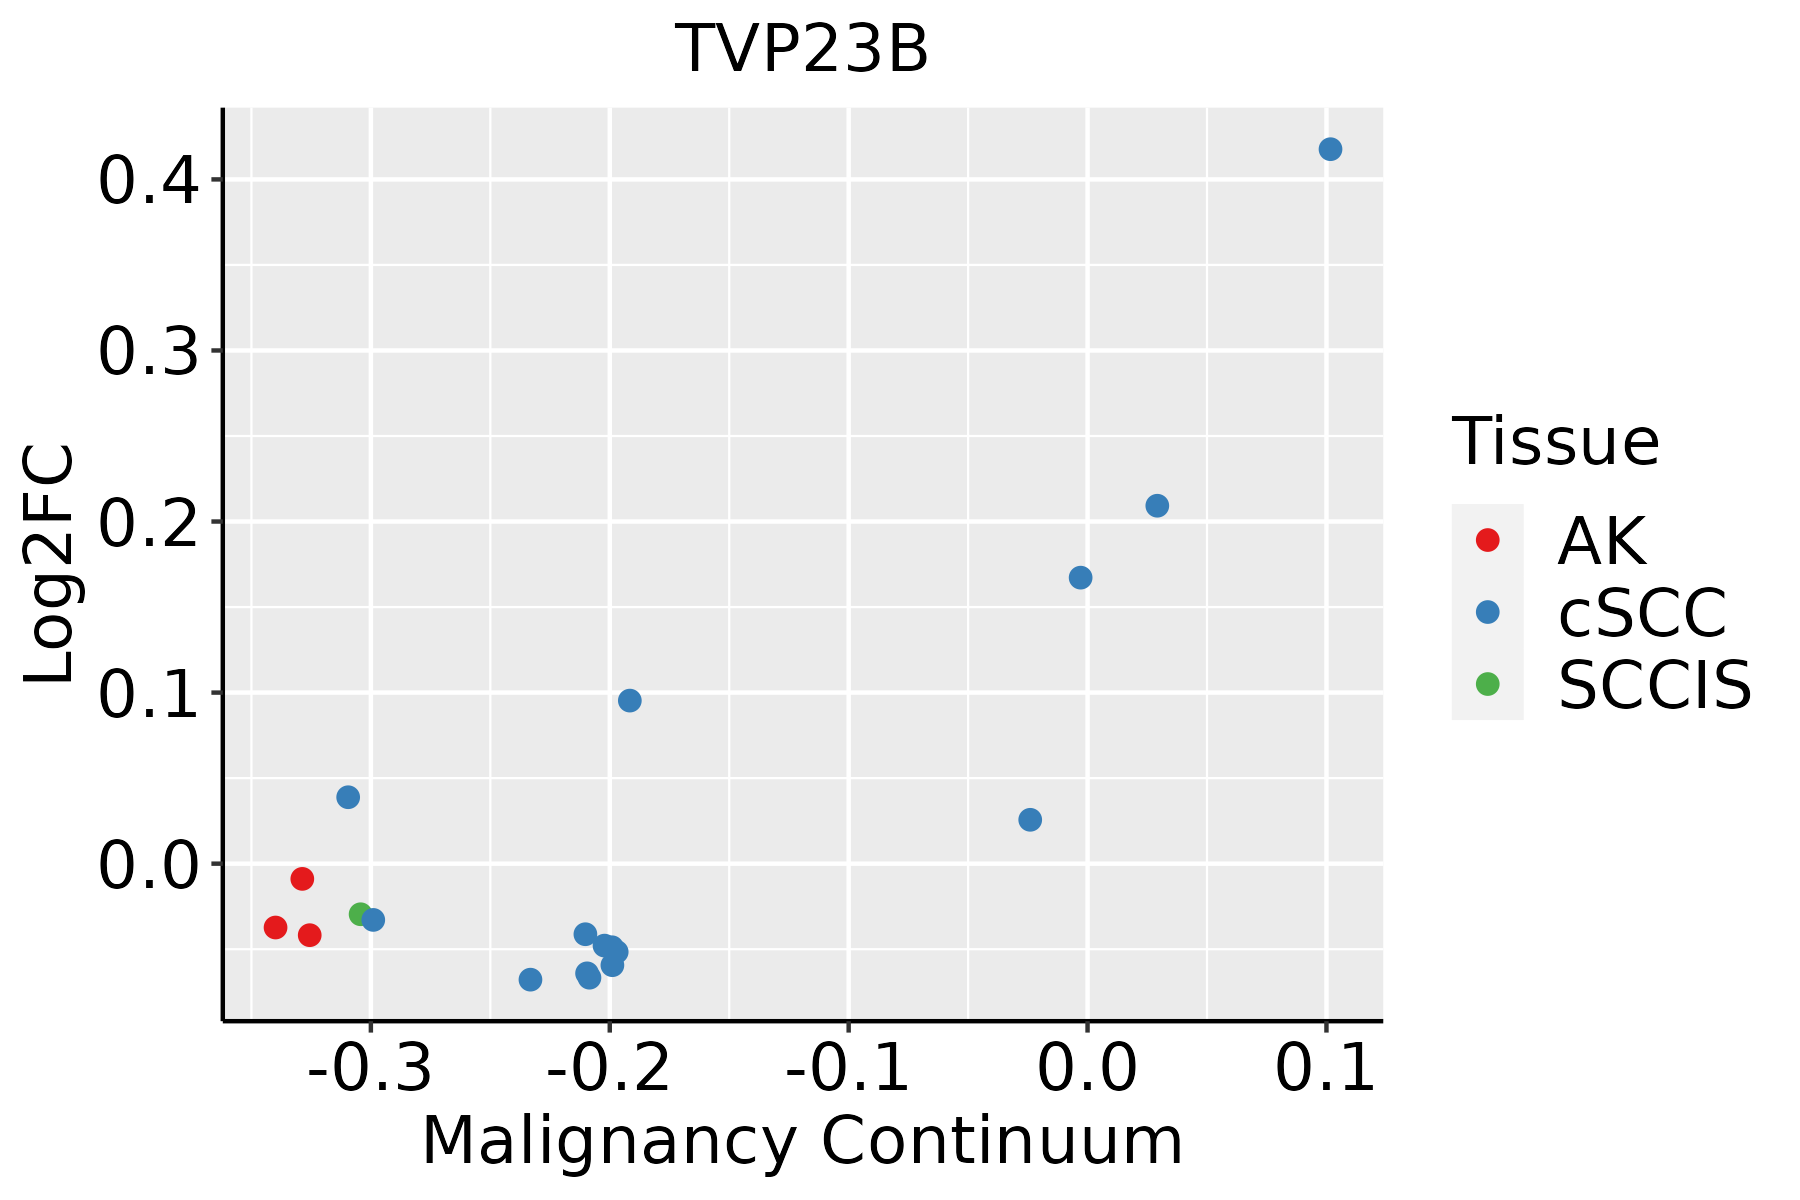 | AK: Actinic keratosis |
| cSCC: Cutaneous squamous cell carcinoma | ||
| SCCIS:squamous cell carcinoma in situ |
| ∗log2FC in expression of this searched gene in stem-like cells from each diseased tissue sample relative to stem-like cells in normal samples in each tissue plotted against the malignancy continuum. Samples are colored based on if they are from different disease stage. |
Top |
Malignant transformation related pathway analysis |
| Find out the enriched GO biological processes and KEGG pathways involved in transition from healthy to precancer to cancer |
| Tissue | Disease Stage | Enriched GO biological Processes |
| Colorectum | AD |  |
| Colorectum | SER |  |
| Colorectum | MSS |  |
| Colorectum | MSI-H |  |
| Colorectum | FAP |  |
| ∗Top 15 enriched GO BP terms are showed in the bar plot of each disease state in each tissue. Each row represents a significant GO biological process which is colored according to the -log10(p.adjust). |
| Page: 1 2 3 4 5 6 7 8 9 |
| GO ID | Tissue | Disease Stage | Description | Gene Ratio | Bg Ratio | pvalue | p.adjust | Count |
| GO:000930617 | Esophagus | ESCC | protein secretion | 190/8552 | 359/18723 | 3.22e-03 | 1.34e-02 | 190 |
| GO:003559217 | Esophagus | ESCC | establishment of protein localization to extracellular region | 190/8552 | 360/18723 | 3.77e-03 | 1.53e-02 | 190 |
| GO:007169210 | Esophagus | ESCC | protein localization to extracellular region | 193/8552 | 368/18723 | 5.01e-03 | 1.92e-02 | 193 |
| GO:003559212 | Liver | HCC | establishment of protein localization to extracellular region | 176/7958 | 360/18723 | 7.96e-03 | 3.15e-02 | 176 |
| GO:000930612 | Liver | HCC | protein secretion | 175/7958 | 359/18723 | 9.32e-03 | 3.57e-02 | 175 |
| GO:000930610 | Oral cavity | OSCC | protein secretion | 169/7305 | 359/18723 | 1.04e-03 | 5.34e-03 | 169 |
| GO:003559210 | Oral cavity | OSCC | establishment of protein localization to extracellular region | 169/7305 | 360/18723 | 1.21e-03 | 6.08e-03 | 169 |
| GO:00716929 | Oral cavity | OSCC | protein localization to extracellular region | 172/7305 | 368/18723 | 1.40e-03 | 6.79e-03 | 172 |
| Page: 1 |
| Pathway ID | Tissue | Disease Stage | Description | Gene Ratio | Bg Ratio | pvalue | p.adjust | qvalue | Count |
| Page: 1 |
Top |
Cell-cell communication analysis |
| Identification of potential cell-cell interactions between two cell types and their ligand-receptor pairs for different disease states |
| Ligand | Receptor | LRpair | Pathway | Tissue | Disease Stage |
| Page: 1 |
Top |
Single-cell gene regulatory network inference analysis |
| Find out the significant the regulons (TFs) and the target genes of each regulon across cell types for different disease states |
| TF | Cell Type | Tissue | Disease Stage | Target Gene | RSS | Regulon Activity |
| ∗The dot plots of a searched regulon are shown for all cell subpopulations in each disease state of each tissue based on the regulon specific score inferred using pySCENIC and by calculating the average expression. |
| Page: 1 |
Top |
Somatic mutation of malignant transformation related genes |
| Annotation of somatic variants for genes involved in malignant transformation |
| Hugo Symbol | Variant Class | Variant Classification | dbSNP RS | HGVSc | HGVSp | HGVSp Short | SWISSPROT | BIOTYPE | SIFT | PolyPhen | Tumor Sample Barcode | Tissue | Histology | Sex | Age | Stage | Therapy Types | Drugs | Outcome |
| TVP23B | SNV | Missense_Mutation | novel | c.326N>A | p.Arg109Lys | p.R109K | Q9NYZ1 | protein_coding | tolerated(0.34) | benign(0.381) | TCGA-BH-A2L8-01 | Breast | breast invasive carcinoma | Female | <65 | I/II | Chemotherapy | cytoxan | CR |
| TVP23B | SNV | Missense_Mutation | rs773241562 | c.449N>C | p.Arg150Thr | p.R150T | Q9NYZ1 | protein_coding | deleterious(0.03) | benign(0.034) | TCGA-DR-A0ZM-01 | Cervix | cervical & endocervical cancer | Female | <65 | III/IV | Unspecific | Cisplatin | SD |
| TVP23B | SNV | Missense_Mutation | rs761798180 | c.272N>A | p.Arg91His | p.R91H | Q9NYZ1 | protein_coding | deleterious(0.04) | probably_damaging(0.989) | TCGA-AA-3994-01 | Colorectum | colon adenocarcinoma | Male | >=65 | III/IV | Chemotherapy | capecitabine | CR |
| TVP23B | SNV | Missense_Mutation | c.424G>A | p.Ala142Thr | p.A142T | Q9NYZ1 | protein_coding | tolerated(0.16) | benign(0.17) | TCGA-CK-4951-01 | Colorectum | colon adenocarcinoma | Female | >=65 | I/II | Unknown | Unknown | PD | |
| TVP23B | SNV | Missense_Mutation | rs768419202 | c.464N>T | p.Ala155Val | p.A155V | Q9NYZ1 | protein_coding | tolerated(0.22) | benign(0.168) | TCGA-AP-A1DV-01 | Endometrium | uterine corpus endometrioid carcinoma | Female | <65 | I/II | Unknown | Unknown | SD |
| TVP23B | SNV | Missense_Mutation | novel | c.557N>T | p.Ala186Val | p.A186V | Q9NYZ1 | protein_coding | tolerated(0.07) | probably_damaging(0.998) | TCGA-AP-A1DV-01 | Endometrium | uterine corpus endometrioid carcinoma | Female | <65 | I/II | Unknown | Unknown | SD |
| TVP23B | SNV | Missense_Mutation | rs769495510 | c.53N>T | p.Ala18Val | p.A18V | Q9NYZ1 | protein_coding | tolerated(0.25) | benign(0.006) | TCGA-AX-A0J1-01 | Endometrium | uterine corpus endometrioid carcinoma | Female | >=65 | I/II | Unknown | Unknown | SD |
| TVP23B | SNV | Missense_Mutation | rs768419202 | c.464N>T | p.Ala155Val | p.A155V | Q9NYZ1 | protein_coding | tolerated(0.22) | benign(0.168) | TCGA-AX-A0J1-01 | Endometrium | uterine corpus endometrioid carcinoma | Female | >=65 | I/II | Unknown | Unknown | SD |
| TVP23B | SNV | Missense_Mutation | rs374582039 | c.530G>A | p.Arg177His | p.R177H | Q9NYZ1 | protein_coding | deleterious(0) | benign(0.003) | TCGA-BS-A0UV-01 | Endometrium | uterine corpus endometrioid carcinoma | Female | <65 | III/IV | Unknown | Unknown | SD |
| TVP23B | SNV | Missense_Mutation | novel | c.208T>G | p.Leu70Val | p.L70V | Q9NYZ1 | protein_coding | deleterious(0.04) | probably_damaging(0.999) | TCGA-EO-A22U-01 | Endometrium | uterine corpus endometrioid carcinoma | Female | >=65 | I/II | Unknown | Unknown | SD |
| Page: 1 2 |
Top |
Related drugs of malignant transformation related genes |
| Identification of chemicals and drugs interact with genes involved in malignant transfromation |
| (DGIdb 4.0) |
| Entrez ID | Symbol | Category | Interaction Types | Drug Claim Name | Drug Name | PMIDs |
| Page: 1 |

Copyright 2023-Present -The University of Texas Health Science Center at Houston |