
|
|||||
|
 | |
| |
| |
| |
| |
| |
|
Gene: TUT7 |
Gene summary for TUT7 |
| Gene information | Species | Human | Gene symbol | TUT7 | Gene ID | 79670 |
| Gene name | terminal uridylyl transferase 7 | |
| Gene Alias | PAPD6 | |
| Cytomap | 9q21.33 | |
| Gene Type | protein-coding | GO ID | GO:0000003 | UniProtAcc | Q5VYS8 |
Top |
Malignant transformation analysis |
| Identification of the aberrant gene expression in precancerous and cancerous lesions by comparing the gene expression of stem-like cells in diseased tissues with normal stem cells |
| Entrez ID | Symbol | Replicates | Species | Organ | Tissue | Adj P-value | Log2FC | Malignancy |
| 79670 | TUT7 | CCI_2 | Human | Cervix | CC | 1.72e-12 | 1.30e+00 | 0.5249 |
| 79670 | TUT7 | CCI_3 | Human | Cervix | CC | 4.34e-09 | 6.81e-01 | 0.516 |
| 79670 | TUT7 | Tumor | Human | Cervix | CC | 7.36e-13 | -2.12e-01 | 0.1241 |
| 79670 | TUT7 | HTA11_3410_2000001011 | Human | Colorectum | AD | 7.29e-03 | -3.85e-01 | 0.0155 |
| 79670 | TUT7 | HTA11_7696_3000711011 | Human | Colorectum | AD | 3.77e-03 | -3.23e-01 | 0.0674 |
| 79670 | TUT7 | HTA11_99999970781_79442 | Human | Colorectum | MSS | 3.45e-30 | -5.64e-01 | 0.294 |
| 79670 | TUT7 | HTA11_99999965104_69814 | Human | Colorectum | MSS | 2.69e-08 | -5.64e-01 | 0.281 |
| 79670 | TUT7 | HTA11_99999971662_82457 | Human | Colorectum | MSS | 3.17e-28 | -5.64e-01 | 0.3859 |
| 79670 | TUT7 | HTA11_99999973899_84307 | Human | Colorectum | MSS | 4.78e-06 | -5.64e-01 | 0.2585 |
| 79670 | TUT7 | HTA11_99999974143_84620 | Human | Colorectum | MSS | 7.76e-28 | -5.64e-01 | 0.3005 |
| 79670 | TUT7 | A015-C-203 | Human | Colorectum | FAP | 5.21e-14 | -2.54e-01 | -0.1294 |
| 79670 | TUT7 | A002-C-201 | Human | Colorectum | FAP | 7.47e-05 | -1.49e-01 | 0.0324 |
| 79670 | TUT7 | A001-C-108 | Human | Colorectum | FAP | 3.63e-07 | 4.50e-02 | -0.0272 |
| 79670 | TUT7 | A002-C-205 | Human | Colorectum | FAP | 9.08e-12 | -1.03e-02 | -0.1236 |
| 79670 | TUT7 | A015-C-006 | Human | Colorectum | FAP | 8.90e-08 | -1.73e-01 | -0.0994 |
| 79670 | TUT7 | A015-C-106 | Human | Colorectum | FAP | 2.00e-04 | -1.58e-01 | -0.0511 |
| 79670 | TUT7 | A002-C-114 | Human | Colorectum | FAP | 4.89e-09 | 3.88e-02 | -0.1561 |
| 79670 | TUT7 | A015-C-104 | Human | Colorectum | FAP | 5.57e-17 | -1.97e-01 | -0.1899 |
| 79670 | TUT7 | A001-C-014 | Human | Colorectum | FAP | 3.38e-06 | -1.28e-01 | 0.0135 |
| 79670 | TUT7 | A002-C-016 | Human | Colorectum | FAP | 7.22e-09 | -1.36e-01 | 0.0521 |
| Page: 1 2 3 4 5 |
| Tissue | Expression Dynamics | Abbreviation |
| Cervix |  | CC: Cervix cancer |
| HSIL_HPV: HPV-infected high-grade squamous intraepithelial lesions | ||
| N_HPV: HPV-infected normal cervix | ||
| Colorectum (GSE201348) |  | FAP: Familial adenomatous polyposis |
| CRC: Colorectal cancer | ||
| Colorectum (HTA11) |  | AD: Adenomas |
| SER: Sessile serrated lesions | ||
| MSI-H: Microsatellite-high colorectal cancer | ||
| MSS: Microsatellite stable colorectal cancer | ||
| Endometrium | 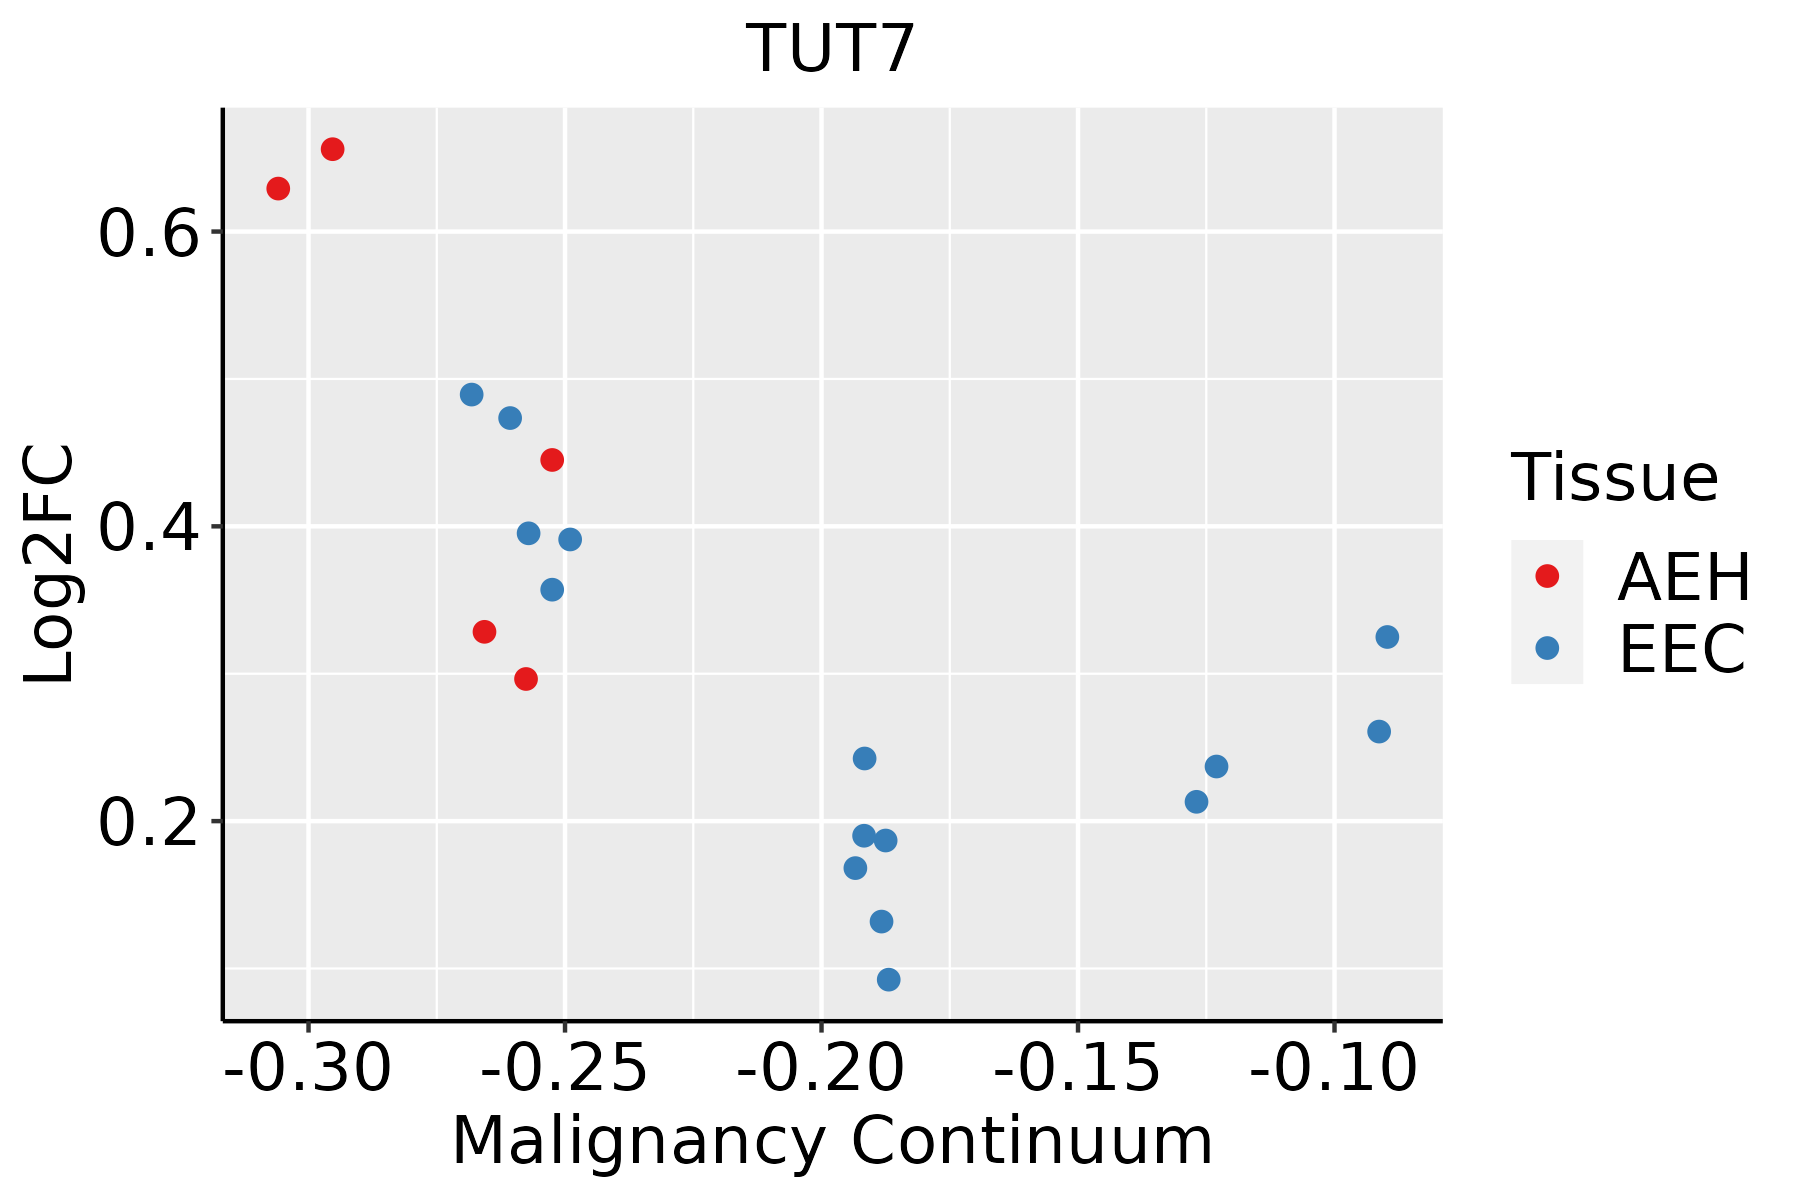 | AEH: Atypical endometrial hyperplasia |
| EEC: Endometrioid Cancer | ||
| Liver | 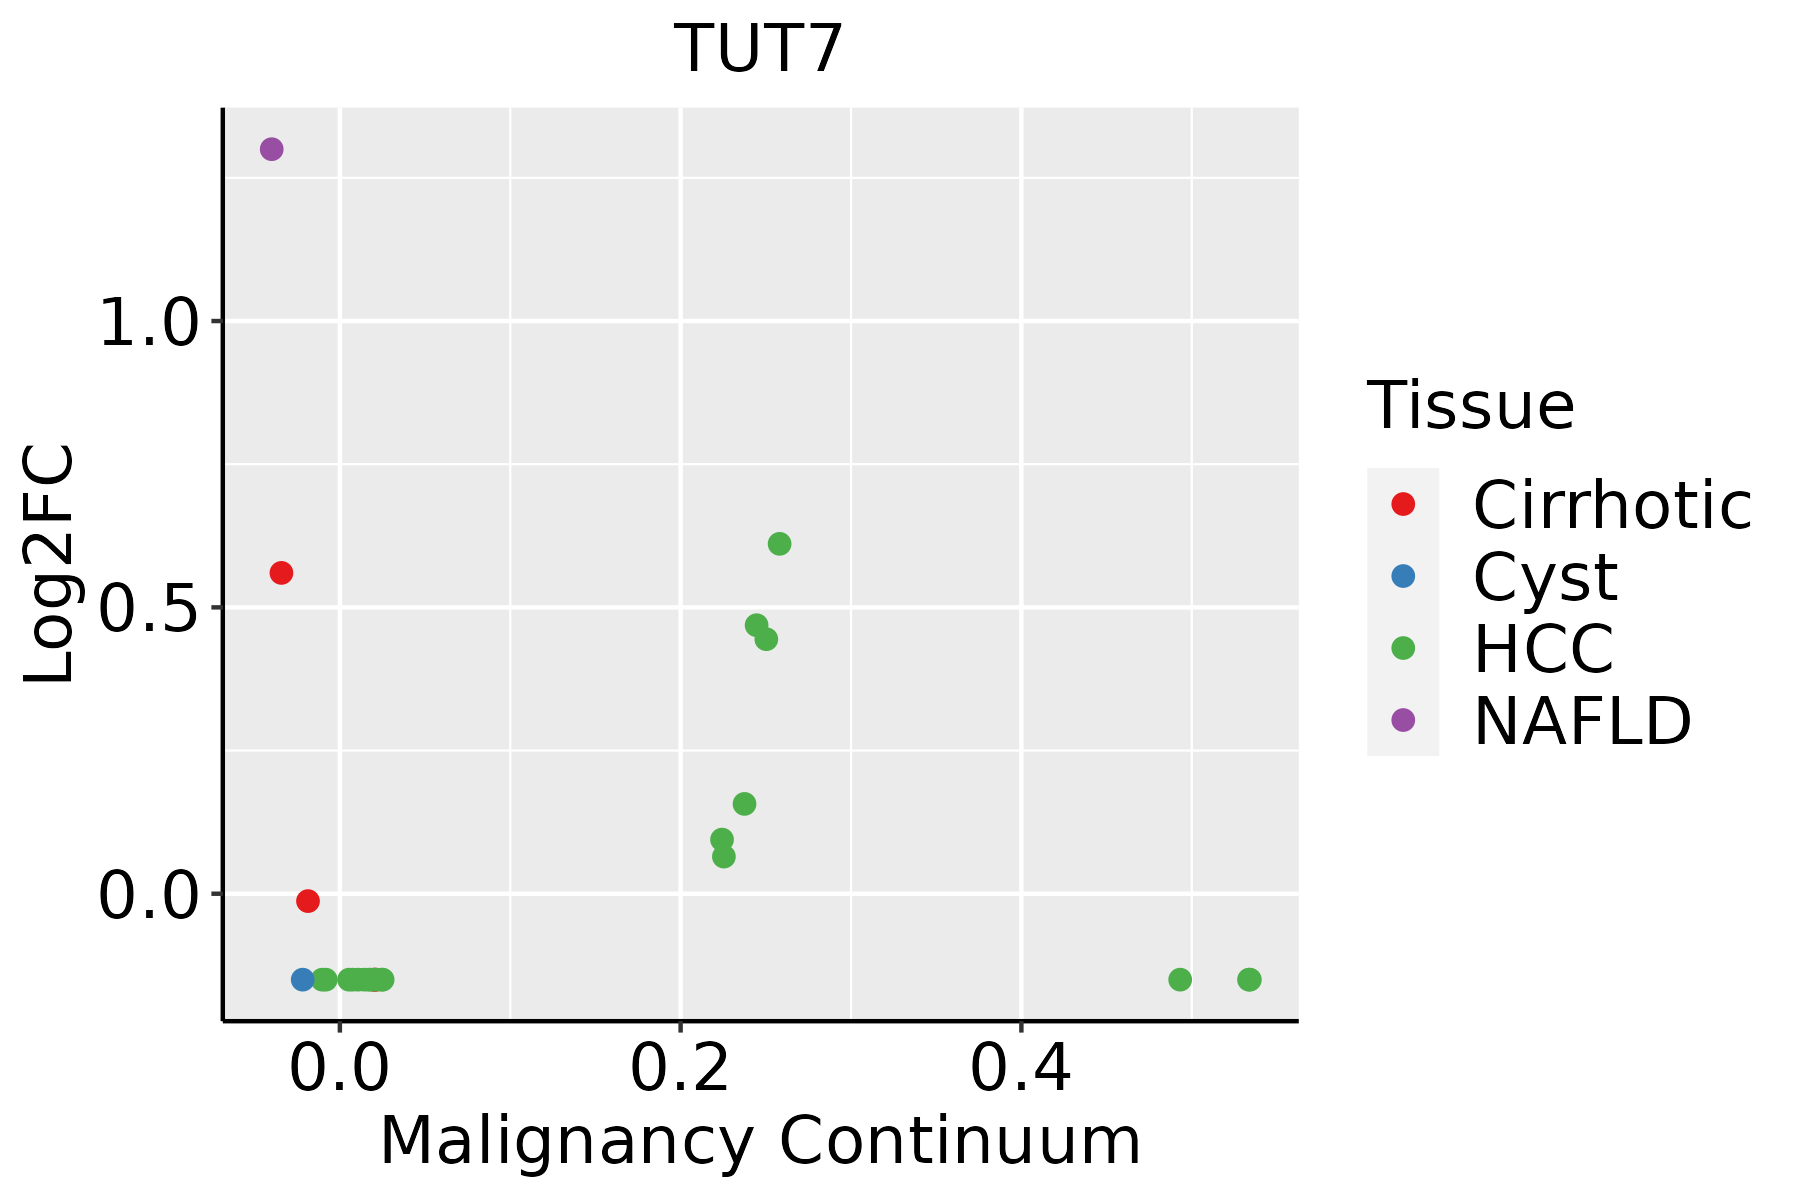 | HCC: Hepatocellular carcinoma |
| NAFLD: Non-alcoholic fatty liver disease | ||
| Lung | 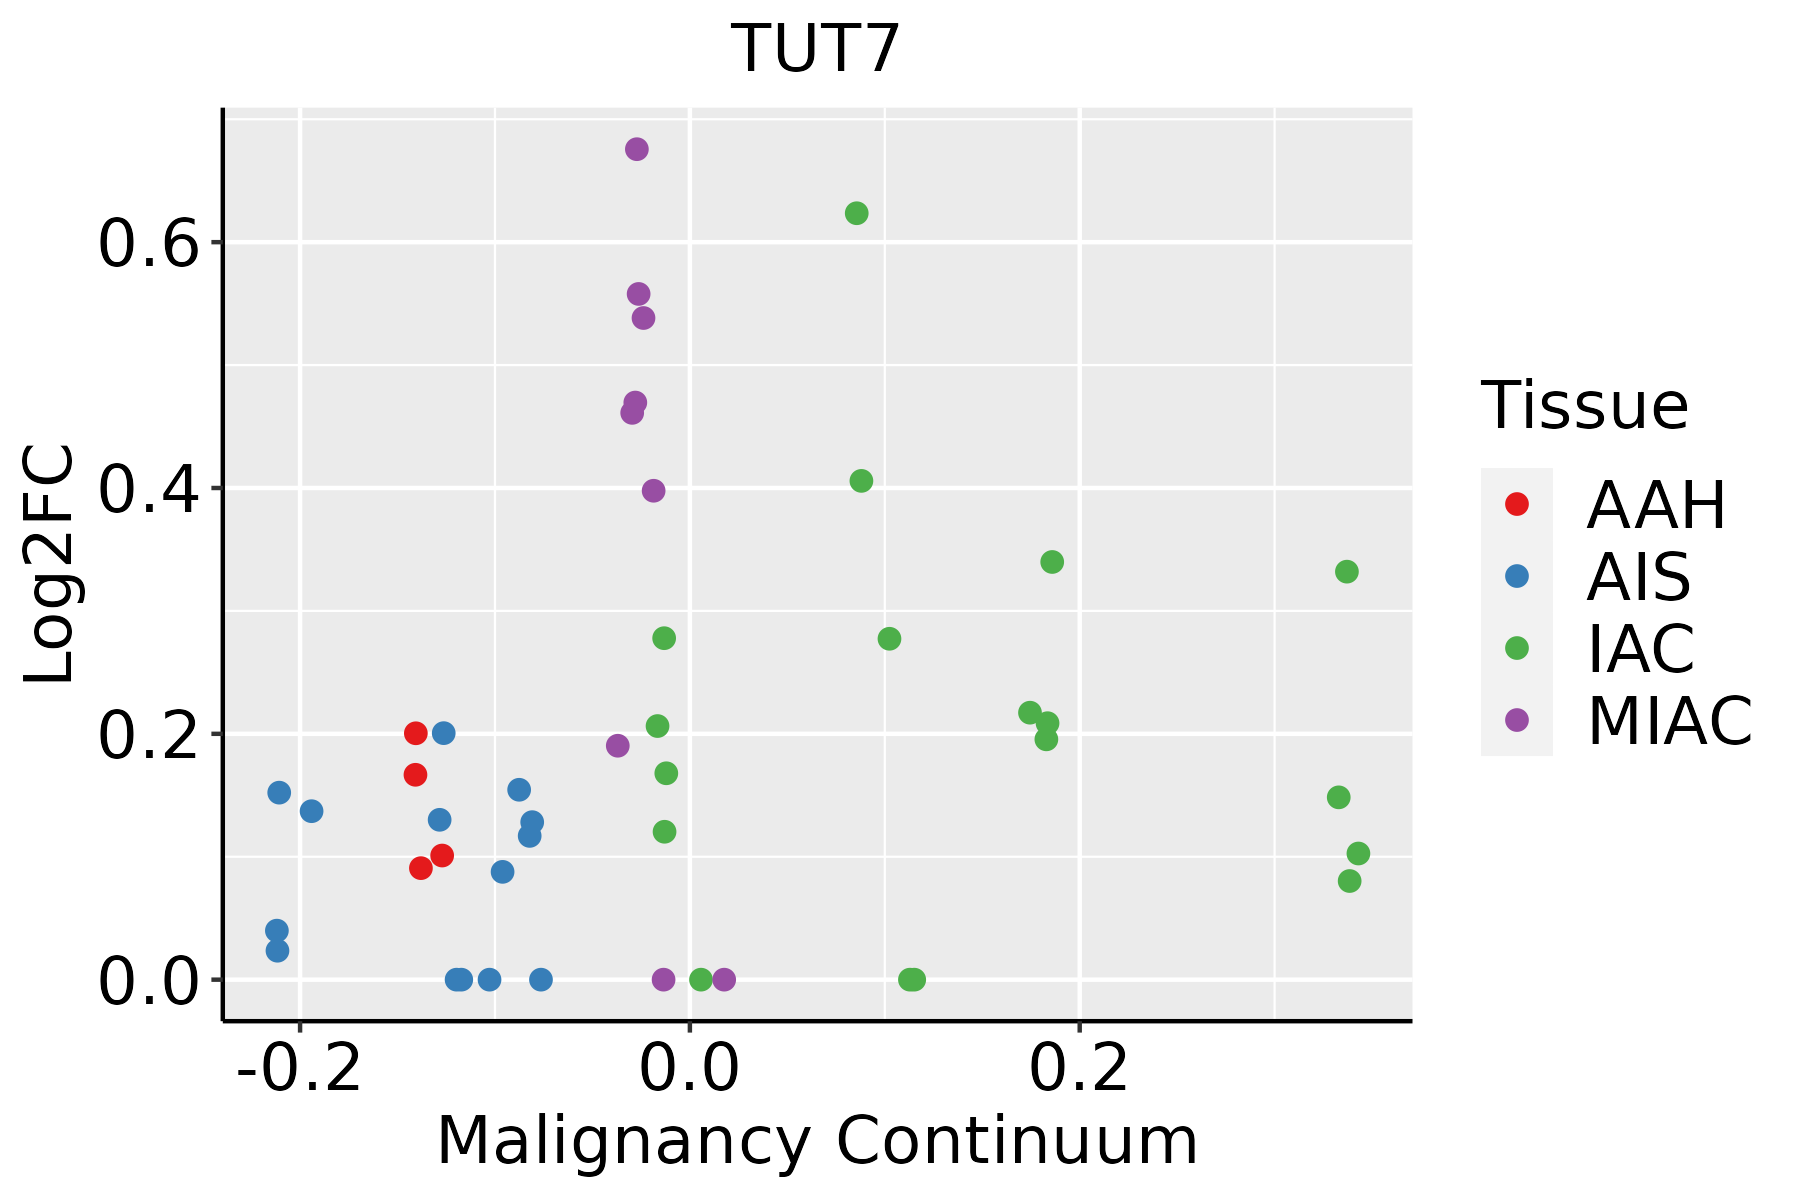 | AAH: Atypical adenomatous hyperplasia |
| AIS: Adenocarcinoma in situ | ||
| IAC: Invasive lung adenocarcinoma | ||
| MIA: Minimally invasive adenocarcinoma | ||
| Skin | 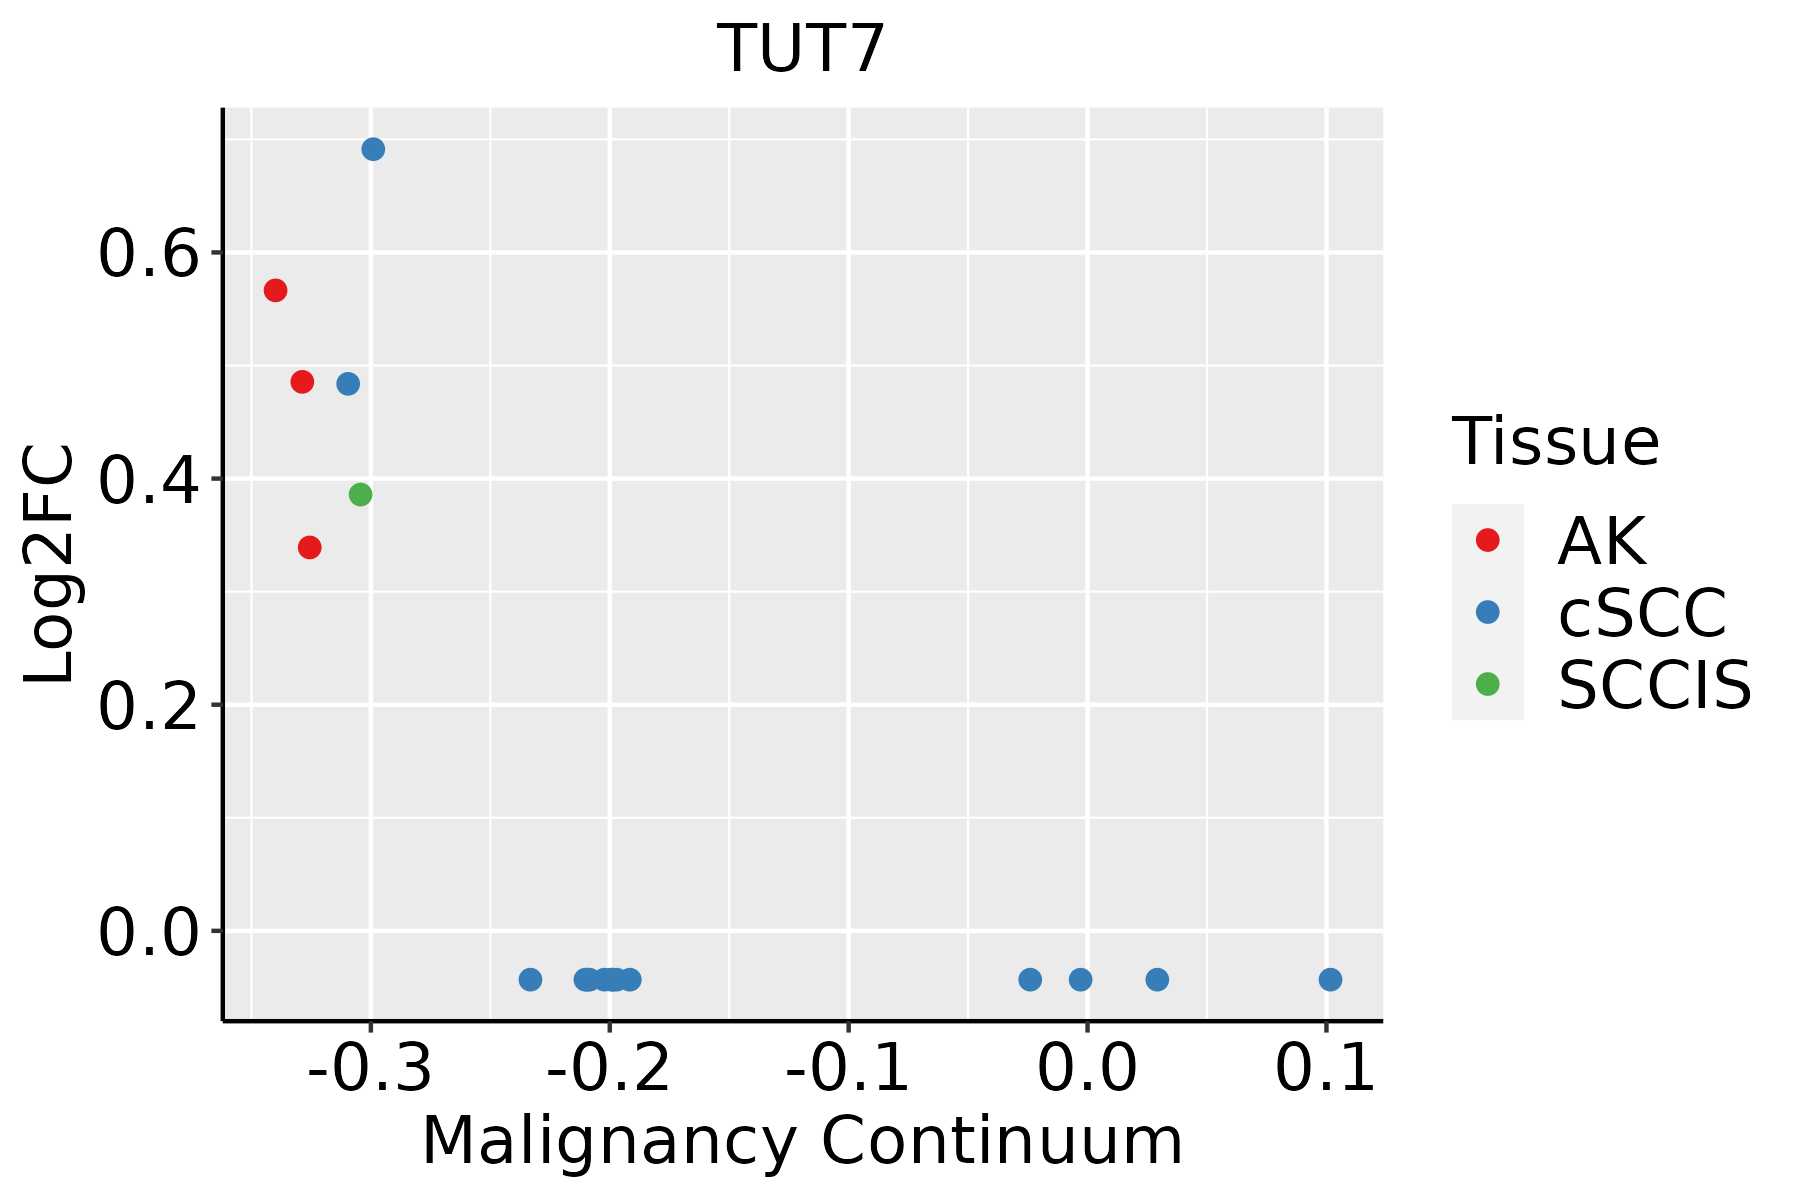 | AK: Actinic keratosis |
| cSCC: Cutaneous squamous cell carcinoma | ||
| SCCIS:squamous cell carcinoma in situ | ||
| Thyroid | 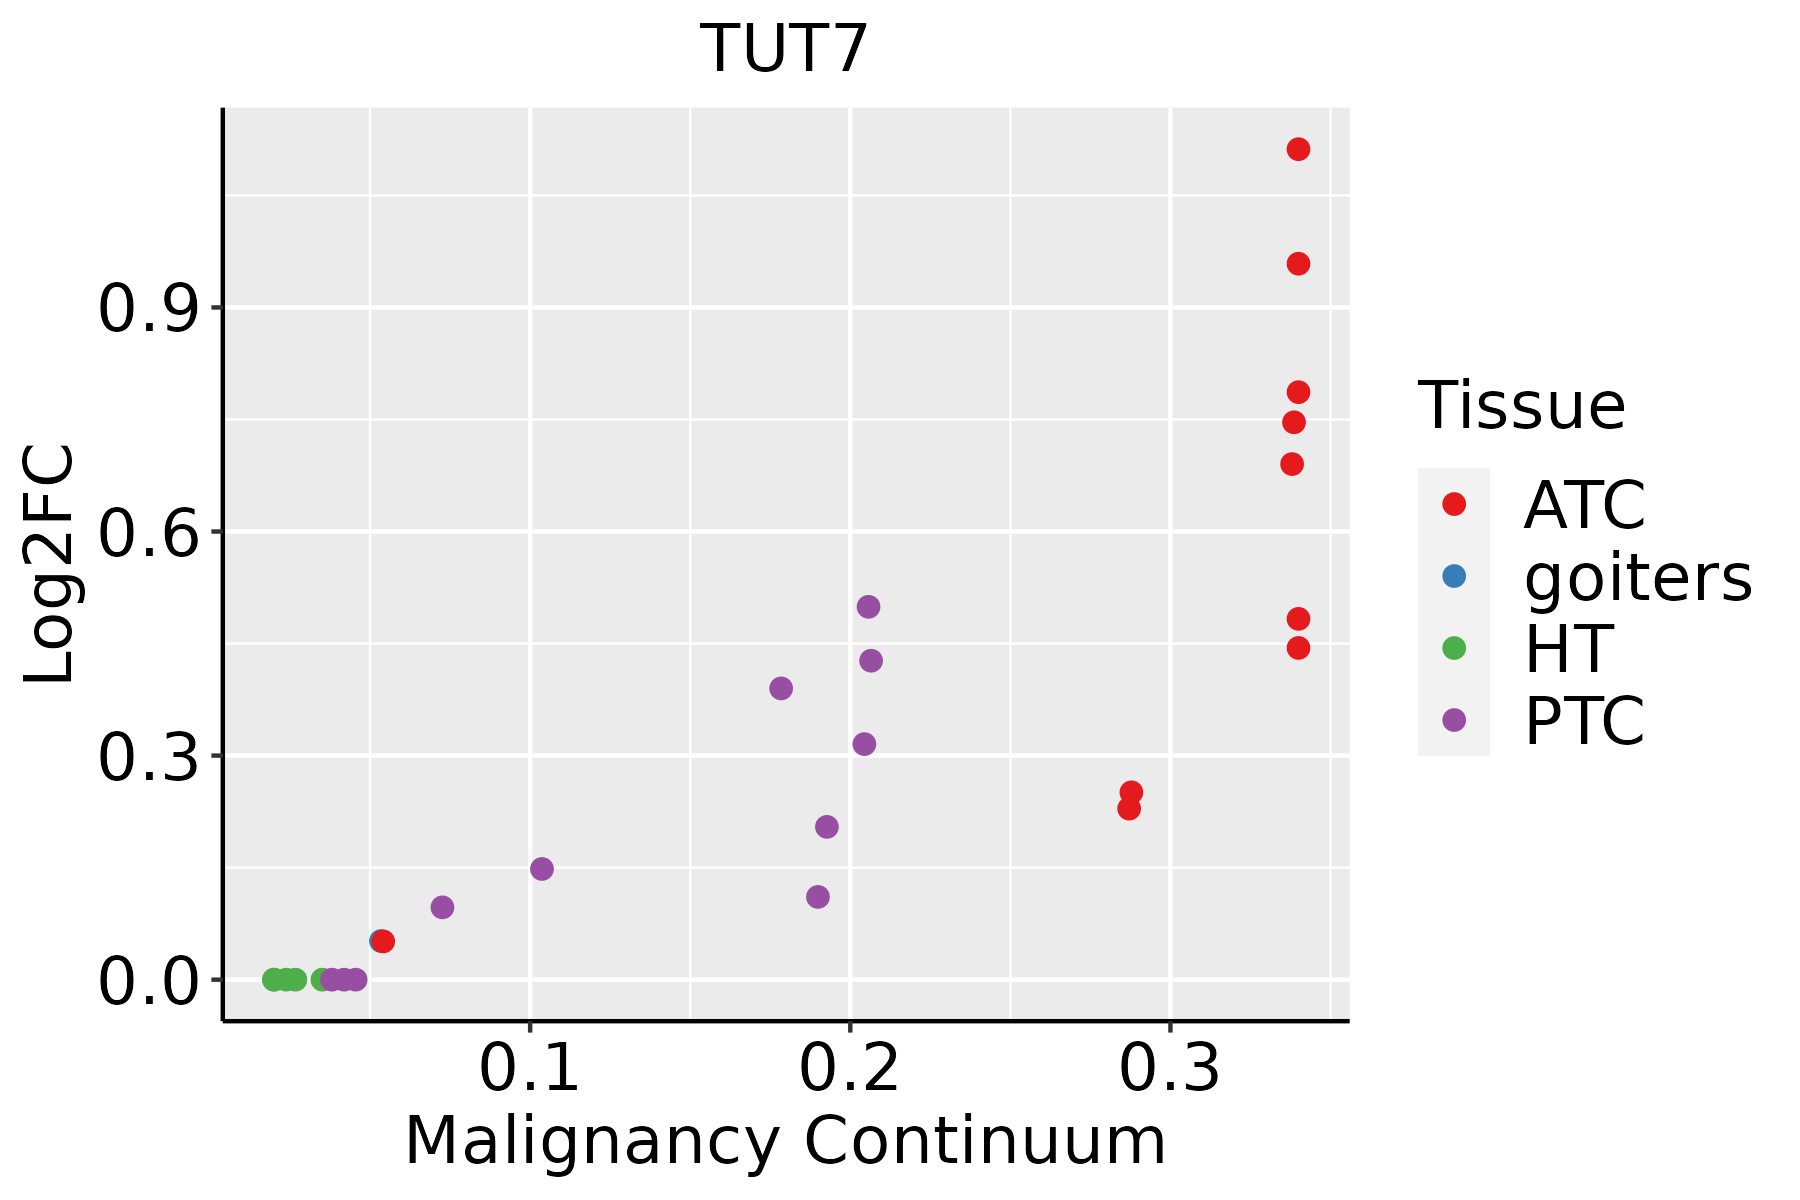 | ATC: Anaplastic thyroid cancer |
| HT: Hashimoto's thyroiditis | ||
| PTC: Papillary thyroid cancer |
| ∗log2FC in expression of this searched gene in stem-like cells from each diseased tissue sample relative to stem-like cells in normal samples in each tissue plotted against the malignancy continuum. Samples are colored based on if they are from different disease stage. |
Top |
Malignant transformation related pathway analysis |
| Find out the enriched GO biological processes and KEGG pathways involved in transition from healthy to precancer to cancer |
| Tissue | Disease Stage | Enriched GO biological Processes |
| Colorectum | AD |  |
| Colorectum | SER |  |
| Colorectum | MSS |  |
| Colorectum | MSI-H |  |
| Colorectum | FAP |  |
| ∗Top 15 enriched GO BP terms are showed in the bar plot of each disease state in each tissue. Each row represents a significant GO biological process which is colored according to the -log10(p.adjust). |
| Page: 1 2 3 4 5 6 7 8 9 |
| GO ID | Tissue | Disease Stage | Description | Gene Ratio | Bg Ratio | pvalue | p.adjust | Count |
| GO:000989610 | Cervix | CC | positive regulation of catabolic process | 109/2311 | 492/18723 | 5.26e-10 | 6.99e-08 | 109 |
| GO:003133110 | Cervix | CC | positive regulation of cellular catabolic process | 91/2311 | 427/18723 | 9.64e-08 | 5.25e-06 | 91 |
| GO:00064029 | Cervix | CC | mRNA catabolic process | 56/2311 | 232/18723 | 4.81e-07 | 1.83e-05 | 56 |
| GO:19033119 | Cervix | CC | regulation of mRNA metabolic process | 64/2311 | 288/18723 | 1.71e-06 | 5.64e-05 | 64 |
| GO:00064019 | Cervix | CC | RNA catabolic process | 62/2311 | 278/18723 | 2.18e-06 | 6.56e-05 | 62 |
| GO:00002896 | Cervix | CC | nuclear-transcribed mRNA poly(A) tail shortening | 13/2311 | 29/18723 | 1.48e-05 | 2.93e-04 | 13 |
| GO:000641710 | Cervix | CC | regulation of translation | 89/2311 | 468/18723 | 1.86e-05 | 3.46e-04 | 89 |
| GO:00009567 | Cervix | CC | nuclear-transcribed mRNA catabolic process | 30/2311 | 112/18723 | 2.60e-05 | 4.37e-04 | 30 |
| GO:00002886 | Cervix | CC | nuclear-transcribed mRNA catabolic process, deadenylation-dependent decay | 18/2311 | 56/18723 | 8.42e-05 | 1.13e-03 | 18 |
| GO:00610139 | Cervix | CC | regulation of mRNA catabolic process | 38/2311 | 166/18723 | 1.07e-04 | 1.36e-03 | 38 |
| GO:19033136 | Cervix | CC | positive regulation of mRNA metabolic process | 29/2311 | 118/18723 | 1.86e-04 | 2.18e-03 | 29 |
| GO:00467008 | Cervix | CC | heterocycle catabolic process | 80/2311 | 445/18723 | 3.23e-04 | 3.42e-03 | 80 |
| GO:00346559 | Cervix | CC | nucleobase-containing compound catabolic process | 74/2311 | 407/18723 | 3.77e-04 | 3.88e-03 | 74 |
| GO:00434889 | Cervix | CC | regulation of mRNA stability | 35/2311 | 158/18723 | 3.80e-04 | 3.89e-03 | 35 |
| GO:00611576 | Cervix | CC | mRNA destabilization | 22/2311 | 84/18723 | 4.18e-04 | 4.23e-03 | 22 |
| GO:00610146 | Cervix | CC | positive regulation of mRNA catabolic process | 22/2311 | 87/18723 | 7.03e-04 | 6.40e-03 | 22 |
| GO:00434879 | Cervix | CC | regulation of RNA stability | 36/2311 | 170/18723 | 7.72e-04 | 6.86e-03 | 36 |
| GO:00442709 | Cervix | CC | cellular nitrogen compound catabolic process | 79/2311 | 451/18723 | 7.80e-04 | 6.91e-03 | 79 |
| GO:00507796 | Cervix | CC | RNA destabilization | 22/2311 | 88/18723 | 8.30e-04 | 7.23e-03 | 22 |
| GO:00194398 | Cervix | CC | aromatic compound catabolic process | 79/2311 | 467/18723 | 2.14e-03 | 1.54e-02 | 79 |
| Page: 1 2 3 4 5 6 7 8 9 10 11 12 13 14 15 16 17 18 19 20 21 22 |
| Pathway ID | Tissue | Disease Stage | Description | Gene Ratio | Bg Ratio | pvalue | p.adjust | qvalue | Count |
| Page: 1 |
Top |
Cell-cell communication analysis |
| Identification of potential cell-cell interactions between two cell types and their ligand-receptor pairs for different disease states |
| Ligand | Receptor | LRpair | Pathway | Tissue | Disease Stage |
| Page: 1 |
Top |
Single-cell gene regulatory network inference analysis |
| Find out the significant the regulons (TFs) and the target genes of each regulon across cell types for different disease states |
| TF | Cell Type | Tissue | Disease Stage | Target Gene | RSS | Regulon Activity |
| ∗The dot plots of a searched regulon are shown for all cell subpopulations in each disease state of each tissue based on the regulon specific score inferred using pySCENIC and by calculating the average expression. |
| Page: 1 |
Top |
Somatic mutation of malignant transformation related genes |
| Annotation of somatic variants for genes involved in malignant transformation |
| Hugo Symbol | Variant Class | Variant Classification | dbSNP RS | HGVSc | HGVSp | HGVSp Short | SWISSPROT | BIOTYPE | SIFT | PolyPhen | Tumor Sample Barcode | Tissue | Histology | Sex | Age | Stage | Therapy Types | Drugs | Outcome |
| Page: 1 |
Top |
Related drugs of malignant transformation related genes |
| Identification of chemicals and drugs interact with genes involved in malignant transfromation |
| (DGIdb 4.0) |
| Entrez ID | Symbol | Category | Interaction Types | Drug Claim Name | Drug Name | PMIDs |
| Page: 1 |

Copyright 2023-Present -The University of Texas Health Science Center at Houston |