
|
|||||
|
 | |
| |
| |
| |
| |
| |
|
Gene: TUSC3 |
Gene summary for TUSC3 |
| Gene information | Species | Human | Gene symbol | TUSC3 | Gene ID | 7991 |
| Gene name | tumor suppressor candidate 3 | |
| Gene Alias | D8S1992 | |
| Cytomap | 8p22 | |
| Gene Type | protein-coding | GO ID | GO:0003008 | UniProtAcc | Q13454 |
Top |
Malignant transformation analysis |
| Identification of the aberrant gene expression in precancerous and cancerous lesions by comparing the gene expression of stem-like cells in diseased tissues with normal stem cells |
| Entrez ID | Symbol | Replicates | Species | Organ | Tissue | Adj P-value | Log2FC | Malignancy |
| 7991 | TUSC3 | LZE2T | Human | Esophagus | ESCC | 3.77e-05 | 7.75e-01 | 0.082 |
| 7991 | TUSC3 | LZE4T | Human | Esophagus | ESCC | 9.92e-17 | 6.66e-01 | 0.0811 |
| 7991 | TUSC3 | LZE20T | Human | Esophagus | ESCC | 4.22e-06 | 1.52e-01 | 0.0662 |
| 7991 | TUSC3 | LZE22T | Human | Esophagus | ESCC | 1.11e-08 | 7.03e-01 | 0.068 |
| 7991 | TUSC3 | P2T-E | Human | Esophagus | ESCC | 2.70e-130 | 2.69e+00 | 0.1177 |
| 7991 | TUSC3 | P4T-E | Human | Esophagus | ESCC | 7.47e-77 | 2.19e+00 | 0.1323 |
| 7991 | TUSC3 | P5T-E | Human | Esophagus | ESCC | 2.39e-24 | 5.69e-01 | 0.1327 |
| 7991 | TUSC3 | P8T-E | Human | Esophagus | ESCC | 6.71e-60 | 1.23e+00 | 0.0889 |
| 7991 | TUSC3 | P9T-E | Human | Esophagus | ESCC | 2.14e-09 | 5.08e-01 | 0.1131 |
| 7991 | TUSC3 | P10T-E | Human | Esophagus | ESCC | 6.60e-111 | 2.37e+00 | 0.116 |
| 7991 | TUSC3 | P11T-E | Human | Esophagus | ESCC | 2.77e-07 | 7.21e-01 | 0.1426 |
| 7991 | TUSC3 | P12T-E | Human | Esophagus | ESCC | 9.13e-35 | 7.76e-01 | 0.1122 |
| 7991 | TUSC3 | P16T-E | Human | Esophagus | ESCC | 7.46e-101 | 1.99e+00 | 0.1153 |
| 7991 | TUSC3 | P17T-E | Human | Esophagus | ESCC | 2.55e-08 | 8.01e-01 | 0.1278 |
| 7991 | TUSC3 | P19T-E | Human | Esophagus | ESCC | 3.90e-03 | 8.29e-01 | 0.1662 |
| 7991 | TUSC3 | P20T-E | Human | Esophagus | ESCC | 1.80e-22 | 4.23e-01 | 0.1124 |
| 7991 | TUSC3 | P21T-E | Human | Esophagus | ESCC | 2.18e-51 | 1.11e+00 | 0.1617 |
| 7991 | TUSC3 | P22T-E | Human | Esophagus | ESCC | 8.16e-75 | 1.36e+00 | 0.1236 |
| 7991 | TUSC3 | P23T-E | Human | Esophagus | ESCC | 6.50e-22 | 9.25e-01 | 0.108 |
| 7991 | TUSC3 | P24T-E | Human | Esophagus | ESCC | 9.15e-56 | 1.39e+00 | 0.1287 |
| Page: 1 2 3 4 5 6 |
| Tissue | Expression Dynamics | Abbreviation |
| Esophagus | 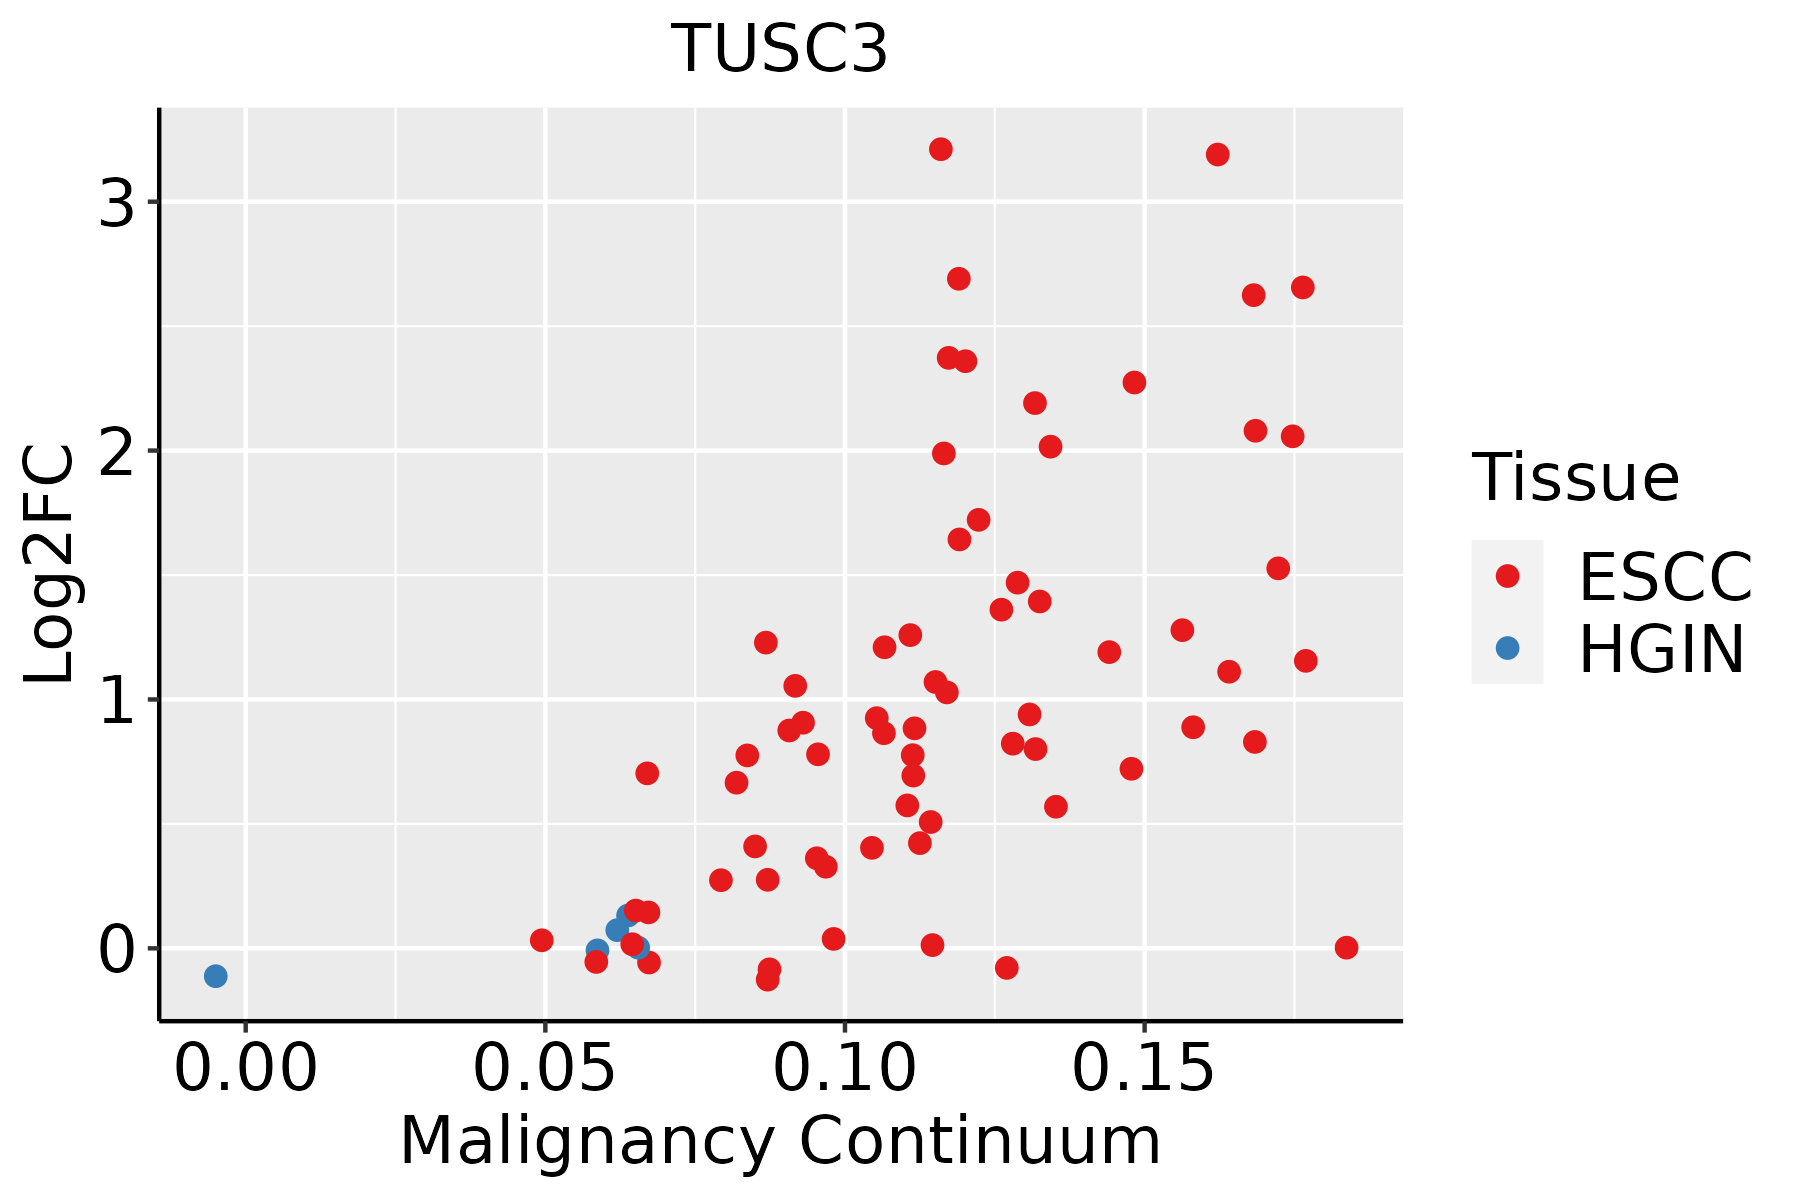 | ESCC: Esophageal squamous cell carcinoma |
| HGIN: High-grade intraepithelial neoplasias | ||
| LGIN: Low-grade intraepithelial neoplasias | ||
| Liver |  | HCC: Hepatocellular carcinoma |
| NAFLD: Non-alcoholic fatty liver disease | ||
| Oral Cavity | 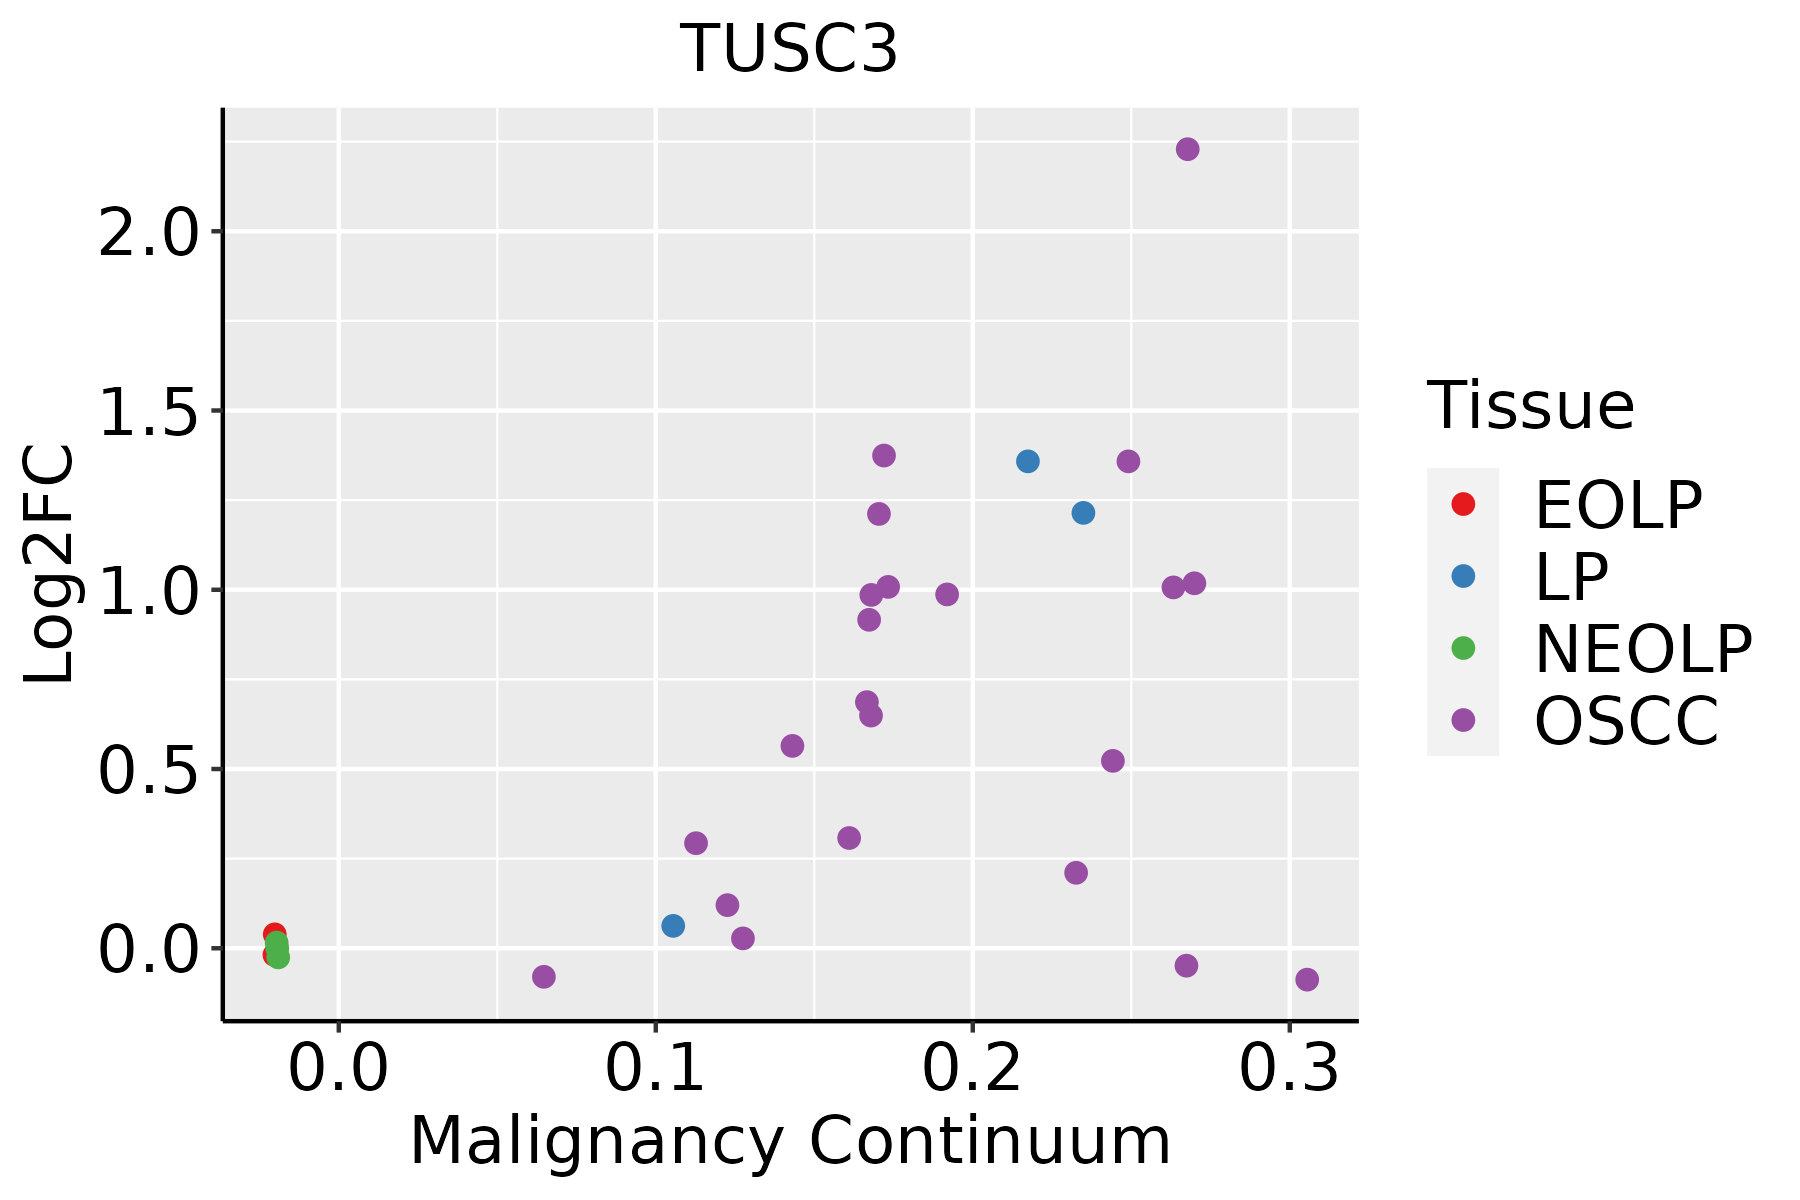 | EOLP: Erosive Oral lichen planus |
| LP: leukoplakia | ||
| NEOLP: Non-erosive oral lichen planus | ||
| OSCC: Oral squamous cell carcinoma | ||
| Prostate | 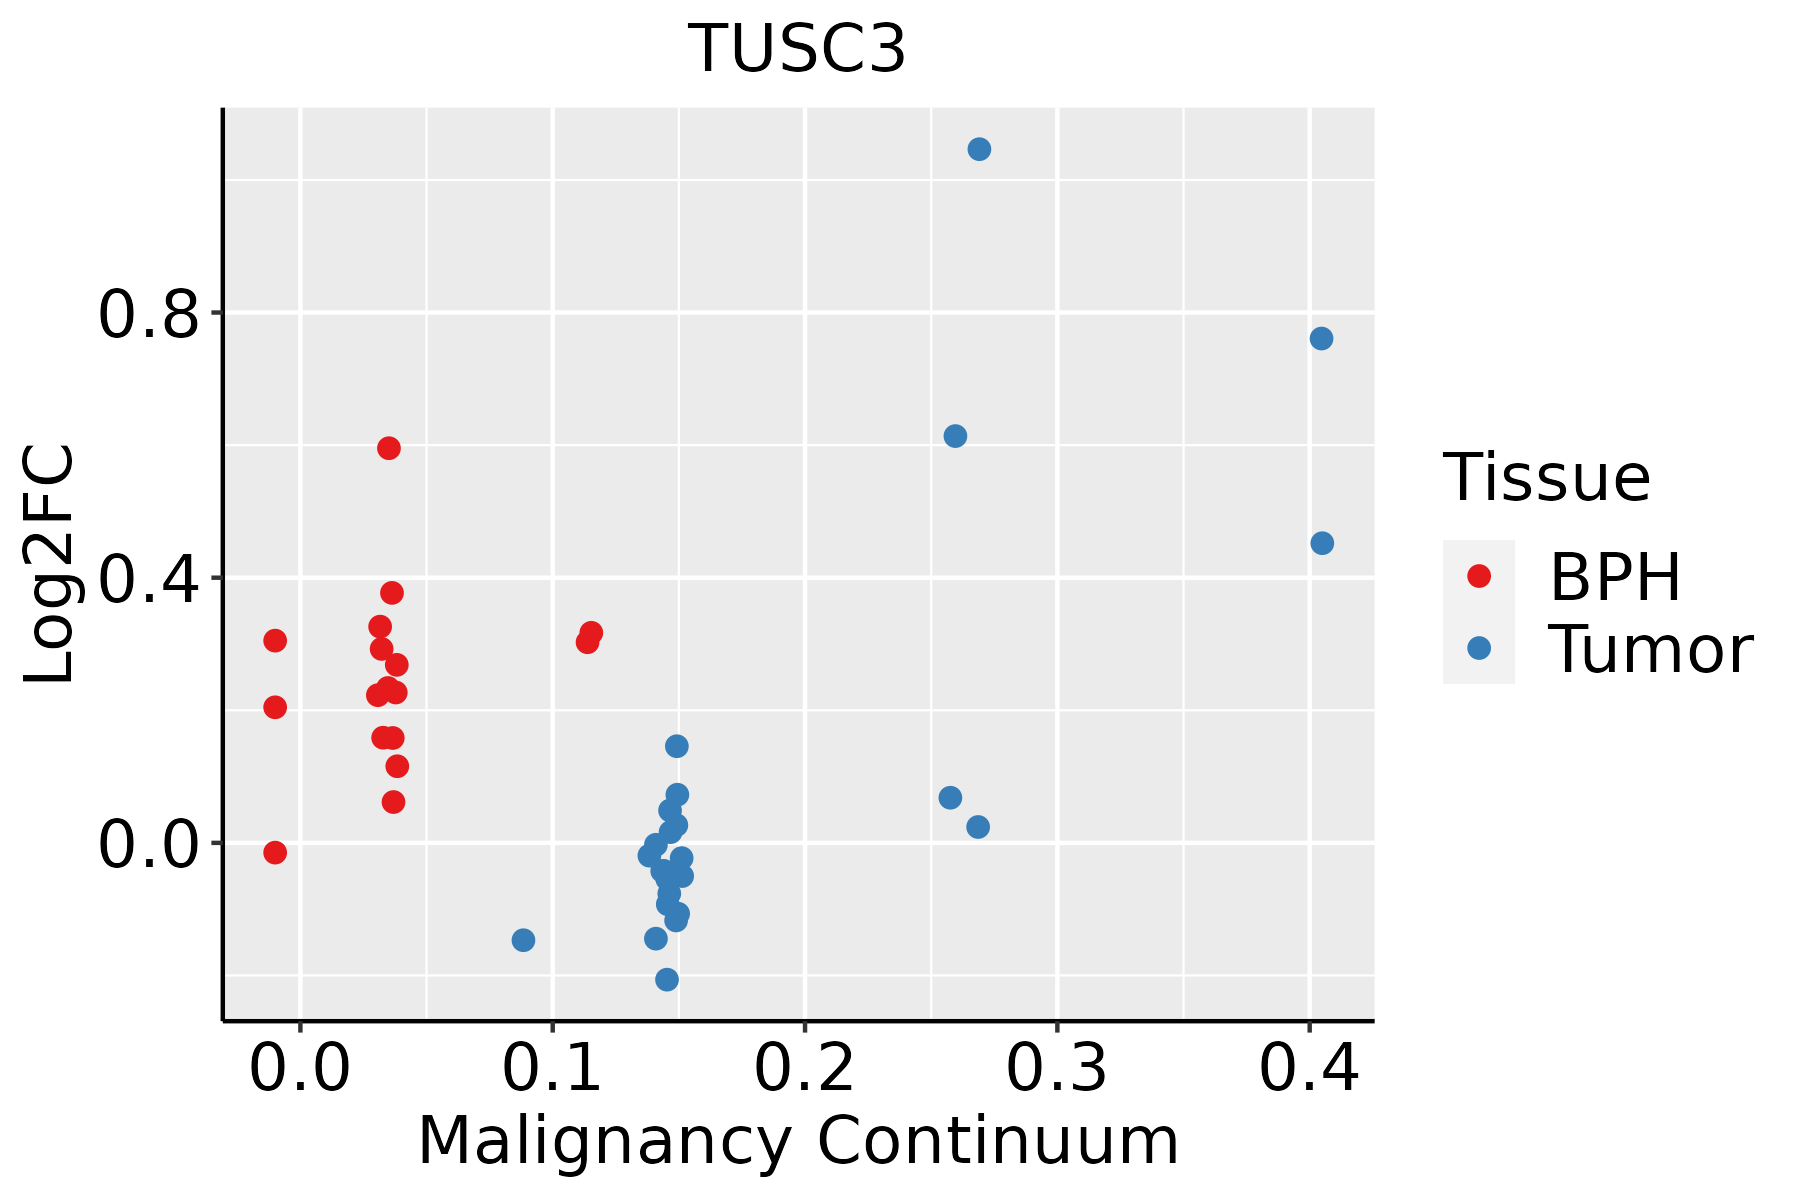 | BPH: Benign Prostatic Hyperplasia |
| Skin | 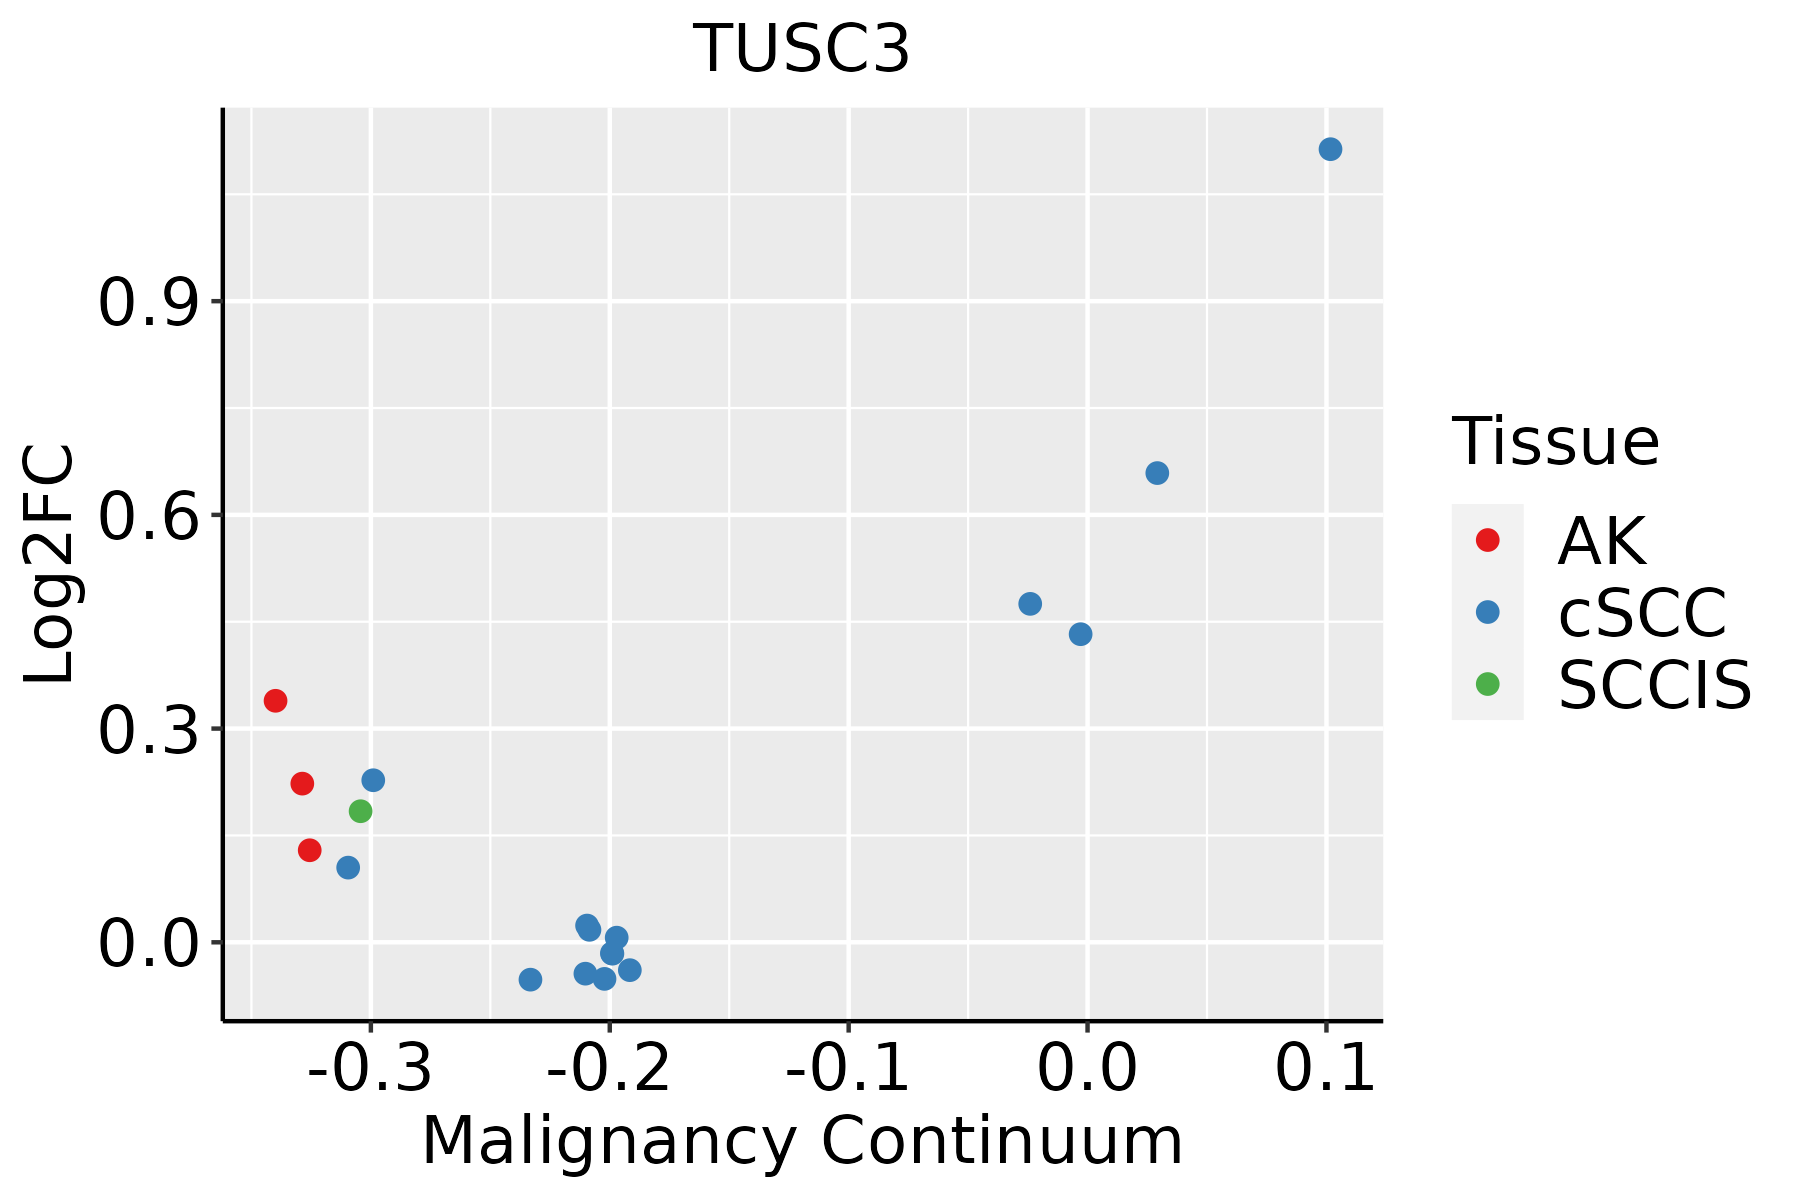 | AK: Actinic keratosis |
| cSCC: Cutaneous squamous cell carcinoma | ||
| SCCIS:squamous cell carcinoma in situ | ||
| Thyroid | 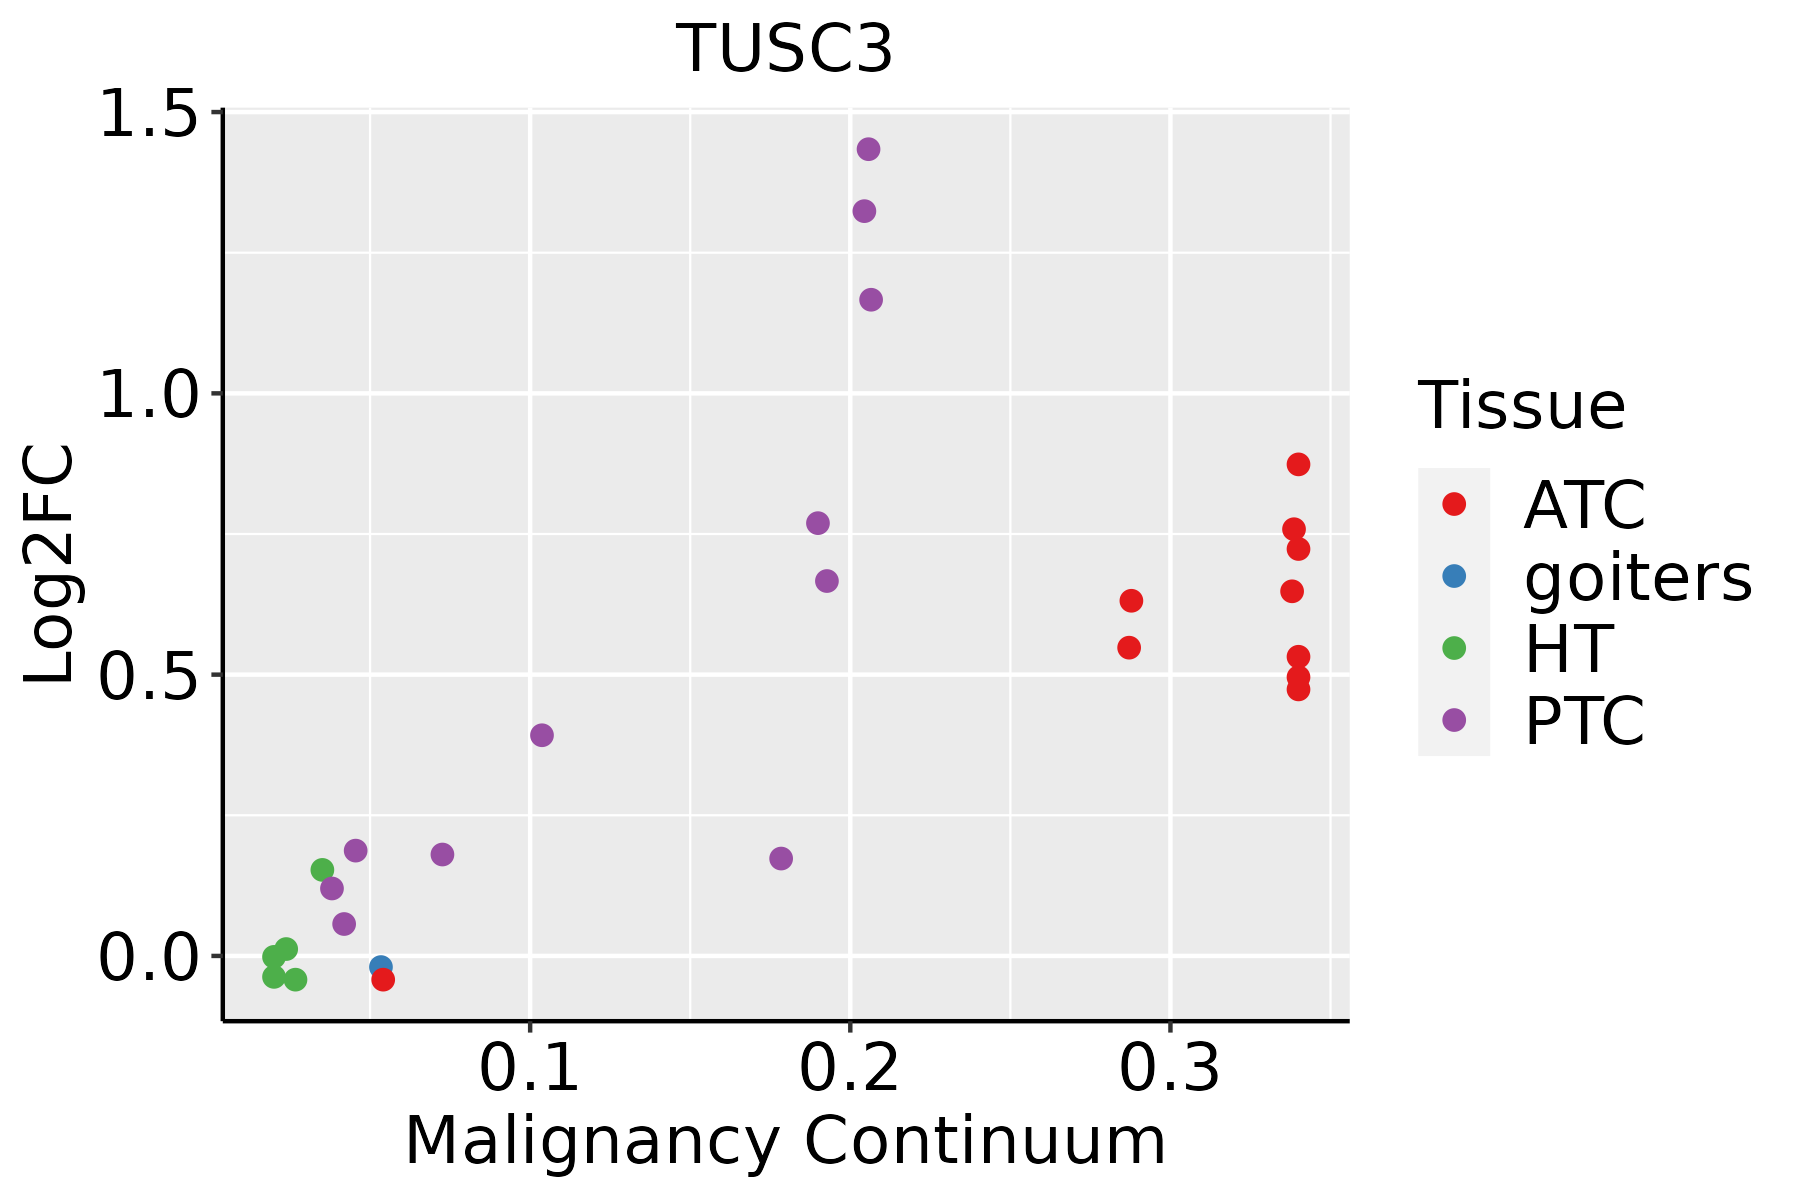 | ATC: Anaplastic thyroid cancer |
| HT: Hashimoto's thyroiditis | ||
| PTC: Papillary thyroid cancer |
| ∗log2FC in expression of this searched gene in stem-like cells from each diseased tissue sample relative to stem-like cells in normal samples in each tissue plotted against the malignancy continuum. Samples are colored based on if they are from different disease stage. |
Top |
Malignant transformation related pathway analysis |
| Find out the enriched GO biological processes and KEGG pathways involved in transition from healthy to precancer to cancer |
| Tissue | Disease Stage | Enriched GO biological Processes |
| Colorectum | AD |  |
| Colorectum | SER |  |
| Colorectum | MSS |  |
| Colorectum | MSI-H |  |
| Colorectum | FAP |  |
| ∗Top 15 enriched GO BP terms are showed in the bar plot of each disease state in each tissue. Each row represents a significant GO biological process which is colored according to the -log10(p.adjust). |
| Page: 1 2 3 4 5 6 7 8 9 |
| GO ID | Tissue | Disease Stage | Description | Gene Ratio | Bg Ratio | pvalue | p.adjust | Count |
| GO:000648714 | Esophagus | ESCC | protein N-linked glycosylation | 51/8552 | 65/18723 | 6.41e-08 | 1.13e-06 | 51 |
| GO:00091002 | Esophagus | ESCC | glycoprotein metabolic process | 226/8552 | 387/18723 | 2.64e-07 | 3.94e-06 | 226 |
| GO:00181969 | Esophagus | ESCC | peptidyl-asparagine modification | 22/8552 | 24/18723 | 2.82e-06 | 3.21e-05 | 22 |
| GO:00700854 | Esophagus | ESCC | glycosylation | 144/8552 | 240/18723 | 5.12e-06 | 5.38e-05 | 144 |
| GO:00182799 | Esophagus | ESCC | protein N-linked glycosylation via asparagine | 21/8552 | 23/18723 | 5.69e-06 | 5.90e-05 | 21 |
| GO:00064865 | Esophagus | ESCC | protein glycosylation | 135/8552 | 226/18723 | 1.36e-05 | 1.24e-04 | 135 |
| GO:00434135 | Esophagus | ESCC | macromolecule glycosylation | 135/8552 | 226/18723 | 1.36e-05 | 1.24e-04 | 135 |
| GO:00091012 | Esophagus | ESCC | glycoprotein biosynthetic process | 181/8552 | 317/18723 | 2.54e-05 | 2.15e-04 | 181 |
| GO:00182795 | Liver | Cirrhotic | protein N-linked glycosylation via asparagine | 16/4634 | 23/18723 | 7.54e-06 | 1.15e-04 | 16 |
| GO:00181965 | Liver | Cirrhotic | peptidyl-asparagine modification | 16/4634 | 24/18723 | 1.74e-05 | 2.37e-04 | 16 |
| GO:00064873 | Liver | Cirrhotic | protein N-linked glycosylation | 30/4634 | 65/18723 | 1.40e-04 | 1.36e-03 | 30 |
| GO:000648711 | Liver | HCC | protein N-linked glycosylation | 48/7958 | 65/18723 | 2.85e-07 | 5.00e-06 | 48 |
| GO:001819611 | Liver | HCC | peptidyl-asparagine modification | 21/7958 | 24/18723 | 6.62e-06 | 7.97e-05 | 21 |
| GO:001827911 | Liver | HCC | protein N-linked glycosylation via asparagine | 20/7958 | 23/18723 | 1.37e-05 | 1.51e-04 | 20 |
| GO:00064862 | Liver | HCC | protein glycosylation | 122/7958 | 226/18723 | 3.11e-04 | 2.21e-03 | 122 |
| GO:00434132 | Liver | HCC | macromolecule glycosylation | 122/7958 | 226/18723 | 3.11e-04 | 2.21e-03 | 122 |
| GO:00700852 | Liver | HCC | glycosylation | 128/7958 | 240/18723 | 4.35e-04 | 2.92e-03 | 128 |
| GO:0009100 | Liver | HCC | glycoprotein metabolic process | 193/7958 | 387/18723 | 1.89e-03 | 9.62e-03 | 193 |
| GO:00064875 | Oral cavity | OSCC | protein N-linked glycosylation | 44/7305 | 65/18723 | 2.63e-06 | 3.26e-05 | 44 |
| GO:00181968 | Oral cavity | OSCC | peptidyl-asparagine modification | 20/7305 | 24/18723 | 1.10e-05 | 1.14e-04 | 20 |
| Page: 1 2 3 |
| Pathway ID | Tissue | Disease Stage | Description | Gene Ratio | Bg Ratio | pvalue | p.adjust | qvalue | Count |
| hsa04141211 | Esophagus | ESCC | Protein processing in endoplasmic reticulum | 147/4205 | 174/8465 | 3.29e-22 | 1.10e-19 | 5.64e-20 | 147 |
| hsa0051023 | Esophagus | ESCC | N-Glycan biosynthesis | 39/4205 | 53/8465 | 3.26e-04 | 1.15e-03 | 5.89e-04 | 39 |
| hsa005136 | Esophagus | ESCC | Various types of N-glycan biosynthesis | 31/4205 | 42/8465 | 1.23e-03 | 3.78e-03 | 1.93e-03 | 31 |
| hsa04141310 | Esophagus | ESCC | Protein processing in endoplasmic reticulum | 147/4205 | 174/8465 | 3.29e-22 | 1.10e-19 | 5.64e-20 | 147 |
| hsa0051033 | Esophagus | ESCC | N-Glycan biosynthesis | 39/4205 | 53/8465 | 3.26e-04 | 1.15e-03 | 5.89e-04 | 39 |
| hsa0051313 | Esophagus | ESCC | Various types of N-glycan biosynthesis | 31/4205 | 42/8465 | 1.23e-03 | 3.78e-03 | 1.93e-03 | 31 |
| hsa0414114 | Liver | Cirrhotic | Protein processing in endoplasmic reticulum | 114/2530 | 174/8465 | 1.16e-22 | 9.67e-21 | 5.96e-21 | 114 |
| hsa005104 | Liver | Cirrhotic | N-Glycan biosynthesis | 32/2530 | 53/8465 | 3.82e-06 | 4.10e-05 | 2.53e-05 | 32 |
| hsa005134 | Liver | Cirrhotic | Various types of N-glycan biosynthesis | 26/2530 | 42/8465 | 1.65e-05 | 1.41e-04 | 8.69e-05 | 26 |
| hsa0414115 | Liver | Cirrhotic | Protein processing in endoplasmic reticulum | 114/2530 | 174/8465 | 1.16e-22 | 9.67e-21 | 5.96e-21 | 114 |
| hsa0051011 | Liver | Cirrhotic | N-Glycan biosynthesis | 32/2530 | 53/8465 | 3.82e-06 | 4.10e-05 | 2.53e-05 | 32 |
| hsa0051311 | Liver | Cirrhotic | Various types of N-glycan biosynthesis | 26/2530 | 42/8465 | 1.65e-05 | 1.41e-04 | 8.69e-05 | 26 |
| hsa0414122 | Liver | HCC | Protein processing in endoplasmic reticulum | 146/4020 | 174/8465 | 7.34e-24 | 2.46e-21 | 1.37e-21 | 146 |
| hsa0051021 | Liver | HCC | N-Glycan biosynthesis | 40/4020 | 53/8465 | 2.95e-05 | 1.87e-04 | 1.04e-04 | 40 |
| hsa0414132 | Liver | HCC | Protein processing in endoplasmic reticulum | 146/4020 | 174/8465 | 7.34e-24 | 2.46e-21 | 1.37e-21 | 146 |
| hsa0051031 | Liver | HCC | N-Glycan biosynthesis | 40/4020 | 53/8465 | 2.95e-05 | 1.87e-04 | 1.04e-04 | 40 |
| hsa0414130 | Oral cavity | OSCC | Protein processing in endoplasmic reticulum | 143/3704 | 174/8465 | 6.82e-26 | 2.28e-23 | 1.16e-23 | 143 |
| hsa005105 | Oral cavity | OSCC | N-Glycan biosynthesis | 39/3704 | 53/8465 | 9.77e-06 | 4.36e-05 | 2.22e-05 | 39 |
| hsa005135 | Oral cavity | OSCC | Various types of N-glycan biosynthesis | 29/3704 | 42/8465 | 8.03e-04 | 2.32e-03 | 1.18e-03 | 29 |
| hsa04141113 | Oral cavity | OSCC | Protein processing in endoplasmic reticulum | 143/3704 | 174/8465 | 6.82e-26 | 2.28e-23 | 1.16e-23 | 143 |
| Page: 1 2 |
Top |
Cell-cell communication analysis |
| Identification of potential cell-cell interactions between two cell types and their ligand-receptor pairs for different disease states |
| Ligand | Receptor | LRpair | Pathway | Tissue | Disease Stage |
| Page: 1 |
Top |
Single-cell gene regulatory network inference analysis |
| Find out the significant the regulons (TFs) and the target genes of each regulon across cell types for different disease states |
| TF | Cell Type | Tissue | Disease Stage | Target Gene | RSS | Regulon Activity |
| ∗The dot plots of a searched regulon are shown for all cell subpopulations in each disease state of each tissue based on the regulon specific score inferred using pySCENIC and by calculating the average expression. |
| Page: 1 |
Top |
Somatic mutation of malignant transformation related genes |
| Annotation of somatic variants for genes involved in malignant transformation |
| Hugo Symbol | Variant Class | Variant Classification | dbSNP RS | HGVSc | HGVSp | HGVSp Short | SWISSPROT | BIOTYPE | SIFT | PolyPhen | Tumor Sample Barcode | Tissue | Histology | Sex | Age | Stage | Therapy Types | Drugs | Outcome |
| TUSC3 | SNV | Missense_Mutation | c.344C>G | p.Ser115Cys | p.S115C | Q13454 | protein_coding | deleterious(0.01) | probably_damaging(0.998) | TCGA-C8-A12K-01 | Breast | breast invasive carcinoma | Female | >=65 | I/II | Unknown | Unknown | SD | |
| TUSC3 | SNV | Missense_Mutation | novel | c.731N>G | p.Ser244Cys | p.S244C | Q13454 | protein_coding | deleterious(0) | probably_damaging(1) | TCGA-PE-A5DE-01 | Breast | breast invasive carcinoma | Female | <65 | I/II | Chemotherapy | taxotere | CR |
| TUSC3 | insertion | Frame_Shift_Ins | novel | c.910_911insTTCAGTGTTTTTCAAGCTGTGTAGCATGGATCTCTAAAAGTTTAGAG | p.Ser304PhefsTer26 | p.S304Ffs*26 | Q13454 | protein_coding | TCGA-A8-A07J-01 | Breast | breast invasive carcinoma | Female | <65 | I/II | Chemotherapy | 5-fluorouracil | CR | ||
| TUSC3 | SNV | Missense_Mutation | novel | c.614C>T | p.Ala205Val | p.A205V | Q13454 | protein_coding | tolerated(0.72) | benign(0.034) | TCGA-UC-A7PG-06 | Cervix | cervical & endocervical cancer | Female | <65 | III/IV | Chemotherapy | cisplatin | PD |
| TUSC3 | SNV | Missense_Mutation | novel | c.258G>A | p.Met86Ile | p.M86I | Q13454 | protein_coding | tolerated(0.16) | benign(0.019) | TCGA-VS-A954-01 | Cervix | cervical & endocervical cancer | Female | >=65 | III/IV | Chemotherapy | cisplatin | CR |
| TUSC3 | SNV | Missense_Mutation | rs755902777 | c.289N>T | p.Arg97Trp | p.R97W | Q13454 | protein_coding | deleterious(0) | probably_damaging(1) | TCGA-A6-3809-01 | Colorectum | colon adenocarcinoma | Female | >=65 | I/II | Unknown | Unknown | SD |
| TUSC3 | SNV | Missense_Mutation | rs576144260 | c.200N>A | p.Arg67Gln | p.R67Q | Q13454 | protein_coding | deleterious(0.03) | possibly_damaging(0.532) | TCGA-AA-3510-01 | Colorectum | colon adenocarcinoma | Male | >=65 | I/II | Unknown | Unknown | SD |
| TUSC3 | SNV | Missense_Mutation | c.684N>T | p.Lys228Asn | p.K228N | Q13454 | protein_coding | deleterious(0) | possibly_damaging(0.876) | TCGA-AA-3510-01 | Colorectum | colon adenocarcinoma | Male | >=65 | I/II | Unknown | Unknown | SD | |
| TUSC3 | SNV | Missense_Mutation | c.245G>A | p.Arg82Gln | p.R82Q | Q13454 | protein_coding | deleterious(0) | probably_damaging(0.993) | TCGA-AA-A010-01 | Colorectum | colon adenocarcinoma | Female | <65 | I/II | Chemotherapy | folinic | CR | |
| TUSC3 | SNV | Missense_Mutation | c.601A>G | p.Thr201Ala | p.T201A | Q13454 | protein_coding | tolerated(0.33) | benign(0.06) | TCGA-AA-A010-01 | Colorectum | colon adenocarcinoma | Female | <65 | I/II | Chemotherapy | folinic | CR |
| Page: 1 2 3 4 5 6 7 8 |
Top |
Related drugs of malignant transformation related genes |
| Identification of chemicals and drugs interact with genes involved in malignant transfromation |
| (DGIdb 4.0) |
| Entrez ID | Symbol | Category | Interaction Types | Drug Claim Name | Drug Name | PMIDs |
| Page: 1 |

Copyright 2023-Present -The University of Texas Health Science Center at Houston |