
|
|||||
|
 | |
| |
| |
| |
| |
| |
|
Gene: TUSC1 |
Gene summary for TUSC1 |
| Gene information | Species | Human | Gene symbol | TUSC1 | Gene ID | 286319 |
| Gene name | tumor suppressor candidate 1 | |
| Gene Alias | CCDC89B | |
| Cytomap | 9p21.2 | |
| Gene Type | protein-coding | GO ID | NA | UniProtAcc | Q2TAM9 |
Top |
Malignant transformation analysis |
| Identification of the aberrant gene expression in precancerous and cancerous lesions by comparing the gene expression of stem-like cells in diseased tissues with normal stem cells |
| Entrez ID | Symbol | Replicates | Species | Organ | Tissue | Adj P-value | Log2FC | Malignancy |
| 286319 | TUSC1 | P2T-E | Human | Esophagus | ESCC | 1.37e-39 | 5.93e-01 | 0.1177 |
| 286319 | TUSC1 | P4T-E | Human | Esophagus | ESCC | 3.44e-09 | 2.11e-01 | 0.1323 |
| 286319 | TUSC1 | P5T-E | Human | Esophagus | ESCC | 5.66e-10 | 2.68e-01 | 0.1327 |
| 286319 | TUSC1 | P8T-E | Human | Esophagus | ESCC | 1.96e-14 | 1.23e-01 | 0.0889 |
| 286319 | TUSC1 | P10T-E | Human | Esophagus | ESCC | 3.33e-17 | 3.63e-01 | 0.116 |
| 286319 | TUSC1 | P11T-E | Human | Esophagus | ESCC | 4.70e-10 | 4.04e-01 | 0.1426 |
| 286319 | TUSC1 | P12T-E | Human | Esophagus | ESCC | 5.79e-10 | 1.37e-01 | 0.1122 |
| 286319 | TUSC1 | P15T-E | Human | Esophagus | ESCC | 5.73e-05 | 1.50e-01 | 0.1149 |
| 286319 | TUSC1 | P16T-E | Human | Esophagus | ESCC | 4.46e-06 | 6.32e-02 | 0.1153 |
| 286319 | TUSC1 | P20T-E | Human | Esophagus | ESCC | 1.94e-06 | 4.10e-02 | 0.1124 |
| 286319 | TUSC1 | P21T-E | Human | Esophagus | ESCC | 1.72e-13 | 2.11e-01 | 0.1617 |
| 286319 | TUSC1 | P22T-E | Human | Esophagus | ESCC | 2.06e-10 | 1.55e-01 | 0.1236 |
| 286319 | TUSC1 | P23T-E | Human | Esophagus | ESCC | 3.70e-06 | 2.24e-01 | 0.108 |
| 286319 | TUSC1 | P24T-E | Human | Esophagus | ESCC | 7.35e-13 | 1.21e-01 | 0.1287 |
| 286319 | TUSC1 | P26T-E | Human | Esophagus | ESCC | 1.42e-07 | 1.66e-01 | 0.1276 |
| 286319 | TUSC1 | P27T-E | Human | Esophagus | ESCC | 4.68e-09 | 1.13e-01 | 0.1055 |
| 286319 | TUSC1 | P28T-E | Human | Esophagus | ESCC | 8.45e-29 | 5.69e-01 | 0.1149 |
| 286319 | TUSC1 | P30T-E | Human | Esophagus | ESCC | 2.82e-05 | 1.43e-01 | 0.137 |
| 286319 | TUSC1 | P32T-E | Human | Esophagus | ESCC | 8.27e-15 | 3.28e-01 | 0.1666 |
| 286319 | TUSC1 | P36T-E | Human | Esophagus | ESCC | 1.43e-07 | 1.60e-01 | 0.1187 |
| Page: 1 2 3 4 |
| Tissue | Expression Dynamics | Abbreviation |
| Esophagus |  | ESCC: Esophageal squamous cell carcinoma |
| HGIN: High-grade intraepithelial neoplasias | ||
| LGIN: Low-grade intraepithelial neoplasias | ||
| Oral Cavity | 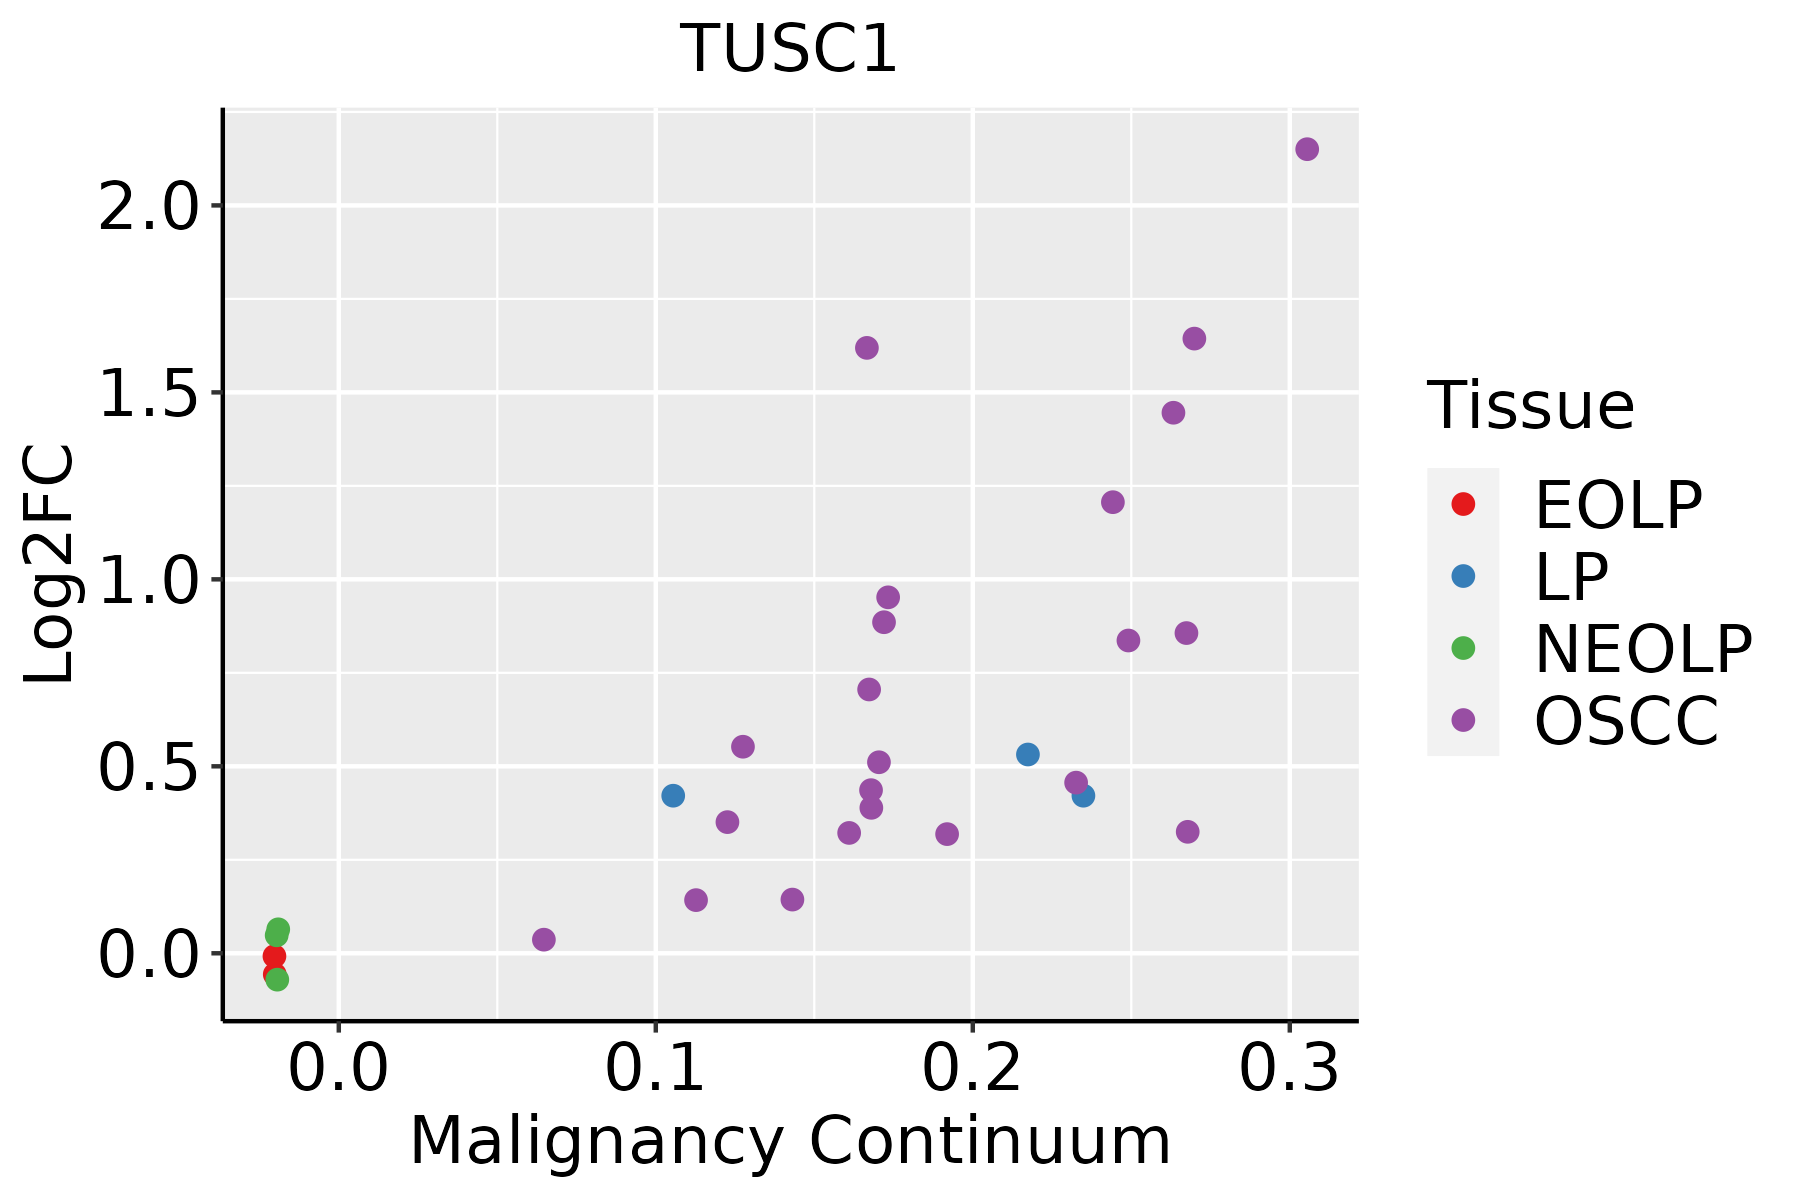 | EOLP: Erosive Oral lichen planus |
| LP: leukoplakia | ||
| NEOLP: Non-erosive oral lichen planus | ||
| OSCC: Oral squamous cell carcinoma | ||
| Prostate |  | BPH: Benign Prostatic Hyperplasia |
| Skin | 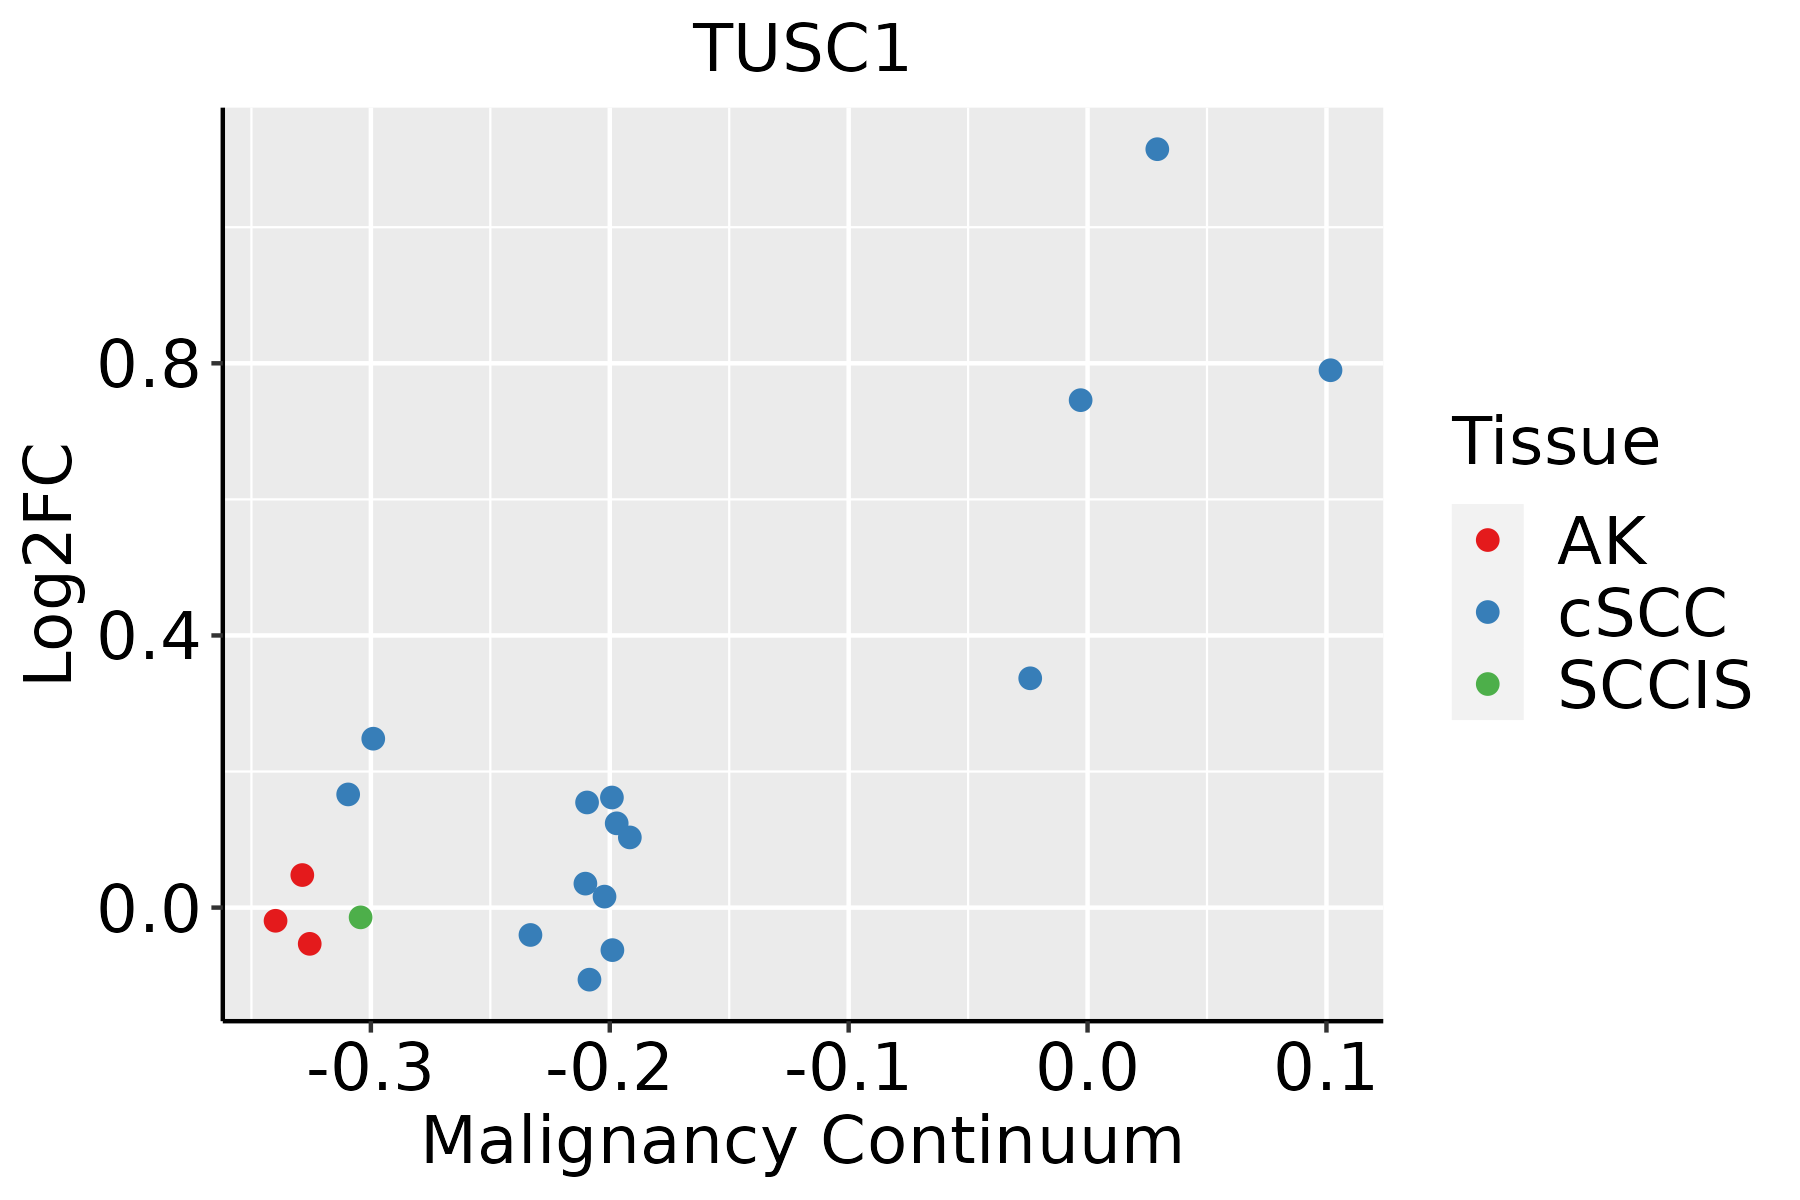 | AK: Actinic keratosis |
| cSCC: Cutaneous squamous cell carcinoma | ||
| SCCIS:squamous cell carcinoma in situ |
| ∗log2FC in expression of this searched gene in stem-like cells from each diseased tissue sample relative to stem-like cells in normal samples in each tissue plotted against the malignancy continuum. Samples are colored based on if they are from different disease stage. |
Top |
Malignant transformation related pathway analysis |
| Find out the enriched GO biological processes and KEGG pathways involved in transition from healthy to precancer to cancer |
| Tissue | Disease Stage | Enriched GO biological Processes |
| Colorectum | AD |  |
| Colorectum | SER |  |
| Colorectum | MSS |  |
| Colorectum | MSI-H |  |
| Colorectum | FAP |  |
| ∗Top 15 enriched GO BP terms are showed in the bar plot of each disease state in each tissue. Each row represents a significant GO biological process which is colored according to the -log10(p.adjust). |
| Page: 1 2 3 4 5 6 7 8 9 |
| GO ID | Tissue | Disease Stage | Description | Gene Ratio | Bg Ratio | pvalue | p.adjust | Count |
| Page: 1 |
| Pathway ID | Tissue | Disease Stage | Description | Gene Ratio | Bg Ratio | pvalue | p.adjust | qvalue | Count |
| Page: 1 |
Top |
Cell-cell communication analysis |
| Identification of potential cell-cell interactions between two cell types and their ligand-receptor pairs for different disease states |
| Ligand | Receptor | LRpair | Pathway | Tissue | Disease Stage |
| Page: 1 |
Top |
Single-cell gene regulatory network inference analysis |
| Find out the significant the regulons (TFs) and the target genes of each regulon across cell types for different disease states |
| TF | Cell Type | Tissue | Disease Stage | Target Gene | RSS | Regulon Activity |
| ∗The dot plots of a searched regulon are shown for all cell subpopulations in each disease state of each tissue based on the regulon specific score inferred using pySCENIC and by calculating the average expression. |
| Page: 1 |
Top |
Somatic mutation of malignant transformation related genes |
| Annotation of somatic variants for genes involved in malignant transformation |
| Hugo Symbol | Variant Class | Variant Classification | dbSNP RS | HGVSc | HGVSp | HGVSp Short | SWISSPROT | BIOTYPE | SIFT | PolyPhen | Tumor Sample Barcode | Tissue | Histology | Sex | Age | Stage | Therapy Types | Drugs | Outcome |
| TUSC1 | SNV | Missense_Mutation | c.484G>C | p.Glu162Gln | p.E162Q | Q2TAM9 | protein_coding | tolerated(0.18) | possibly_damaging(0.696) | TCGA-EK-A2RB-01 | Cervix | cervical & endocervical cancer | Female | <65 | I/II | Unknown | Unknown | SD | |
| TUSC1 | SNV | Missense_Mutation | c.532G>C | p.Glu178Gln | p.E178Q | Q2TAM9 | protein_coding | deleterious_low_confidence(0) | possibly_damaging(0.667) | TCGA-JW-A5VL-01 | Cervix | cervical & endocervical cancer | Female | <65 | I/II | Unknown | Unknown | SD | |
| TUSC1 | SNV | Missense_Mutation | c.605N>T | p.Ser202Phe | p.S202F | Q2TAM9 | protein_coding | deleterious_low_confidence(0.01) | benign(0.158) | TCGA-AZ-6599-01 | Colorectum | colon adenocarcinoma | Male | >=65 | I/II | Unknown | Unknown | SD | |
| TUSC1 | SNV | Missense_Mutation | c.289C>T | p.Arg97Trp | p.R97W | Q2TAM9 | protein_coding | deleterious(0) | benign(0.427) | TCGA-NH-A5IV-01 | Colorectum | colon adenocarcinoma | Female | >=65 | I/II | Unknown | Unknown | SD | |
| TUSC1 | SNV | Missense_Mutation | c.392N>A | p.Arg131Gln | p.R131Q | Q2TAM9 | protein_coding | tolerated(0.56) | benign(0.029) | TCGA-DD-A113-01 | Liver | liver hepatocellular carcinoma | Female | <65 | I/II | Unknown | Unknown | PD |
| Page: 1 |
Top |
Related drugs of malignant transformation related genes |
| Identification of chemicals and drugs interact with genes involved in malignant transfromation |
| (DGIdb 4.0) |
| Entrez ID | Symbol | Category | Interaction Types | Drug Claim Name | Drug Name | PMIDs |
| Page: 1 |

Copyright 2023-Present -The University of Texas Health Science Center at Houston |