
|
|||||
|
 | |
| |
| |
| |
| |
| |
|
Gene: TULP4 |
Gene summary for TULP4 |
| Gene information | Species | Human | Gene symbol | TULP4 | Gene ID | 56995 |
| Gene name | TUB like protein 4 | |
| Gene Alias | TUSP | |
| Cytomap | 6q25.3 | |
| Gene Type | protein-coding | GO ID | GO:0006464 | UniProtAcc | Q9NRJ4 |
Top |
Malignant transformation analysis |
| Identification of the aberrant gene expression in precancerous and cancerous lesions by comparing the gene expression of stem-like cells in diseased tissues with normal stem cells |
| Entrez ID | Symbol | Replicates | Species | Organ | Tissue | Adj P-value | Log2FC | Malignancy |
| 56995 | TULP4 | HTA11_3410_2000001011 | Human | Colorectum | AD | 5.37e-25 | -7.41e-01 | 0.0155 |
| 56995 | TULP4 | HTA11_2487_2000001011 | Human | Colorectum | SER | 8.35e-07 | -5.67e-01 | -0.1808 |
| 56995 | TULP4 | HTA11_2951_2000001011 | Human | Colorectum | AD | 3.89e-04 | -8.00e-01 | 0.0216 |
| 56995 | TULP4 | HTA11_78_2000001011 | Human | Colorectum | AD | 3.31e-08 | -5.84e-01 | -0.1088 |
| 56995 | TULP4 | HTA11_2112_2000001011 | Human | Colorectum | SER | 2.16e-03 | -7.45e-01 | -0.2196 |
| 56995 | TULP4 | HTA11_3361_2000001011 | Human | Colorectum | AD | 1.75e-08 | -6.92e-01 | -0.1207 |
| 56995 | TULP4 | HTA11_83_2000001011 | Human | Colorectum | SER | 5.72e-04 | -5.20e-01 | -0.1526 |
| 56995 | TULP4 | HTA11_696_2000001011 | Human | Colorectum | AD | 2.96e-25 | -6.20e-01 | -0.1464 |
| 56995 | TULP4 | HTA11_866_2000001011 | Human | Colorectum | AD | 5.29e-21 | -5.21e-01 | -0.1001 |
| 56995 | TULP4 | HTA11_1391_2000001011 | Human | Colorectum | AD | 1.43e-06 | -4.55e-01 | -0.059 |
| 56995 | TULP4 | HTA11_5212_2000001011 | Human | Colorectum | AD | 2.32e-02 | -6.69e-01 | -0.2061 |
| 56995 | TULP4 | HTA11_5216_2000001011 | Human | Colorectum | SER | 4.73e-03 | -7.16e-01 | -0.1462 |
| 56995 | TULP4 | HTA11_546_2000001011 | Human | Colorectum | AD | 1.44e-06 | -6.23e-01 | -0.0842 |
| 56995 | TULP4 | HTA11_9341_2000001011 | Human | Colorectum | SER | 4.58e-03 | -7.58e-01 | -0.00410000000000005 |
| 56995 | TULP4 | HTA11_7862_2000001011 | Human | Colorectum | AD | 3.43e-03 | -4.81e-01 | -0.0179 |
| 56995 | TULP4 | HTA11_866_3004761011 | Human | Colorectum | AD | 2.07e-17 | -7.43e-01 | 0.096 |
| 56995 | TULP4 | HTA11_8622_2000001021 | Human | Colorectum | SER | 1.36e-07 | -7.25e-01 | 0.0528 |
| 56995 | TULP4 | HTA11_10711_2000001011 | Human | Colorectum | AD | 2.75e-10 | -6.97e-01 | 0.0338 |
| 56995 | TULP4 | HTA11_7696_3000711011 | Human | Colorectum | AD | 1.12e-29 | -6.65e-01 | 0.0674 |
| 56995 | TULP4 | HTA11_6818_2000001011 | Human | Colorectum | AD | 7.51e-05 | -6.42e-01 | 0.0112 |
| Page: 1 2 3 4 5 6 7 8 9 |
| Tissue | Expression Dynamics | Abbreviation |
| Colorectum (GSE201348) |  | FAP: Familial adenomatous polyposis |
| CRC: Colorectal cancer | ||
| Colorectum (HTA11) |  | AD: Adenomas |
| SER: Sessile serrated lesions | ||
| MSI-H: Microsatellite-high colorectal cancer | ||
| MSS: Microsatellite stable colorectal cancer | ||
| Endometrium | 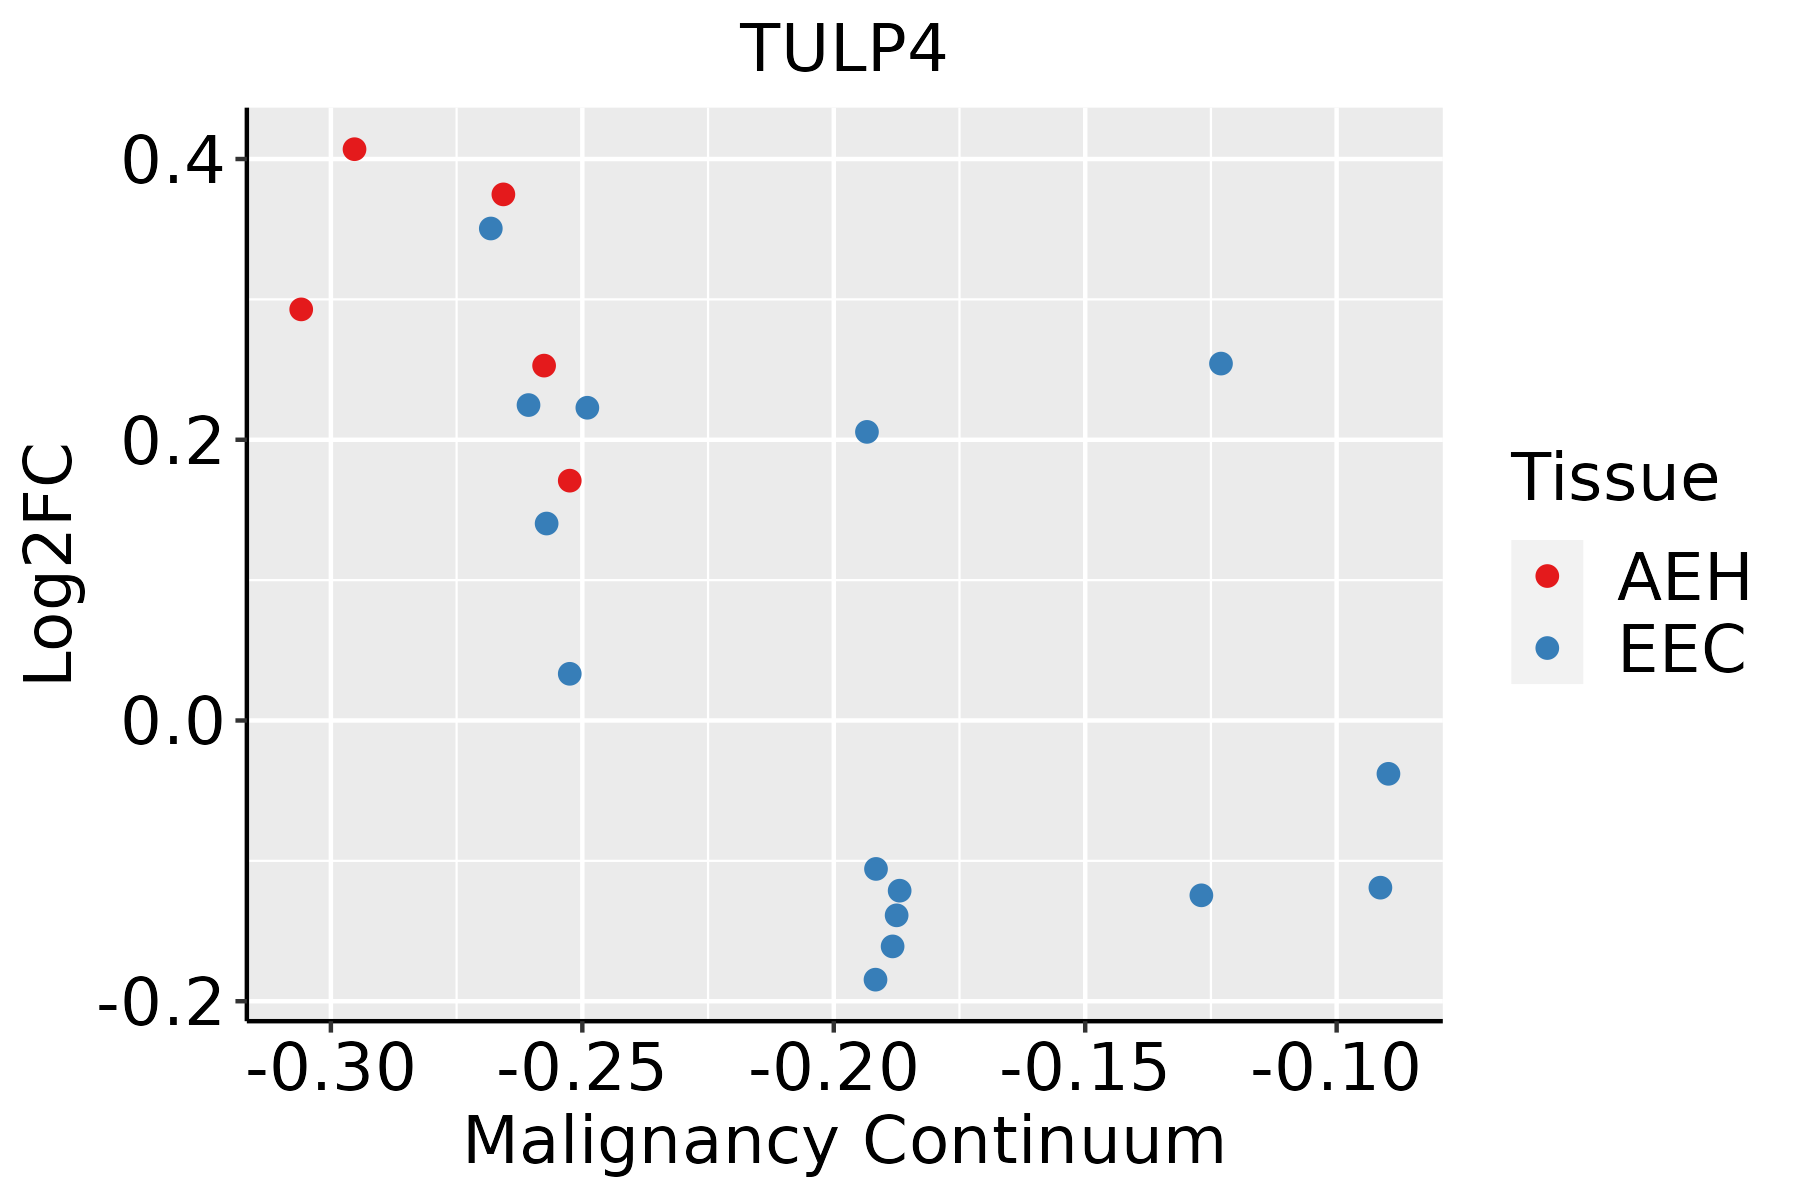 | AEH: Atypical endometrial hyperplasia |
| EEC: Endometrioid Cancer | ||
| Esophagus | 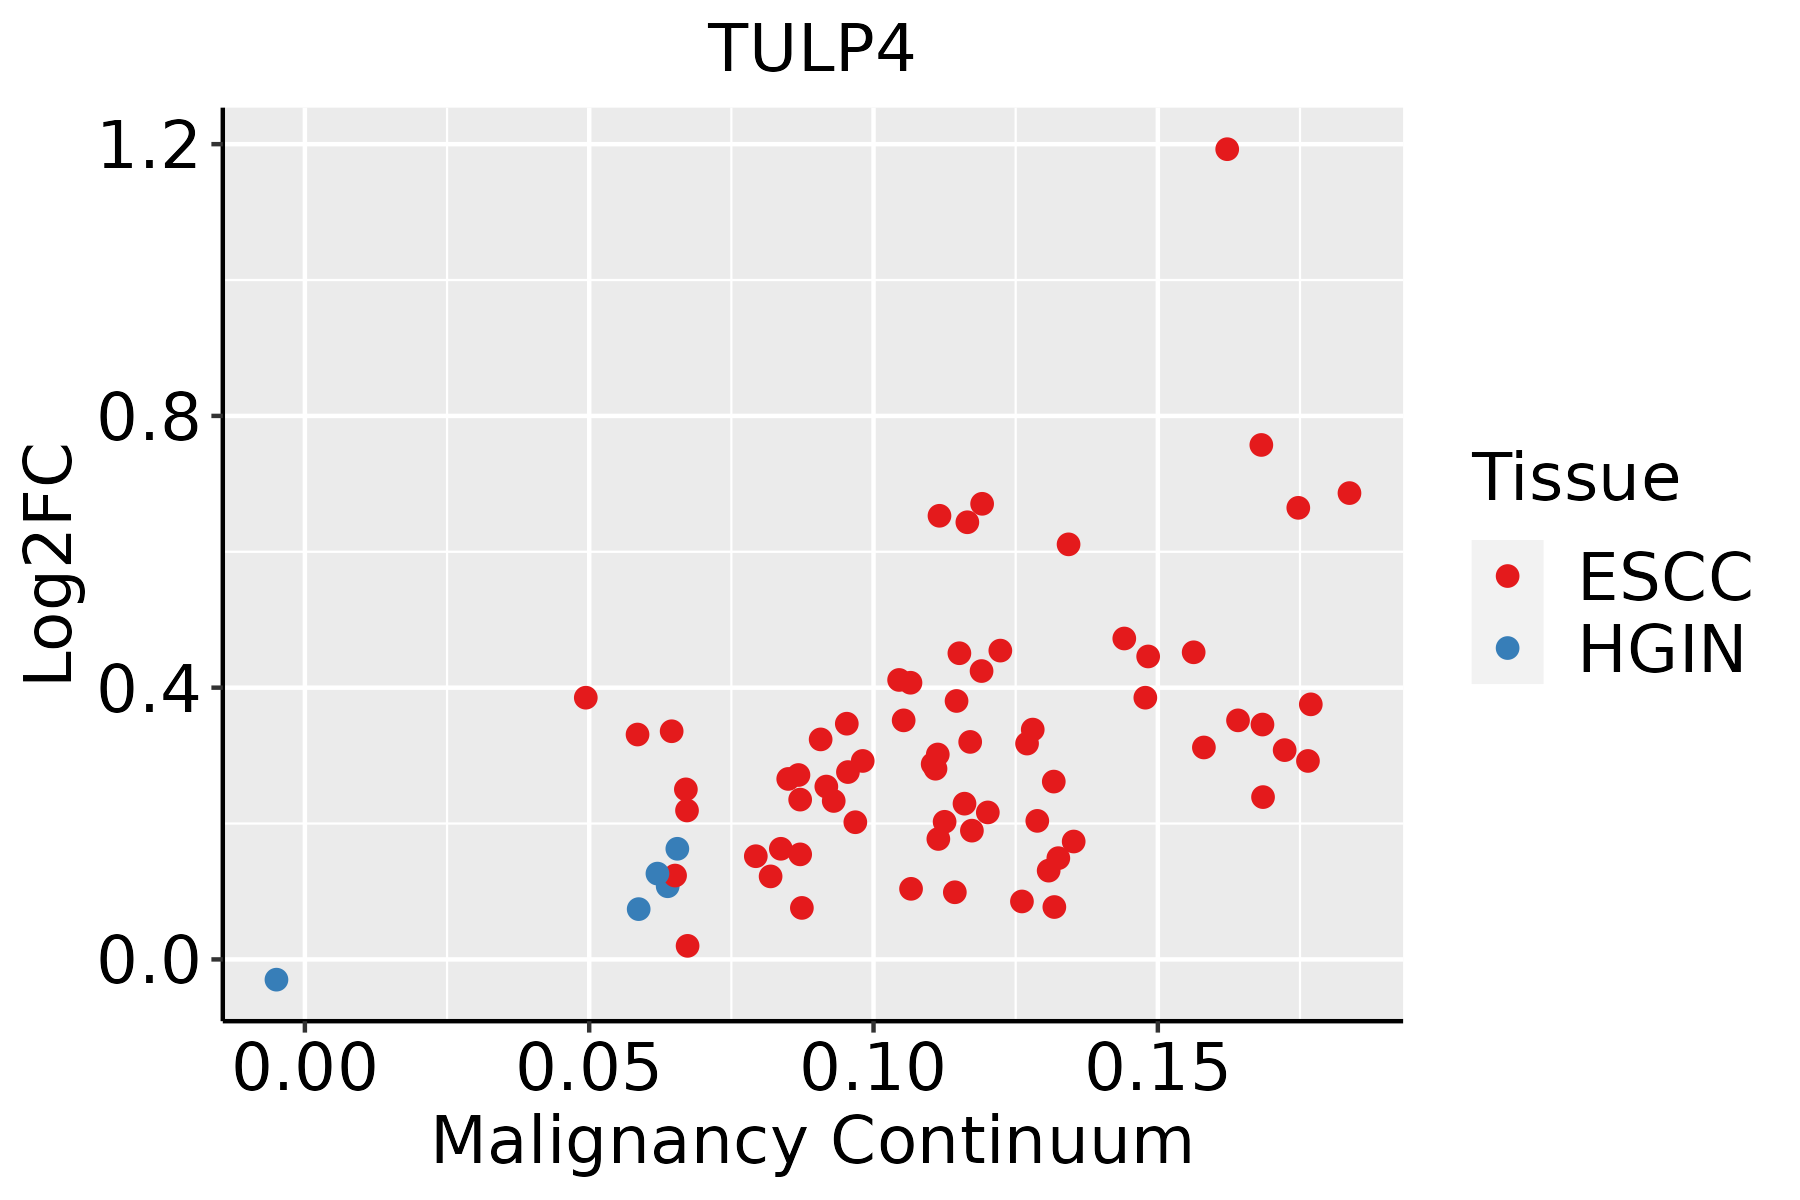 | ESCC: Esophageal squamous cell carcinoma |
| HGIN: High-grade intraepithelial neoplasias | ||
| LGIN: Low-grade intraepithelial neoplasias | ||
| Liver | 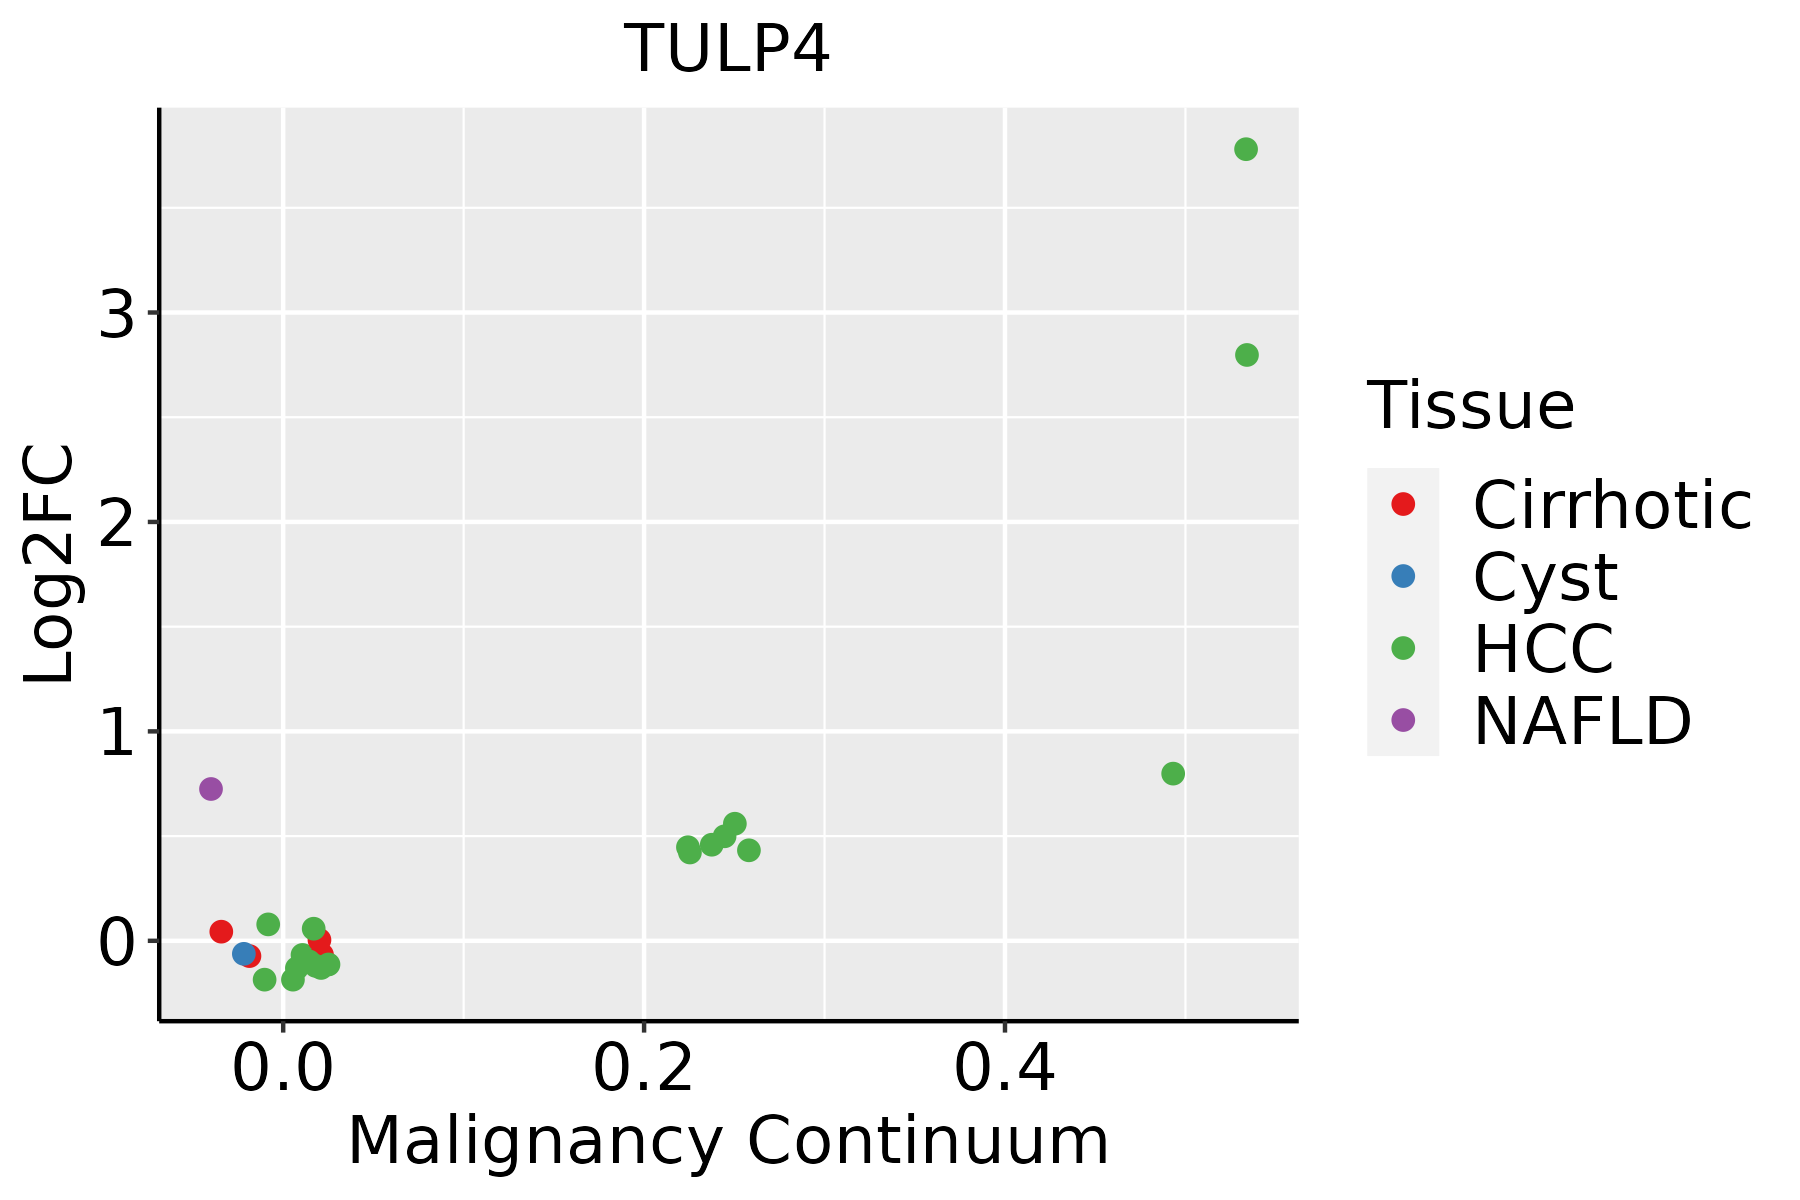 | HCC: Hepatocellular carcinoma |
| NAFLD: Non-alcoholic fatty liver disease | ||
| Oral Cavity | 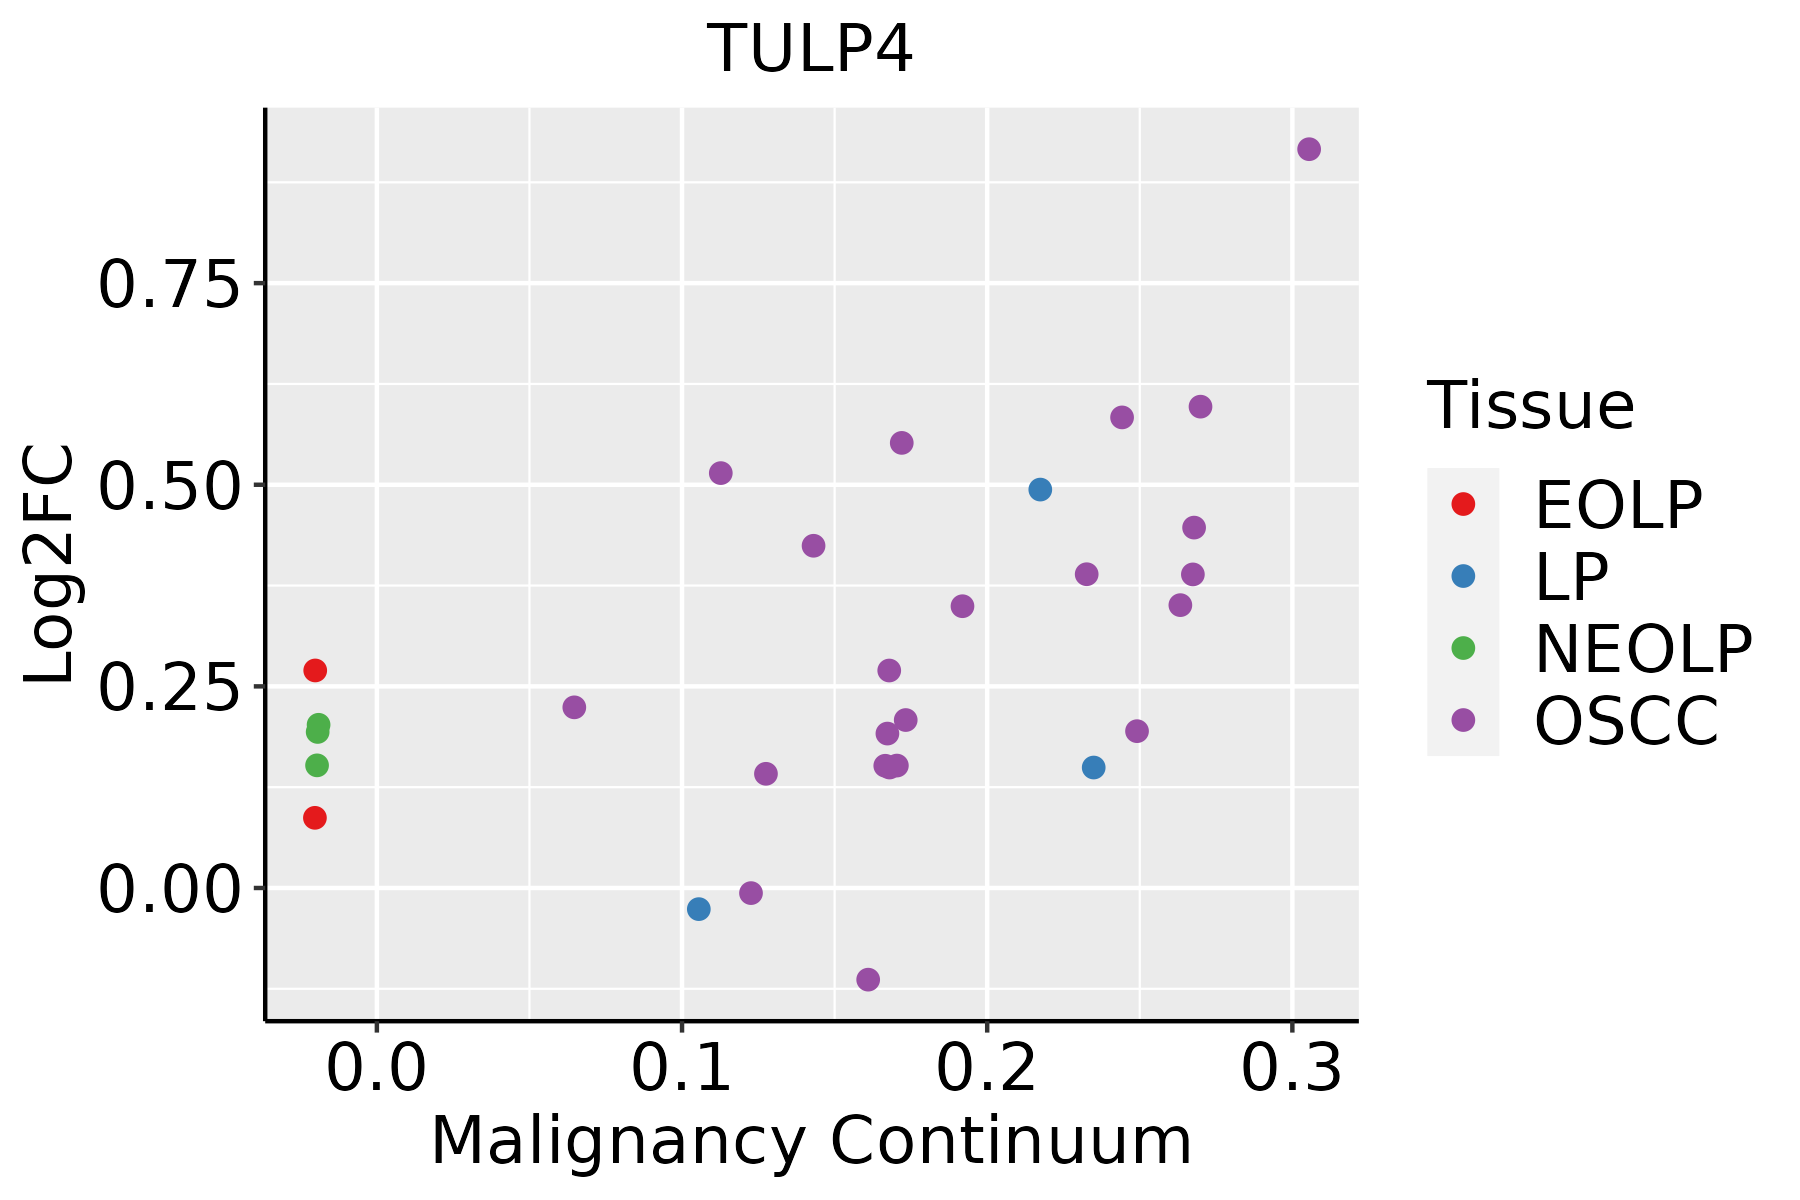 | EOLP: Erosive Oral lichen planus |
| LP: leukoplakia | ||
| NEOLP: Non-erosive oral lichen planus | ||
| OSCC: Oral squamous cell carcinoma | ||
| Thyroid | 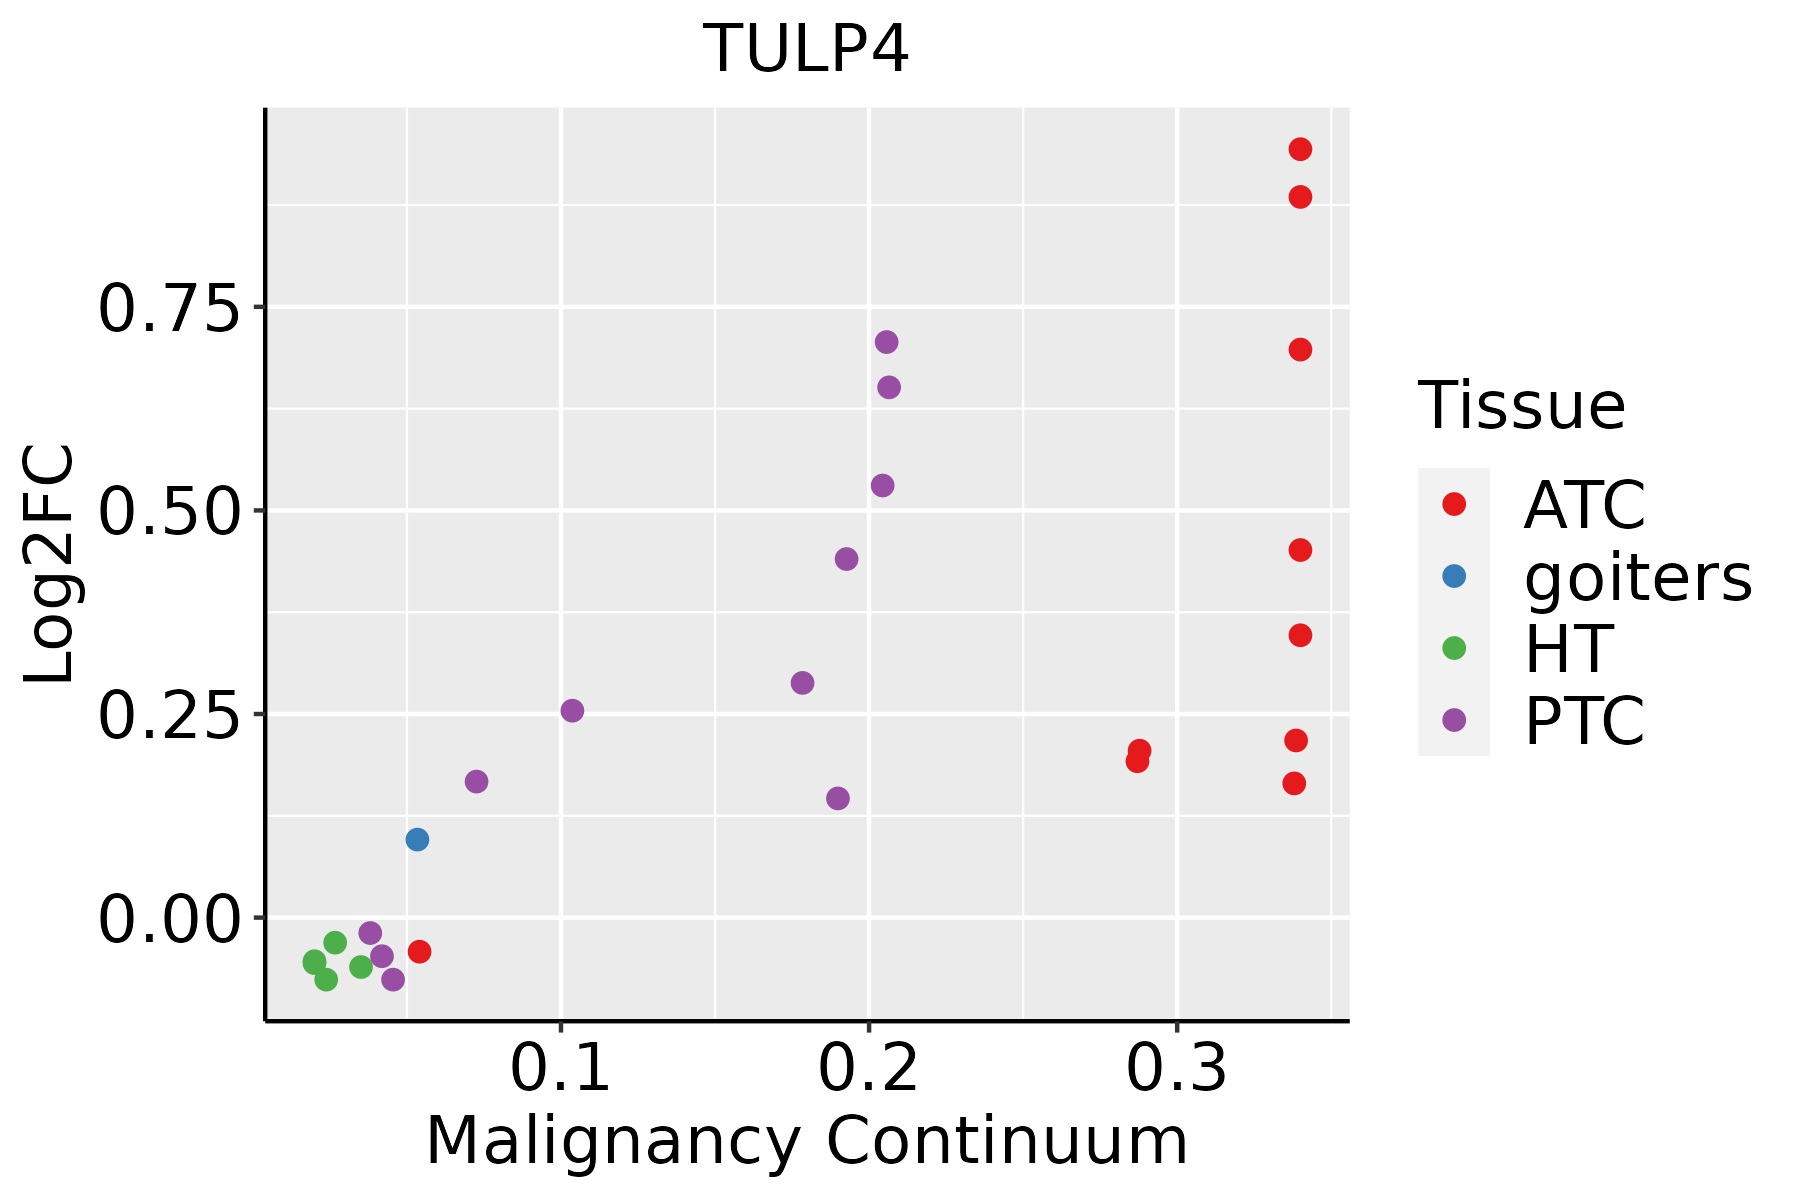 | ATC: Anaplastic thyroid cancer |
| HT: Hashimoto's thyroiditis | ||
| PTC: Papillary thyroid cancer |
| ∗log2FC in expression of this searched gene in stem-like cells from each diseased tissue sample relative to stem-like cells in normal samples in each tissue plotted against the malignancy continuum. Samples are colored based on if they are from different disease stage. |
Top |
Malignant transformation related pathway analysis |
| Find out the enriched GO biological processes and KEGG pathways involved in transition from healthy to precancer to cancer |
| Tissue | Disease Stage | Enriched GO biological Processes |
| Colorectum | AD |  |
| Colorectum | SER |  |
| Colorectum | MSS |  |
| Colorectum | MSI-H |  |
| Colorectum | FAP |  |
| ∗Top 15 enriched GO BP terms are showed in the bar plot of each disease state in each tissue. Each row represents a significant GO biological process which is colored according to the -log10(p.adjust). |
| Page: 1 2 3 4 5 6 7 8 9 |
| GO ID | Tissue | Disease Stage | Description | Gene Ratio | Bg Ratio | pvalue | p.adjust | Count |
| Page: 1 |
| Pathway ID | Tissue | Disease Stage | Description | Gene Ratio | Bg Ratio | pvalue | p.adjust | qvalue | Count |
| Page: 1 |
Top |
Cell-cell communication analysis |
| Identification of potential cell-cell interactions between two cell types and their ligand-receptor pairs for different disease states |
| Ligand | Receptor | LRpair | Pathway | Tissue | Disease Stage |
| Page: 1 |
Top |
Single-cell gene regulatory network inference analysis |
| Find out the significant the regulons (TFs) and the target genes of each regulon across cell types for different disease states |
| TF | Cell Type | Tissue | Disease Stage | Target Gene | RSS | Regulon Activity |
| ∗The dot plots of a searched regulon are shown for all cell subpopulations in each disease state of each tissue based on the regulon specific score inferred using pySCENIC and by calculating the average expression. |
| Page: 1 |
Top |
Somatic mutation of malignant transformation related genes |
| Annotation of somatic variants for genes involved in malignant transformation |
| Hugo Symbol | Variant Class | Variant Classification | dbSNP RS | HGVSc | HGVSp | HGVSp Short | SWISSPROT | BIOTYPE | SIFT | PolyPhen | Tumor Sample Barcode | Tissue | Histology | Sex | Age | Stage | Therapy Types | Drugs | Outcome |
| TULP4 | SNV | Missense_Mutation | novel | c.4211A>G | p.Asp1404Gly | p.D1404G | Q9NRJ4 | protein_coding | deleterious_low_confidence(0) | probably_damaging(0.999) | TCGA-AN-A046-01 | Breast | breast invasive carcinoma | Female | >=65 | I/II | Unknown | Unknown | SD |
| TULP4 | SNV | Missense_Mutation | c.4269C>A | p.Ser1423Arg | p.S1423R | Q9NRJ4 | protein_coding | deleterious_low_confidence(0) | benign(0.238) | TCGA-AO-A0J6-01 | Breast | breast invasive carcinoma | Female | <65 | I/II | Chemotherapy | doxorubicin | SD | |
| TULP4 | SNV | Missense_Mutation | c.2072N>C | p.Ile691Thr | p.I691T | Q9NRJ4 | protein_coding | deleterious_low_confidence(0) | probably_damaging(0.994) | TCGA-BH-A18N-01 | Breast | breast invasive carcinoma | Female | >=65 | I/II | Unknown | Unknown | SD | |
| TULP4 | SNV | Missense_Mutation | c.1793N>G | p.Gln598Arg | p.Q598R | Q9NRJ4 | protein_coding | deleterious(0) | probably_damaging(0.979) | TCGA-D8-A1XK-01 | Breast | breast invasive carcinoma | Female | <65 | I/II | Chemotherapy | doxorubicine+cyclophosphamide | SD | |
| TULP4 | deletion | Frame_Shift_Del | c.1376delN | p.Thr459SerfsTer45 | p.T459Sfs*45 | Q9NRJ4 | protein_coding | TCGA-AN-A0AK-01 | Breast | breast invasive carcinoma | Female | >=65 | I/II | Unknown | Unknown | SD | |||
| TULP4 | insertion | Frame_Shift_Ins | novel | c.677_678insTTCTAAAATAACTGAATTCTGTGAACTTT | p.Ser228LysfsTer52 | p.S228Kfs*52 | Q9NRJ4 | protein_coding | TCGA-AO-A0JD-01 | Breast | breast invasive carcinoma | Female | <65 | III/IV | Chemotherapy | cyclophosphamide | SD | ||
| TULP4 | insertion | Frame_Shift_Ins | novel | c.232_233insAA | p.Leu78GlnfsTer12 | p.L78Qfs*12 | Q9NRJ4 | protein_coding | TCGA-AR-A0U2-01 | Breast | breast invasive carcinoma | Female | <65 | III/IV | Hormone Therapy | tamoxiphen | PD | ||
| TULP4 | insertion | Nonsense_Mutation | novel | c.2397_2398insGCTGCAGTTGTCGTTATTGTCTGTGGTTCTCAATGAGAGGAGGGAAC | p.Lys800AlafsTer12 | p.K800Afs*12 | Q9NRJ4 | protein_coding | TCGA-BH-A0HF-01 | Breast | breast invasive carcinoma | Female | >=65 | I/II | Hormone Therapy | arimidex | SD | ||
| TULP4 | deletion | Frame_Shift_Del | novel | c.2884delN | p.Pro962LeufsTer62 | p.P962Lfs*62 | Q9NRJ4 | protein_coding | TCGA-EW-A2FV-01 | Breast | breast invasive carcinoma | Female | <65 | III/IV | Chemotherapy | docetaxel | SD | ||
| TULP4 | SNV | Missense_Mutation | c.3952G>A | p.Val1318Ile | p.V1318I | Q9NRJ4 | protein_coding | deleterious_low_confidence(0.02) | benign(0.272) | TCGA-2W-A8YY-01 | Cervix | cervical & endocervical cancer | Female | <65 | I/II | Chemotherapy | cisplatin | CR |
| Page: 1 2 3 4 5 6 7 8 9 10 11 12 13 14 15 16 17 |
Top |
Related drugs of malignant transformation related genes |
| Identification of chemicals and drugs interact with genes involved in malignant transfromation |
| (DGIdb 4.0) |
| Entrez ID | Symbol | Category | Interaction Types | Drug Claim Name | Drug Name | PMIDs |
| Page: 1 |

Copyright 2023-Present -The University of Texas Health Science Center at Houston |