
|
|||||
|
 | |
| |
| |
| |
| |
| |
|
Gene: TULP3 |
Gene summary for TULP3 |
| Gene information | Species | Human | Gene symbol | TULP3 | Gene ID | 7289 |
| Gene name | TUB like protein 3 | |
| Gene Alias | TUBL3 | |
| Cytomap | 12p13.33 | |
| Gene Type | protein-coding | GO ID | GO:0001501 | UniProtAcc | O75386 |
Top |
Malignant transformation analysis |
| Identification of the aberrant gene expression in precancerous and cancerous lesions by comparing the gene expression of stem-like cells in diseased tissues with normal stem cells |
| Entrez ID | Symbol | Replicates | Species | Organ | Tissue | Adj P-value | Log2FC | Malignancy |
| 7289 | TULP3 | LZE4T | Human | Esophagus | ESCC | 2.81e-02 | 1.41e-01 | 0.0811 |
| 7289 | TULP3 | LZE7T | Human | Esophagus | ESCC | 5.11e-08 | 3.42e-01 | 0.0667 |
| 7289 | TULP3 | LZE8T | Human | Esophagus | ESCC | 1.75e-04 | 2.34e-01 | 0.067 |
| 7289 | TULP3 | LZE24T | Human | Esophagus | ESCC | 9.27e-13 | 2.82e-01 | 0.0596 |
| 7289 | TULP3 | LZE21T | Human | Esophagus | ESCC | 5.27e-05 | 2.80e-01 | 0.0655 |
| 7289 | TULP3 | P1T-E | Human | Esophagus | ESCC | 1.82e-05 | 2.18e-01 | 0.0875 |
| 7289 | TULP3 | P2T-E | Human | Esophagus | ESCC | 1.50e-34 | 6.80e-01 | 0.1177 |
| 7289 | TULP3 | P4T-E | Human | Esophagus | ESCC | 1.81e-27 | 5.88e-01 | 0.1323 |
| 7289 | TULP3 | P5T-E | Human | Esophagus | ESCC | 1.42e-09 | 1.30e-01 | 0.1327 |
| 7289 | TULP3 | P8T-E | Human | Esophagus | ESCC | 1.85e-20 | 3.08e-01 | 0.0889 |
| 7289 | TULP3 | P9T-E | Human | Esophagus | ESCC | 2.04e-16 | 3.20e-01 | 0.1131 |
| 7289 | TULP3 | P10T-E | Human | Esophagus | ESCC | 2.60e-17 | 2.81e-01 | 0.116 |
| 7289 | TULP3 | P11T-E | Human | Esophagus | ESCC | 6.52e-13 | 6.85e-01 | 0.1426 |
| 7289 | TULP3 | P12T-E | Human | Esophagus | ESCC | 2.20e-35 | 6.39e-01 | 0.1122 |
| 7289 | TULP3 | P15T-E | Human | Esophagus | ESCC | 4.84e-15 | 3.54e-01 | 0.1149 |
| 7289 | TULP3 | P16T-E | Human | Esophagus | ESCC | 5.67e-17 | 3.23e-01 | 0.1153 |
| 7289 | TULP3 | P17T-E | Human | Esophagus | ESCC | 3.33e-06 | 4.14e-01 | 0.1278 |
| 7289 | TULP3 | P19T-E | Human | Esophagus | ESCC | 1.81e-08 | 7.49e-01 | 0.1662 |
| 7289 | TULP3 | P20T-E | Human | Esophagus | ESCC | 3.21e-24 | 4.57e-01 | 0.1124 |
| 7289 | TULP3 | P21T-E | Human | Esophagus | ESCC | 1.13e-19 | 3.48e-01 | 0.1617 |
| Page: 1 2 3 4 5 |
| Tissue | Expression Dynamics | Abbreviation |
| Esophagus |  | ESCC: Esophageal squamous cell carcinoma |
| HGIN: High-grade intraepithelial neoplasias | ||
| LGIN: Low-grade intraepithelial neoplasias | ||
| Liver | 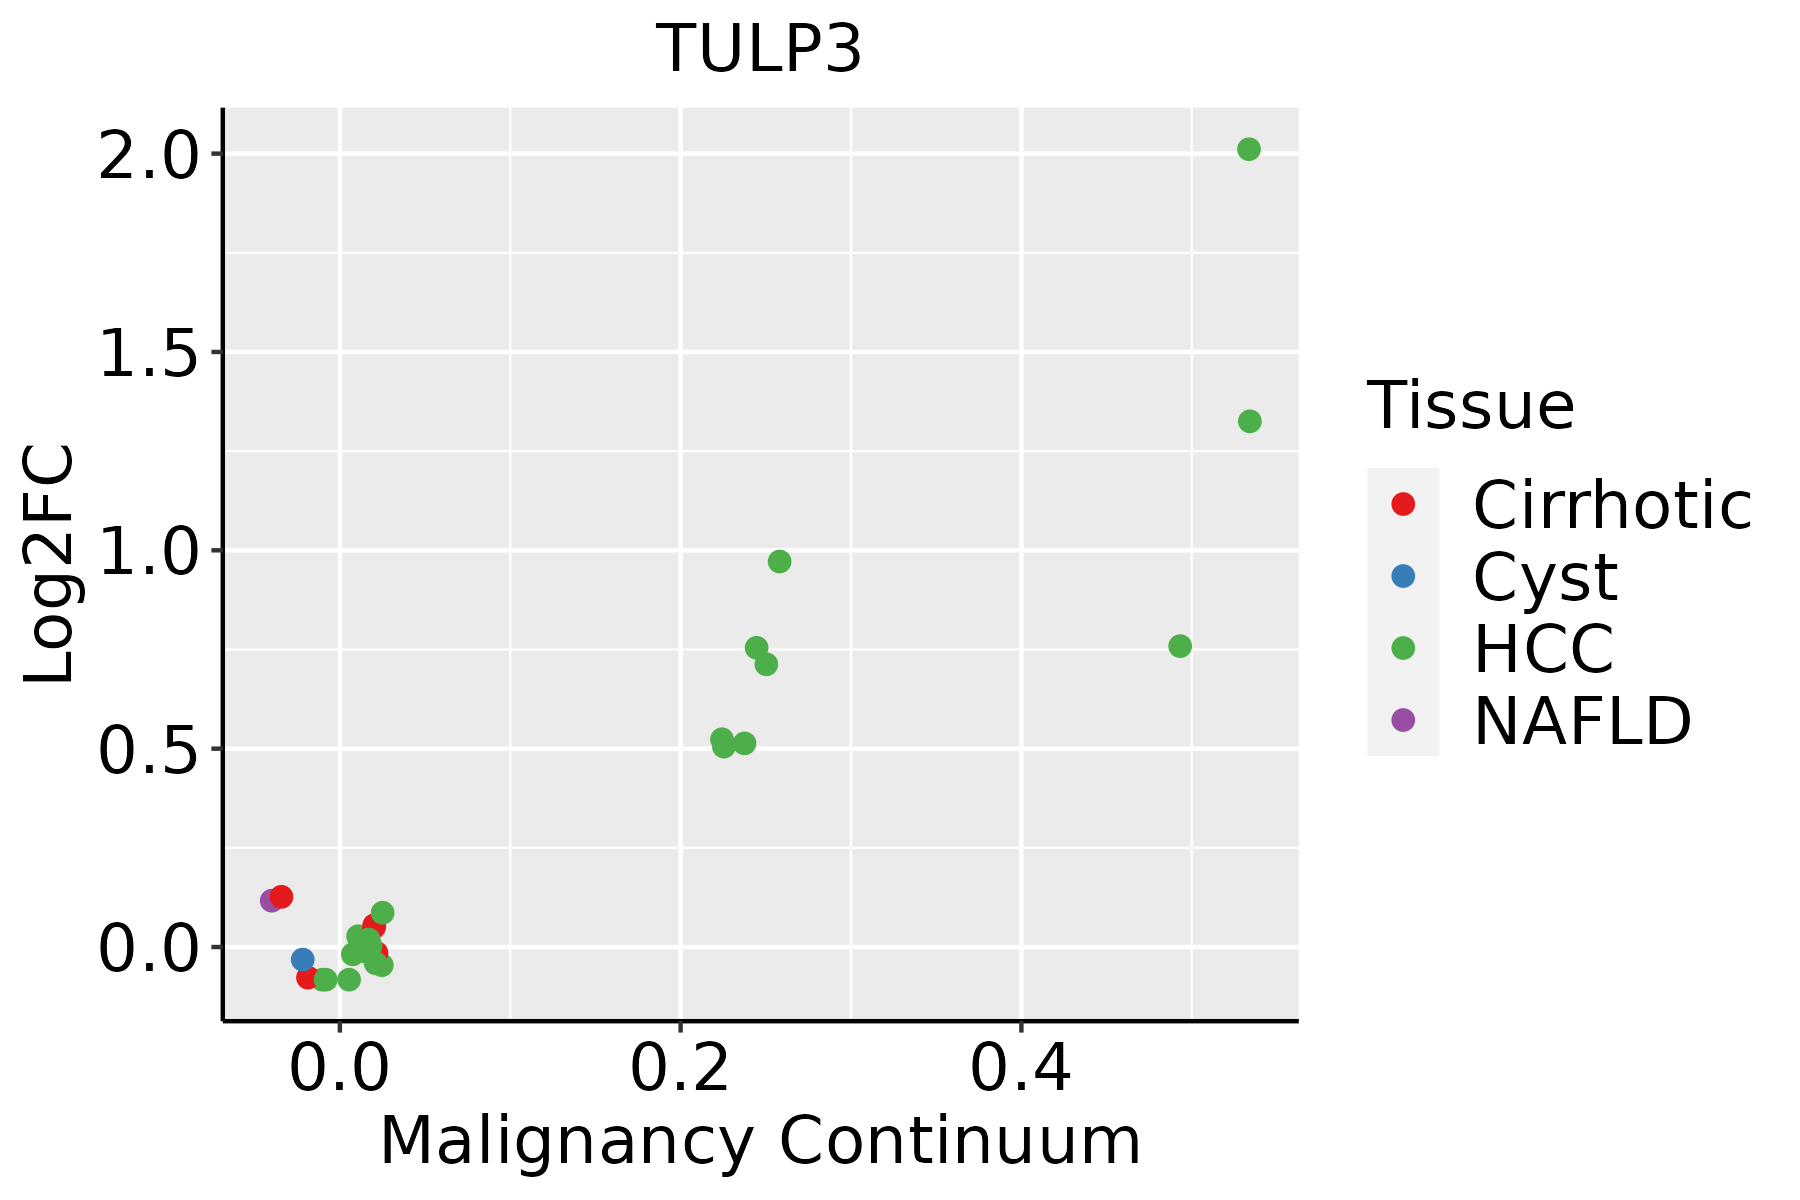 | HCC: Hepatocellular carcinoma |
| NAFLD: Non-alcoholic fatty liver disease | ||
| Oral Cavity |  | EOLP: Erosive Oral lichen planus |
| LP: leukoplakia | ||
| NEOLP: Non-erosive oral lichen planus | ||
| OSCC: Oral squamous cell carcinoma | ||
| Thyroid | 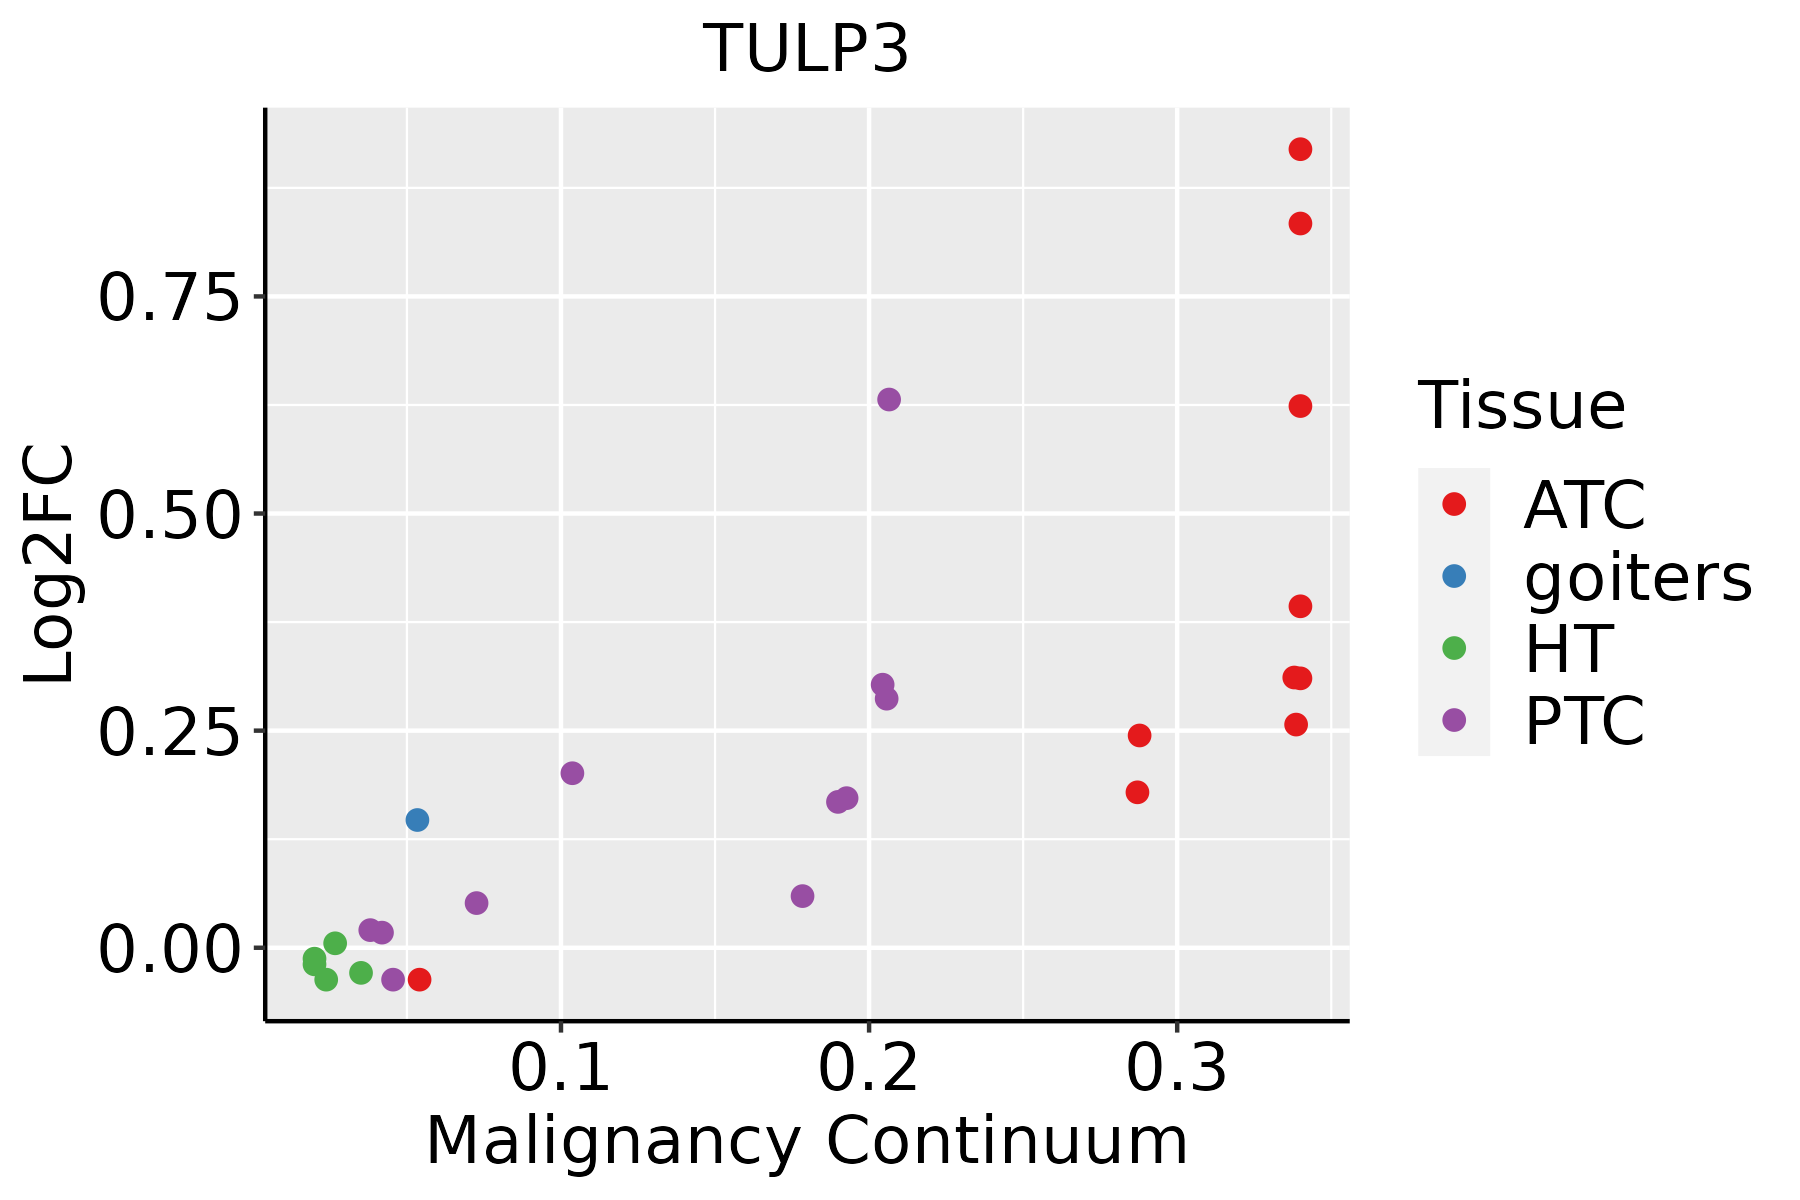 | ATC: Anaplastic thyroid cancer |
| HT: Hashimoto's thyroiditis | ||
| PTC: Papillary thyroid cancer |
| ∗log2FC in expression of this searched gene in stem-like cells from each diseased tissue sample relative to stem-like cells in normal samples in each tissue plotted against the malignancy continuum. Samples are colored based on if they are from different disease stage. |
Top |
Malignant transformation related pathway analysis |
| Find out the enriched GO biological processes and KEGG pathways involved in transition from healthy to precancer to cancer |
| Tissue | Disease Stage | Enriched GO biological Processes |
| Colorectum | AD |  |
| Colorectum | SER |  |
| Colorectum | MSS |  |
| Colorectum | MSI-H |  |
| Colorectum | FAP |  |
| ∗Top 15 enriched GO BP terms are showed in the bar plot of each disease state in each tissue. Each row represents a significant GO biological process which is colored according to the -log10(p.adjust). |
| Page: 1 2 3 4 5 6 7 8 9 |
| GO ID | Tissue | Disease Stage | Description | Gene Ratio | Bg Ratio | pvalue | p.adjust | Count |
| GO:000184115 | Esophagus | ESCC | neural tube formation | 75/8552 | 102/18723 | 9.68e-09 | 1.95e-07 | 75 |
| GO:000184314 | Esophagus | ESCC | neural tube closure | 66/8552 | 88/18723 | 1.98e-08 | 3.82e-07 | 66 |
| GO:001402014 | Esophagus | ESCC | primary neural tube formation | 69/8552 | 94/18723 | 4.22e-08 | 7.76e-07 | 69 |
| GO:006060614 | Esophagus | ESCC | tube closure | 66/8552 | 89/18723 | 4.24e-08 | 7.76e-07 | 66 |
| GO:00219159 | Esophagus | ESCC | neural tube development | 101/8552 | 152/18723 | 1.78e-07 | 2.79e-06 | 101 |
| GO:00163316 | Esophagus | ESCC | morphogenesis of embryonic epithelium | 98/8552 | 147/18723 | 2.12e-07 | 3.27e-06 | 98 |
| GO:000183814 | Esophagus | ESCC | embryonic epithelial tube formation | 83/8552 | 121/18723 | 2.78e-07 | 4.08e-06 | 83 |
| GO:003514815 | Esophagus | ESCC | tube formation | 96/8552 | 148/18723 | 1.86e-06 | 2.16e-05 | 96 |
| GO:00721759 | Esophagus | ESCC | epithelial tube formation | 86/8552 | 132/18723 | 4.81e-06 | 5.10e-05 | 86 |
| GO:00303239 | Esophagus | ESCC | respiratory tube development | 112/8552 | 181/18723 | 7.82e-06 | 7.69e-05 | 112 |
| GO:006056210 | Esophagus | ESCC | epithelial tube morphogenesis | 187/8552 | 325/18723 | 9.95e-06 | 9.44e-05 | 187 |
| GO:00605417 | Esophagus | ESCC | respiratory system development | 123/8552 | 203/18723 | 1.26e-05 | 1.15e-04 | 123 |
| GO:00485687 | Esophagus | ESCC | embryonic organ development | 228/8552 | 427/18723 | 7.28e-04 | 3.79e-03 | 228 |
| GO:00603485 | Esophagus | ESCC | bone development | 115/8552 | 205/18723 | 1.67e-03 | 7.72e-03 | 115 |
| GO:00487367 | Esophagus | ESCC | appendage development | 98/8552 | 172/18723 | 1.83e-03 | 8.37e-03 | 98 |
| GO:00601737 | Esophagus | ESCC | limb development | 98/8552 | 172/18723 | 1.83e-03 | 8.37e-03 | 98 |
| GO:00487052 | Esophagus | ESCC | skeletal system morphogenesis | 120/8552 | 220/18723 | 4.90e-03 | 1.89e-02 | 120 |
| GO:19048881 | Esophagus | ESCC | cranial skeletal system development | 41/8552 | 68/18723 | 1.07e-02 | 3.66e-02 | 41 |
| GO:00018415 | Liver | HCC | neural tube formation | 62/7958 | 102/18723 | 1.47e-04 | 1.18e-03 | 62 |
| GO:00018433 | Liver | HCC | neural tube closure | 53/7958 | 88/18723 | 5.95e-04 | 3.75e-03 | 53 |
| Page: 1 2 3 4 5 |
| Pathway ID | Tissue | Disease Stage | Description | Gene Ratio | Bg Ratio | pvalue | p.adjust | qvalue | Count |
| Page: 1 |
Top |
Cell-cell communication analysis |
| Identification of potential cell-cell interactions between two cell types and their ligand-receptor pairs for different disease states |
| Ligand | Receptor | LRpair | Pathway | Tissue | Disease Stage |
| Page: 1 |
Top |
Single-cell gene regulatory network inference analysis |
| Find out the significant the regulons (TFs) and the target genes of each regulon across cell types for different disease states |
| TF | Cell Type | Tissue | Disease Stage | Target Gene | RSS | Regulon Activity |
| ∗The dot plots of a searched regulon are shown for all cell subpopulations in each disease state of each tissue based on the regulon specific score inferred using pySCENIC and by calculating the average expression. |
| Page: 1 |
Top |
Somatic mutation of malignant transformation related genes |
| Annotation of somatic variants for genes involved in malignant transformation |
| Hugo Symbol | Variant Class | Variant Classification | dbSNP RS | HGVSc | HGVSp | HGVSp Short | SWISSPROT | BIOTYPE | SIFT | PolyPhen | Tumor Sample Barcode | Tissue | Histology | Sex | Age | Stage | Therapy Types | Drugs | Outcome |
| TULP3 | SNV | Missense_Mutation | rs368526026 | c.934G>A | p.Val312Ile | p.V312I | O75386 | protein_coding | tolerated(0.07) | benign(0.167) | TCGA-5L-AAT1-01 | Breast | breast invasive carcinoma | Female | <65 | III/IV | Hormone Therapy | letrozol | SD |
| TULP3 | SNV | Missense_Mutation | c.539A>G | p.Asn180Ser | p.N180S | O75386 | protein_coding | tolerated(0.5) | benign(0.053) | TCGA-AN-A0XT-01 | Breast | breast invasive carcinoma | Female | <65 | III/IV | Unknown | Unknown | SD | |
| TULP3 | SNV | Missense_Mutation | novel | c.592N>G | p.Gln198Glu | p.Q198E | O75386 | protein_coding | deleterious(0.04) | benign(0.022) | TCGA-C8-A8HP-01 | Breast | breast invasive carcinoma | Female | <65 | III/IV | Chemotherapy | 5-fluorouracil | CR |
| TULP3 | insertion | Nonsense_Mutation | novel | c.1375_1376insTACGGATCCATTAGTGAGGAG | p.Ser459delinsLeuArgIleHisTerTerGlyAla | p.S459delinsLRIH**GA | O75386 | protein_coding | TCGA-B6-A0IA-01 | Breast | breast invasive carcinoma | Female | <65 | I/II | Unknown | Unknown | SD | ||
| TULP3 | deletion | Frame_Shift_Del | c.121delN | p.Lys42SerfsTer31 | p.K42Sfs*31 | O75386 | protein_coding | TCGA-D8-A1XK-01 | Breast | breast invasive carcinoma | Female | <65 | I/II | Chemotherapy | doxorubicine+cyclophosphamide | SD | |||
| TULP3 | deletion | Frame_Shift_Del | novel | c.934delN | p.Val312TyrfsTer12 | p.V312Yfs*12 | O75386 | protein_coding | TCGA-EW-A2FV-01 | Breast | breast invasive carcinoma | Female | <65 | III/IV | Chemotherapy | docetaxel | SD | ||
| TULP3 | SNV | Missense_Mutation | rs115288066 | c.1195N>T | p.Pro399Ser | p.P399S | O75386 | protein_coding | deleterious(0.04) | benign(0.117) | TCGA-2W-A8YY-01 | Cervix | cervical & endocervical cancer | Female | <65 | I/II | Chemotherapy | cisplatin | CR |
| TULP3 | SNV | Missense_Mutation | c.703N>A | p.Leu235Ile | p.L235I | O75386 | protein_coding | deleterious(0.01) | probably_damaging(0.999) | TCGA-AA-3510-01 | Colorectum | colon adenocarcinoma | Male | >=65 | I/II | Unknown | Unknown | SD | |
| TULP3 | SNV | Missense_Mutation | rs770408342 | c.1099N>A | p.Val367Ile | p.V367I | O75386 | protein_coding | tolerated(0.05) | benign(0.146) | TCGA-AA-3864-01 | Colorectum | colon adenocarcinoma | Male | >=65 | I/II | Unknown | Unknown | SD |
| TULP3 | SNV | Missense_Mutation | c.68N>C | p.Met23Thr | p.M23T | O75386 | protein_coding | deleterious(0) | benign(0.196) | TCGA-AA-3949-01 | Colorectum | colon adenocarcinoma | Female | >=65 | III/IV | Unknown | Unknown | SD |
| Page: 1 2 3 4 5 |
Top |
Related drugs of malignant transformation related genes |
| Identification of chemicals and drugs interact with genes involved in malignant transfromation |
| (DGIdb 4.0) |
| Entrez ID | Symbol | Category | Interaction Types | Drug Claim Name | Drug Name | PMIDs |
| Page: 1 |

Copyright 2023-Present -The University of Texas Health Science Center at Houston |