
|
|||||
|
 | |
| |
| |
| |
| |
| |
|
Gene: TUFM |
Gene summary for TUFM |
| Gene information | Species | Human | Gene symbol | TUFM | Gene ID | 7284 |
| Gene name | Tu translation elongation factor, mitochondrial | |
| Gene Alias | COXPD4 | |
| Cytomap | 16p11.2 | |
| Gene Type | protein-coding | GO ID | GO:0006412 | UniProtAcc | P49411 |
Top |
Malignant transformation analysis |
| Identification of the aberrant gene expression in precancerous and cancerous lesions by comparing the gene expression of stem-like cells in diseased tissues with normal stem cells |
| Entrez ID | Symbol | Replicates | Species | Organ | Tissue | Adj P-value | Log2FC | Malignancy |
| 7284 | TUFM | HTA11_3410_2000001011 | Human | Colorectum | AD | 3.17e-31 | 7.18e-01 | 0.0155 |
| 7284 | TUFM | HTA11_2487_2000001011 | Human | Colorectum | SER | 6.03e-28 | 1.04e+00 | -0.1808 |
| 7284 | TUFM | HTA11_2951_2000001011 | Human | Colorectum | AD | 1.34e-03 | 7.20e-01 | 0.0216 |
| 7284 | TUFM | HTA11_1938_2000001011 | Human | Colorectum | AD | 2.85e-22 | 9.99e-01 | -0.0811 |
| 7284 | TUFM | HTA11_78_2000001011 | Human | Colorectum | AD | 1.08e-18 | 6.98e-01 | -0.1088 |
| 7284 | TUFM | HTA11_347_2000001011 | Human | Colorectum | AD | 6.28e-36 | 9.59e-01 | -0.1954 |
| 7284 | TUFM | HTA11_411_2000001011 | Human | Colorectum | SER | 4.63e-12 | 1.45e+00 | -0.2602 |
| 7284 | TUFM | HTA11_2112_2000001011 | Human | Colorectum | SER | 1.09e-04 | 9.00e-01 | -0.2196 |
| 7284 | TUFM | HTA11_3361_2000001011 | Human | Colorectum | AD | 1.36e-12 | 7.72e-01 | -0.1207 |
| 7284 | TUFM | HTA11_83_2000001011 | Human | Colorectum | SER | 7.22e-24 | 1.06e+00 | -0.1526 |
| 7284 | TUFM | HTA11_696_2000001011 | Human | Colorectum | AD | 2.41e-45 | 1.08e+00 | -0.1464 |
| 7284 | TUFM | HTA11_866_2000001011 | Human | Colorectum | AD | 6.93e-20 | 6.51e-01 | -0.1001 |
| 7284 | TUFM | HTA11_1391_2000001011 | Human | Colorectum | AD | 4.46e-41 | 1.33e+00 | -0.059 |
| 7284 | TUFM | HTA11_2992_2000001011 | Human | Colorectum | SER | 1.72e-10 | 1.26e+00 | -0.1706 |
| 7284 | TUFM | HTA11_5212_2000001011 | Human | Colorectum | AD | 1.14e-19 | 9.76e-01 | -0.2061 |
| 7284 | TUFM | HTA11_5216_2000001011 | Human | Colorectum | SER | 4.64e-06 | 8.40e-01 | -0.1462 |
| 7284 | TUFM | HTA11_546_2000001011 | Human | Colorectum | AD | 8.66e-13 | 8.33e-01 | -0.0842 |
| 7284 | TUFM | HTA11_9341_2000001011 | Human | Colorectum | SER | 2.90e-04 | 6.00e-01 | -0.00410000000000005 |
| 7284 | TUFM | HTA11_7862_2000001011 | Human | Colorectum | AD | 4.91e-14 | 8.35e-01 | -0.0179 |
| 7284 | TUFM | HTA11_866_3004761011 | Human | Colorectum | AD | 7.58e-36 | 9.58e-01 | 0.096 |
| Page: 1 2 3 4 5 6 7 8 9 10 |
| Tissue | Expression Dynamics | Abbreviation |
| Colorectum (GSE201348) | 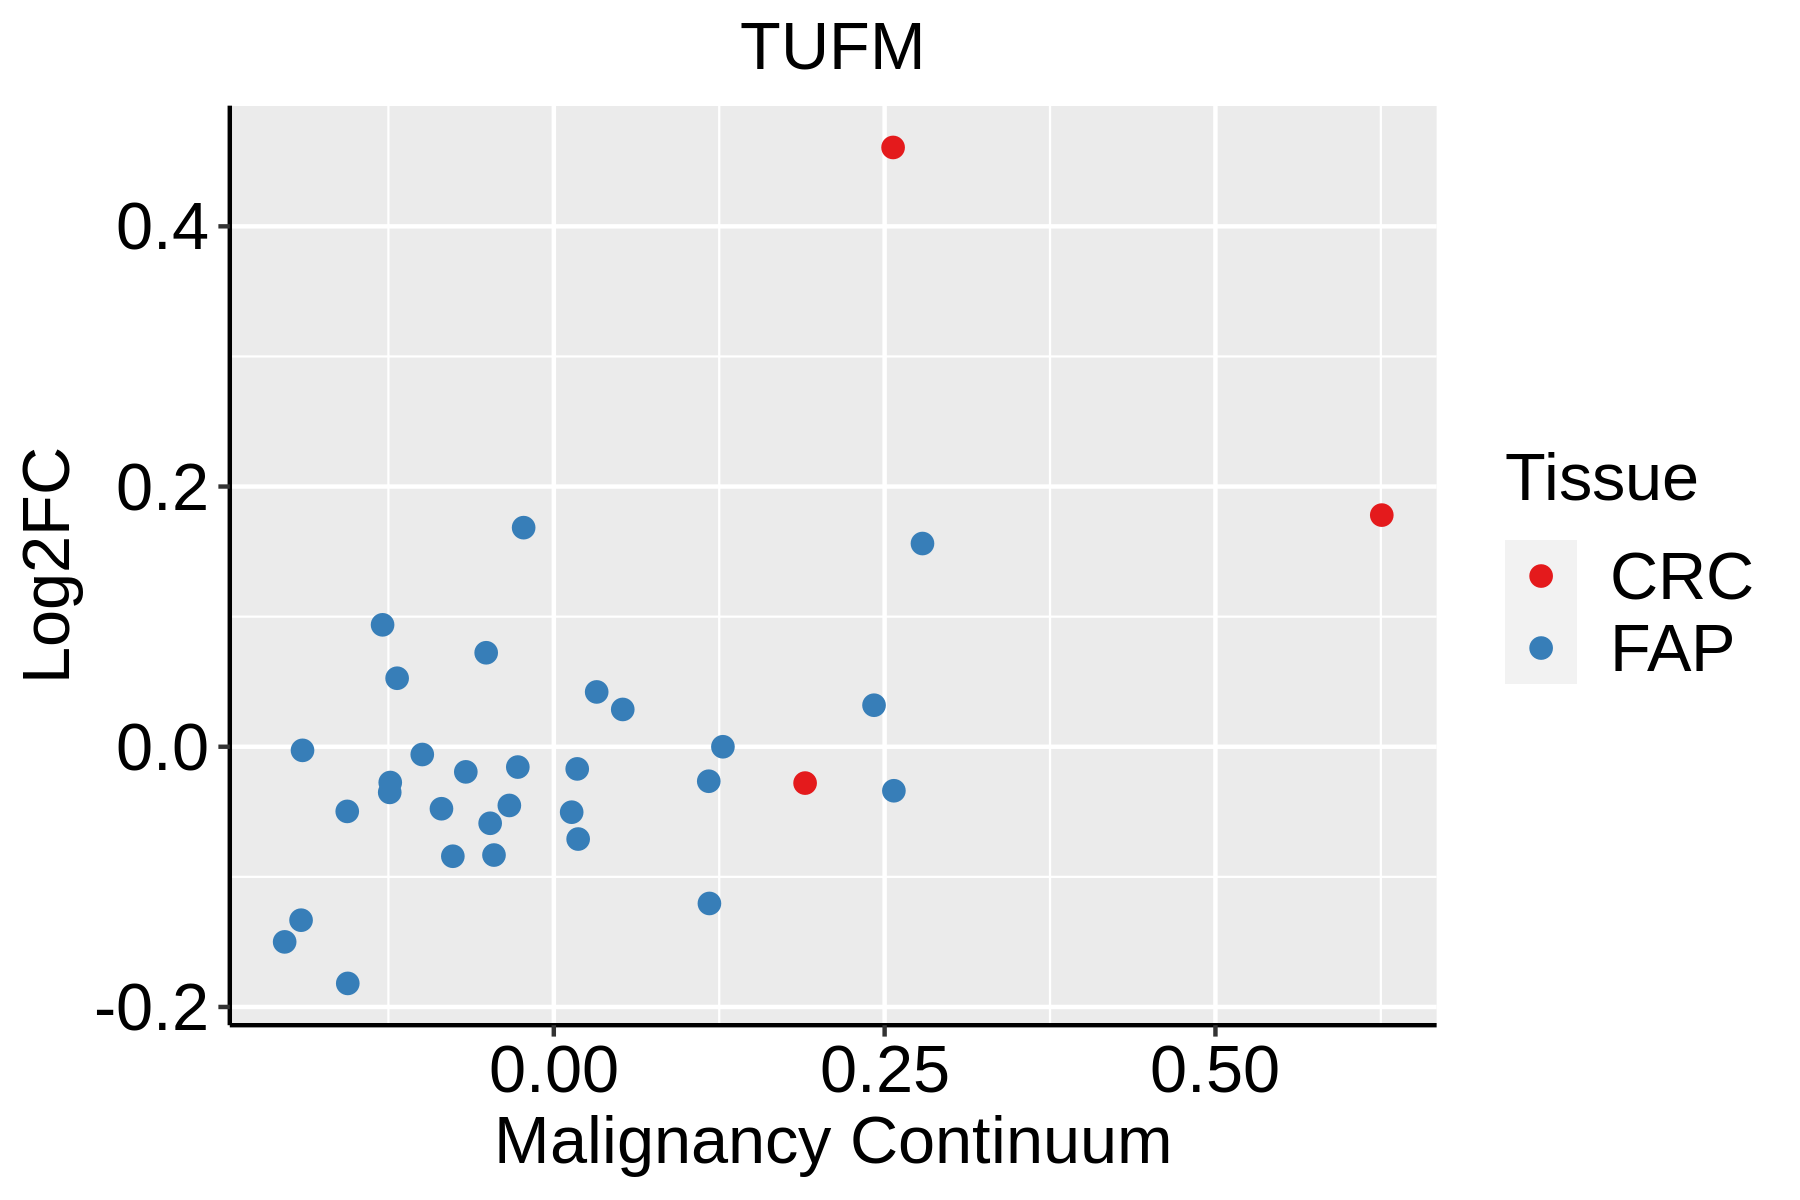 | FAP: Familial adenomatous polyposis |
| CRC: Colorectal cancer | ||
| Colorectum (HTA11) |  | AD: Adenomas |
| SER: Sessile serrated lesions | ||
| MSI-H: Microsatellite-high colorectal cancer | ||
| MSS: Microsatellite stable colorectal cancer | ||
| Endometrium | 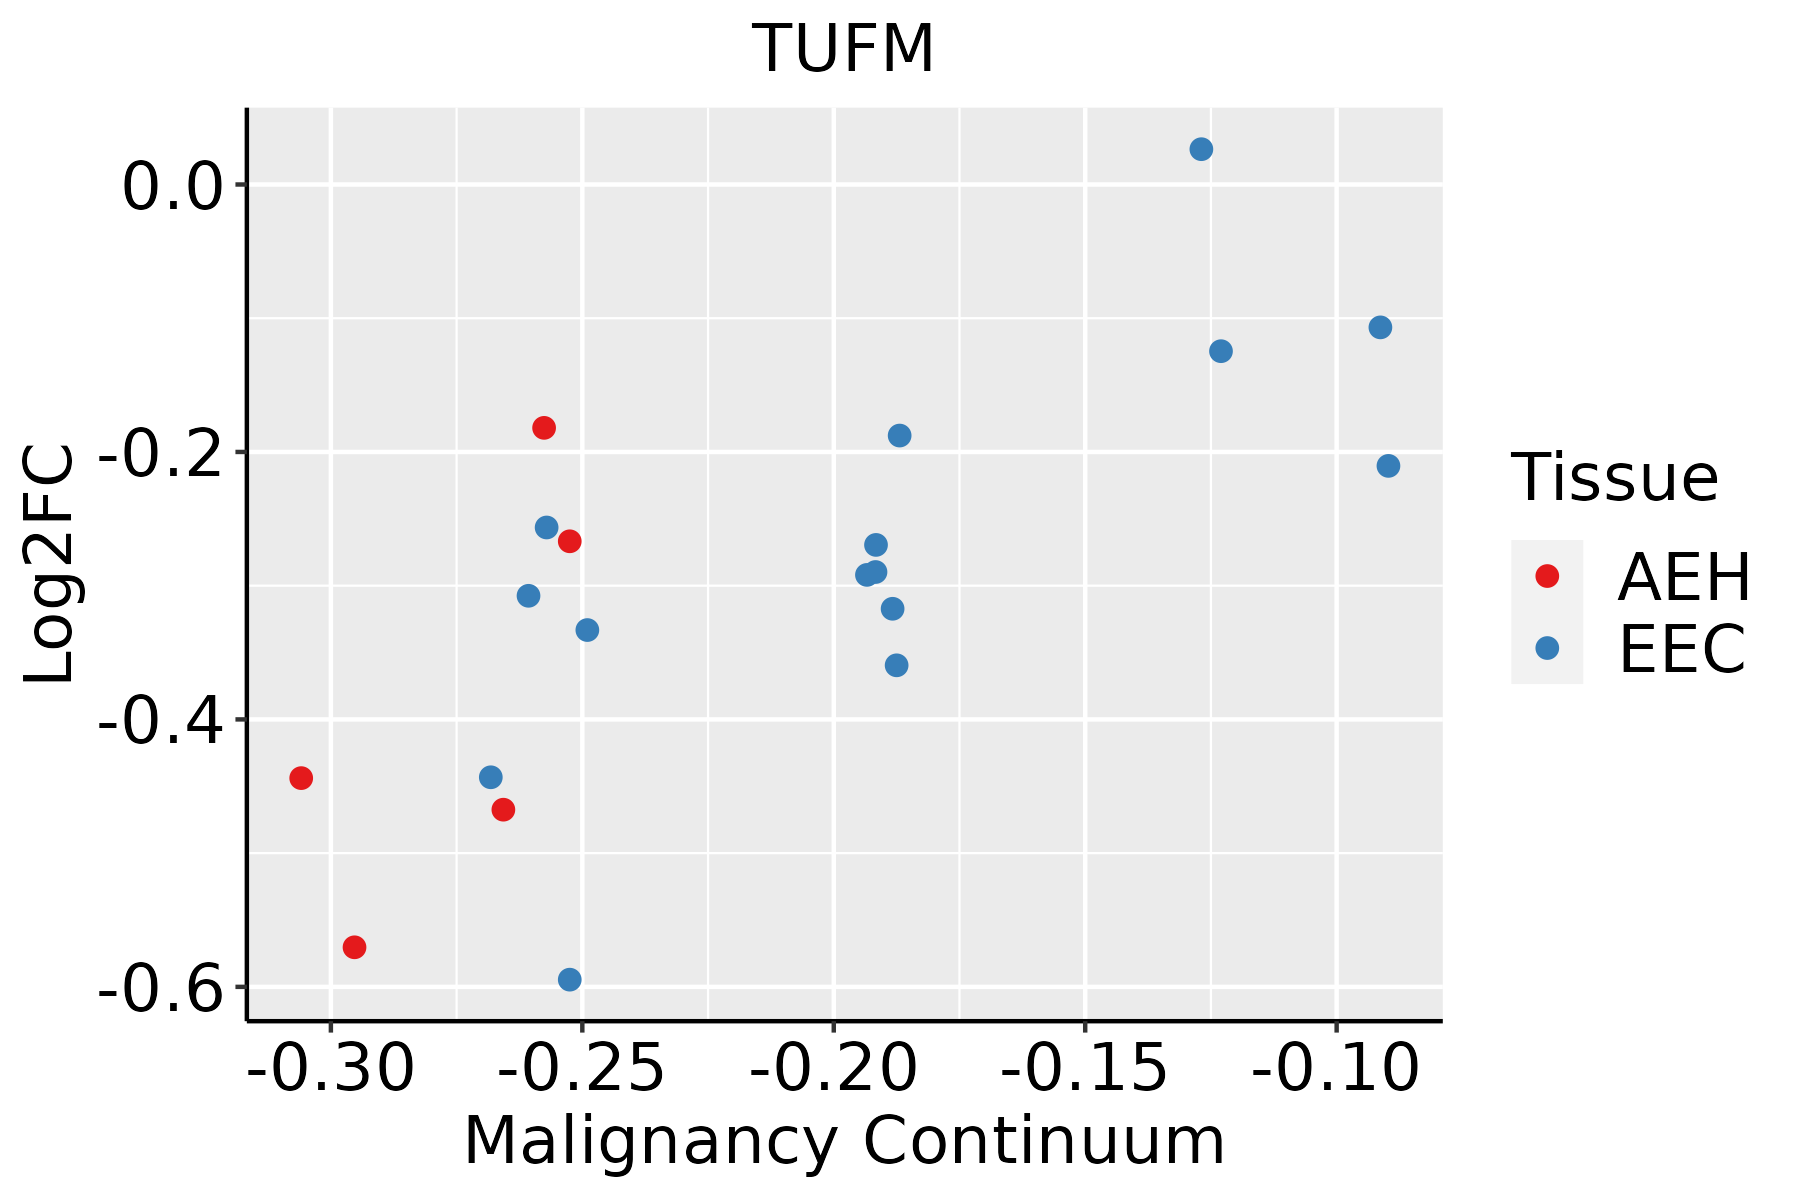 | AEH: Atypical endometrial hyperplasia |
| EEC: Endometrioid Cancer | ||
| Esophagus |  | ESCC: Esophageal squamous cell carcinoma |
| HGIN: High-grade intraepithelial neoplasias | ||
| LGIN: Low-grade intraepithelial neoplasias | ||
| Liver | 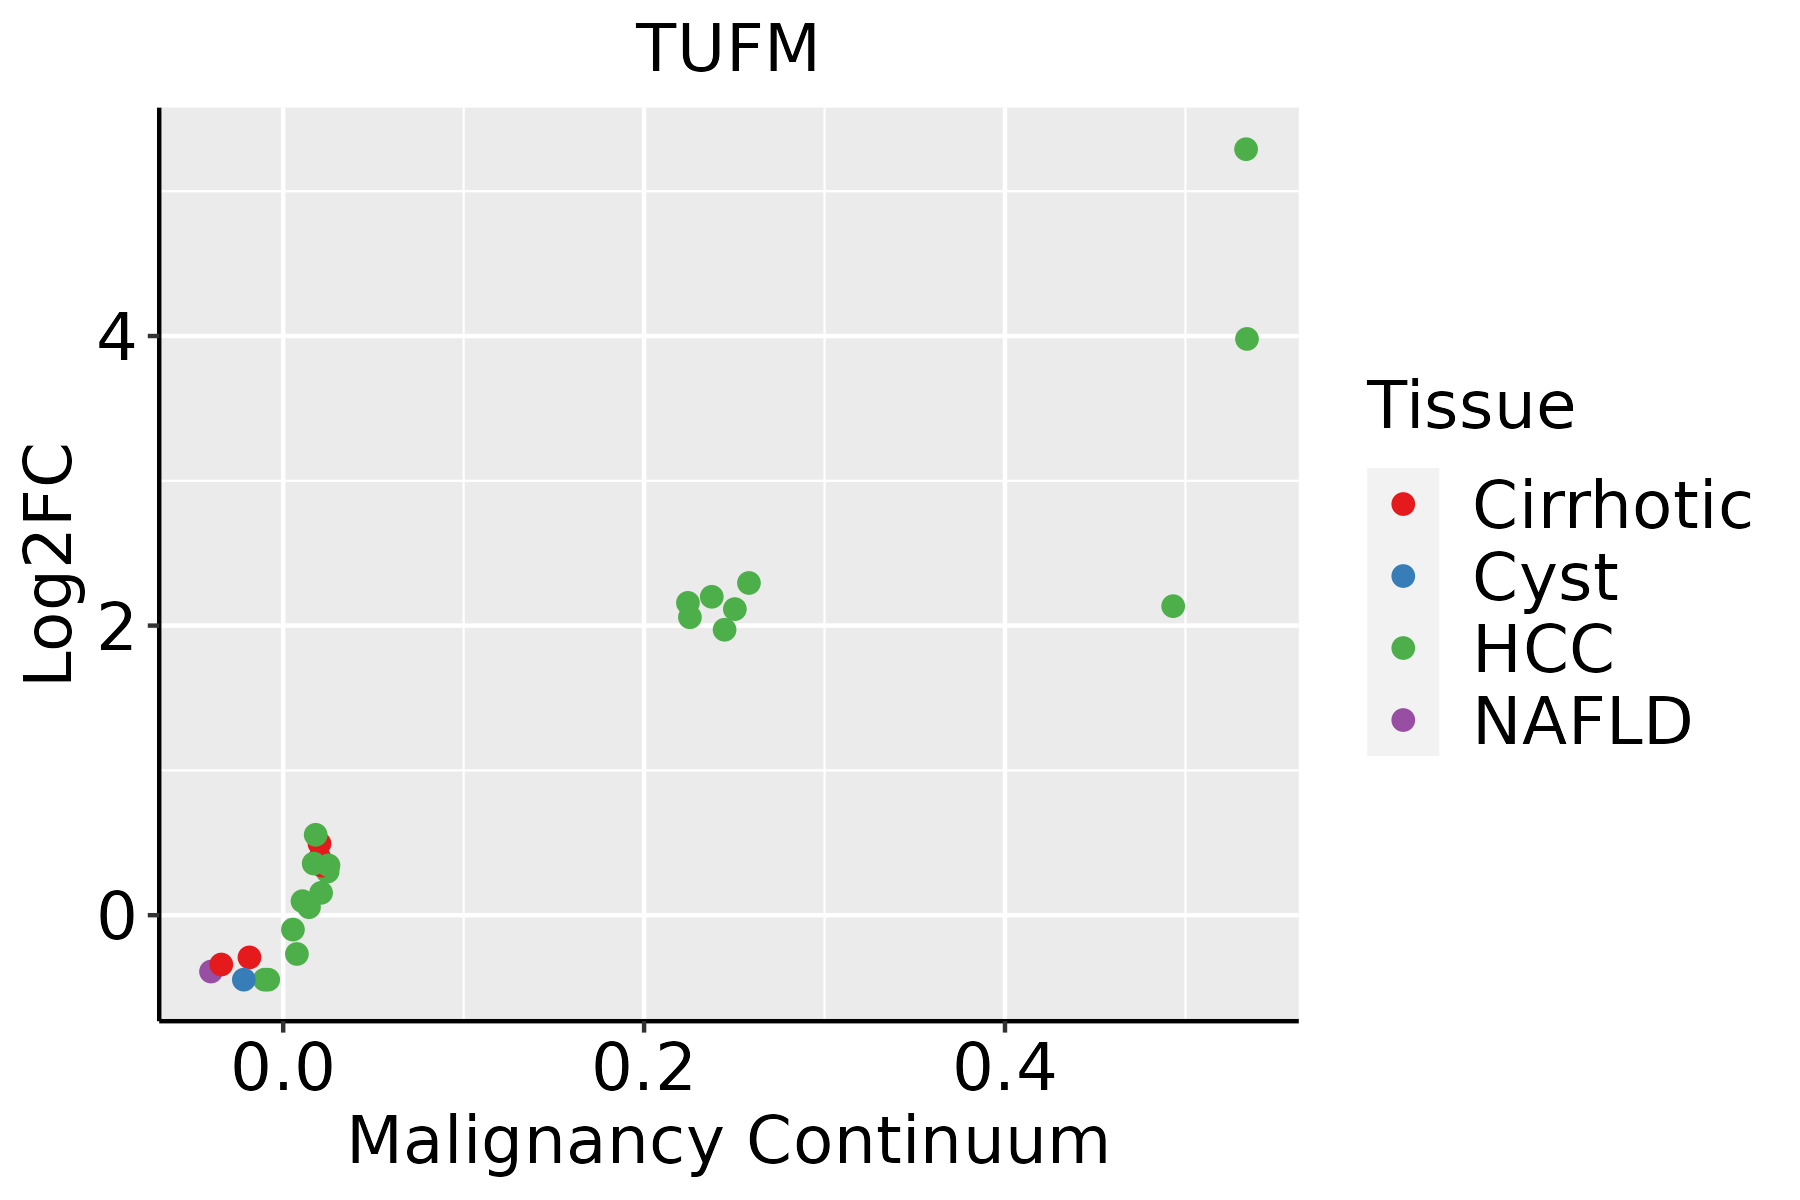 | HCC: Hepatocellular carcinoma |
| NAFLD: Non-alcoholic fatty liver disease | ||
| Oral Cavity | 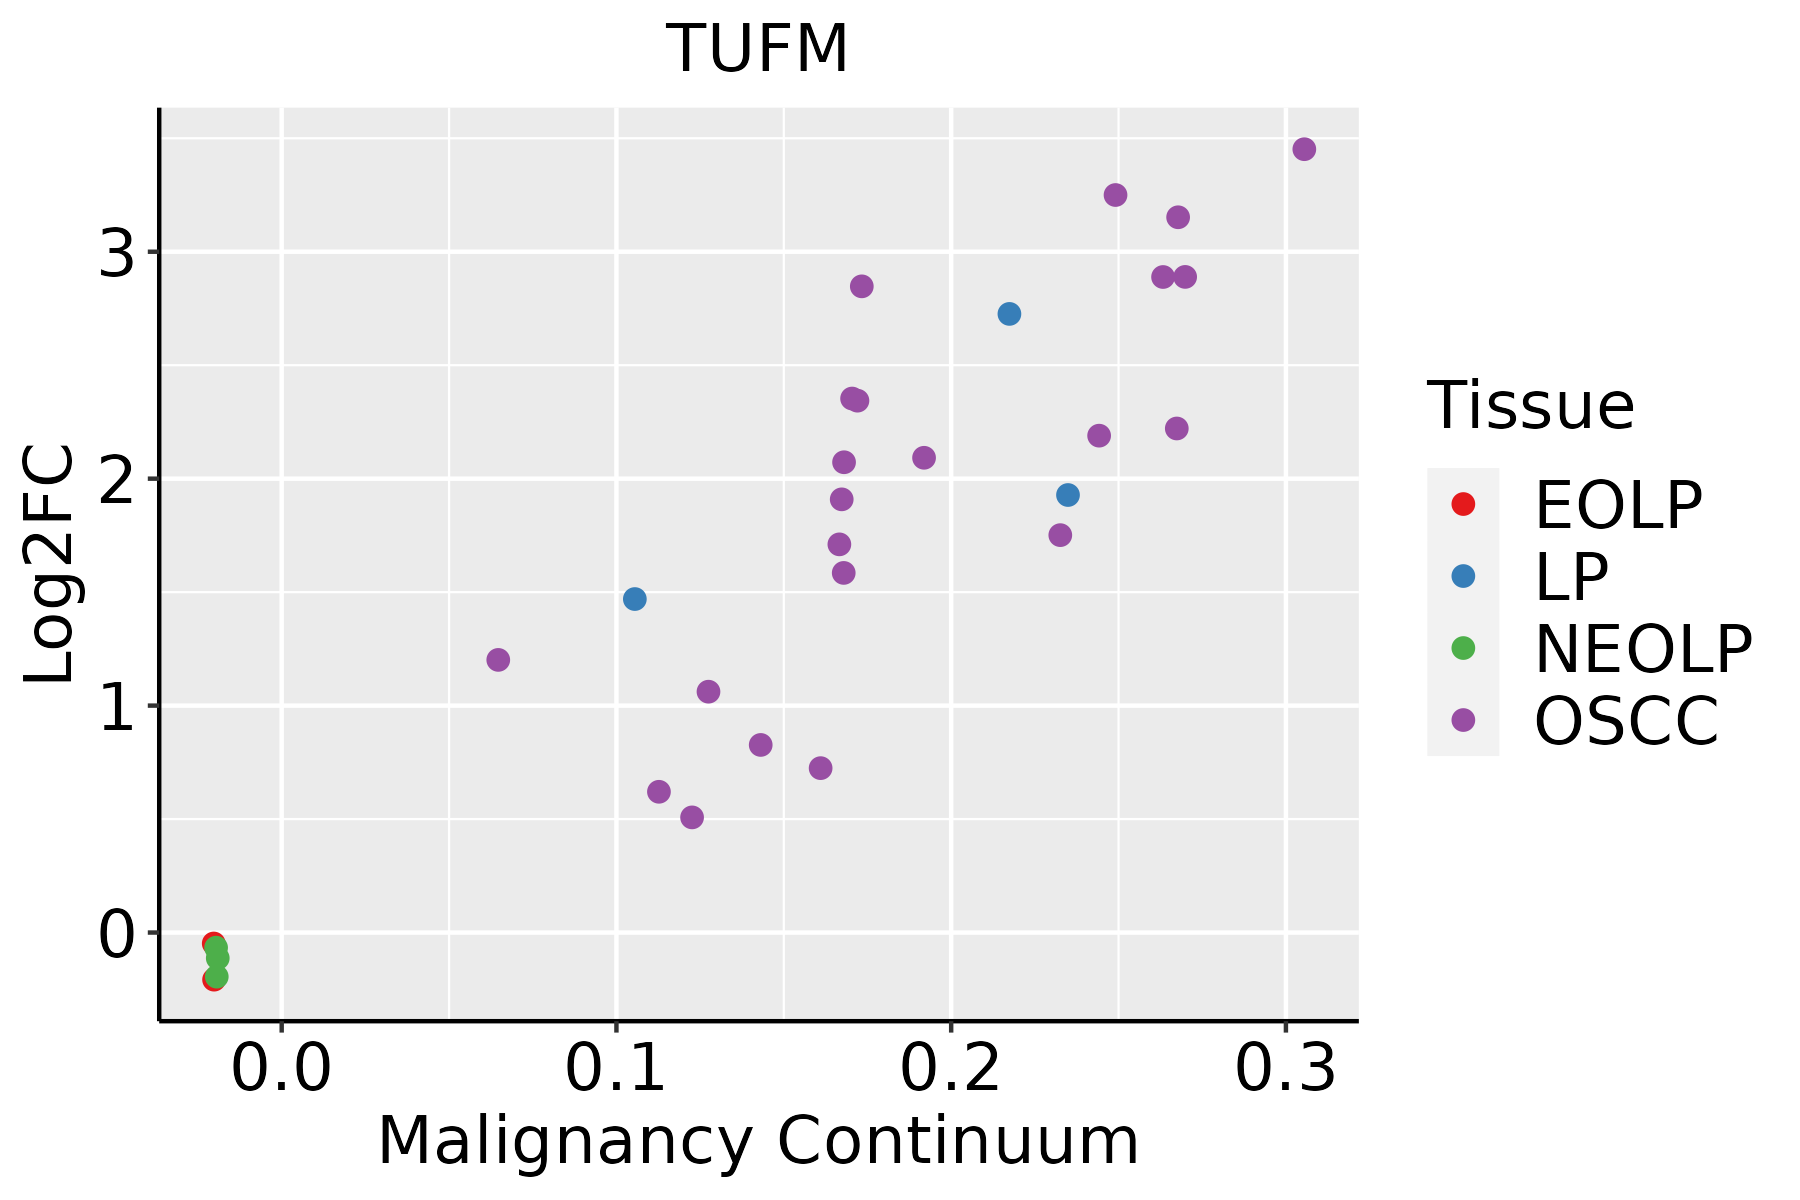 | EOLP: Erosive Oral lichen planus |
| LP: leukoplakia | ||
| NEOLP: Non-erosive oral lichen planus | ||
| OSCC: Oral squamous cell carcinoma | ||
| Prostate |  | BPH: Benign Prostatic Hyperplasia |
| Skin |  | AK: Actinic keratosis |
| cSCC: Cutaneous squamous cell carcinoma | ||
| SCCIS:squamous cell carcinoma in situ | ||
| Thyroid |  | ATC: Anaplastic thyroid cancer |
| HT: Hashimoto's thyroiditis | ||
| PTC: Papillary thyroid cancer |
| ∗log2FC in expression of this searched gene in stem-like cells from each diseased tissue sample relative to stem-like cells in normal samples in each tissue plotted against the malignancy continuum. Samples are colored based on if they are from different disease stage. |
Top |
Malignant transformation related pathway analysis |
| Find out the enriched GO biological processes and KEGG pathways involved in transition from healthy to precancer to cancer |
| Tissue | Disease Stage | Enriched GO biological Processes |
| Colorectum | AD |  |
| Colorectum | SER |  |
| Colorectum | MSS |  |
| Colorectum | MSI-H |  |
| Colorectum | FAP |  |
| ∗Top 15 enriched GO BP terms are showed in the bar plot of each disease state in each tissue. Each row represents a significant GO biological process which is colored according to the -log10(p.adjust). |
| Page: 1 2 3 4 5 6 7 8 9 |
| GO ID | Tissue | Disease Stage | Description | Gene Ratio | Bg Ratio | pvalue | p.adjust | Count |
| GO:0006414 | Colorectum | AD | translational elongation | 21/3918 | 55/18723 | 2.53e-03 | 1.93e-02 | 21 |
| GO:0097305 | Colorectum | AD | response to alcohol | 71/3918 | 253/18723 | 4.01e-03 | 2.80e-02 | 71 |
| GO:00064141 | Colorectum | SER | translational elongation | 17/2897 | 55/18723 | 3.00e-03 | 2.65e-02 | 17 |
| GO:00973051 | Colorectum | MSS | response to alcohol | 66/3467 | 253/18723 | 1.73e-03 | 1.54e-02 | 66 |
| GO:00064142 | Colorectum | MSS | translational elongation | 19/3467 | 55/18723 | 3.47e-03 | 2.59e-02 | 19 |
| GO:00973052 | Colorectum | MSI-H | response to alcohol | 33/1319 | 253/18723 | 4.53e-04 | 9.61e-03 | 33 |
| GO:00064143 | Colorectum | CRC | translational elongation | 14/2078 | 55/18723 | 2.21e-03 | 2.15e-02 | 14 |
| GO:00973054 | Colorectum | CRC | response to alcohol | 43/2078 | 253/18723 | 2.96e-03 | 2.66e-02 | 43 |
| GO:009730510 | Endometrium | AEH | response to alcohol | 48/2100 | 253/18723 | 1.80e-04 | 2.31e-03 | 48 |
| GO:00064149 | Endometrium | AEH | translational elongation | 13/2100 | 55/18723 | 6.76e-03 | 3.94e-02 | 13 |
| GO:009730516 | Endometrium | EEC | response to alcohol | 49/2168 | 253/18723 | 1.99e-04 | 2.42e-03 | 49 |
| GO:000641414 | Endometrium | EEC | translational elongation | 13/2168 | 55/18723 | 8.79e-03 | 4.74e-02 | 13 |
| GO:000641418 | Esophagus | HGIN | translational elongation | 22/2587 | 55/18723 | 1.46e-06 | 5.56e-05 | 22 |
| GO:00325435 | Esophagus | HGIN | mitochondrial translation | 23/2587 | 76/18723 | 1.61e-04 | 3.16e-03 | 23 |
| GO:009730520 | Esophagus | HGIN | response to alcohol | 54/2587 | 253/18723 | 6.46e-04 | 8.87e-03 | 54 |
| GO:01400534 | Esophagus | HGIN | mitochondrial gene expression | 27/2587 | 108/18723 | 1.34e-03 | 1.57e-02 | 27 |
| GO:014005313 | Esophagus | ESCC | mitochondrial gene expression | 93/8552 | 108/18723 | 1.96e-18 | 2.03e-16 | 93 |
| GO:003254314 | Esophagus | ESCC | mitochondrial translation | 68/8552 | 76/18723 | 1.02e-15 | 6.86e-14 | 68 |
| GO:000641419 | Esophagus | ESCC | translational elongation | 41/8552 | 55/18723 | 1.26e-05 | 1.16e-04 | 41 |
| GO:0097305111 | Esophagus | ESCC | response to alcohol | 138/8552 | 253/18723 | 2.70e-03 | 1.14e-02 | 138 |
| Page: 1 2 3 |
| Pathway ID | Tissue | Disease Stage | Description | Gene Ratio | Bg Ratio | pvalue | p.adjust | qvalue | Count |
| Page: 1 |
Top |
Cell-cell communication analysis |
| Identification of potential cell-cell interactions between two cell types and their ligand-receptor pairs for different disease states |
| Ligand | Receptor | LRpair | Pathway | Tissue | Disease Stage |
| Page: 1 |
Top |
Single-cell gene regulatory network inference analysis |
| Find out the significant the regulons (TFs) and the target genes of each regulon across cell types for different disease states |
| TF | Cell Type | Tissue | Disease Stage | Target Gene | RSS | Regulon Activity |
| ∗The dot plots of a searched regulon are shown for all cell subpopulations in each disease state of each tissue based on the regulon specific score inferred using pySCENIC and by calculating the average expression. |
| Page: 1 |
Top |
Somatic mutation of malignant transformation related genes |
| Annotation of somatic variants for genes involved in malignant transformation |
| Hugo Symbol | Variant Class | Variant Classification | dbSNP RS | HGVSc | HGVSp | HGVSp Short | SWISSPROT | BIOTYPE | SIFT | PolyPhen | Tumor Sample Barcode | Tissue | Histology | Sex | Age | Stage | Therapy Types | Drugs | Outcome |
| TUFM | SNV | Missense_Mutation | rs149786169 | c.1364N>A | p.Gly455Asp | p.G455D | P49411 | protein_coding | deleterious_low_confidence(0) | benign(0.221) | TCGA-A1-A0SO-01 | Breast | breast invasive carcinoma | Female | >=65 | I/II | Chemotherapy | SD | |
| TUFM | SNV | Missense_Mutation | c.1258N>C | p.Glu420Gln | p.E420Q | P49411 | protein_coding | deleterious(0.01) | possibly_damaging(0.761) | TCGA-AC-A23H-01 | Breast | breast invasive carcinoma | Female | >=65 | I/II | Unknown | Unknown | PD | |
| TUFM | SNV | Missense_Mutation | novel | c.931A>C | p.Met311Leu | p.M311L | P49411 | protein_coding | deleterious(0) | probably_damaging(0.978) | TCGA-AN-A046-01 | Breast | breast invasive carcinoma | Female | >=65 | I/II | Unknown | Unknown | SD |
| TUFM | SNV | Missense_Mutation | c.811N>A | p.Val271Ile | p.V271I | P49411 | protein_coding | tolerated(1) | benign(0.003) | TCGA-BH-A0E0-01 | Breast | breast invasive carcinoma | Female | <65 | III/IV | Chemotherapy | docetaxel | SD | |
| TUFM | SNV | Missense_Mutation | rs373054580 | c.299N>G | p.Asn100Ser | p.N100S | P49411 | protein_coding | deleterious(0.05) | benign(0.007) | TCGA-VS-A8QA-01 | Cervix | cervical & endocervical cancer | Female | <65 | I/II | Unknown | Unknown | SD |
| TUFM | SNV | Missense_Mutation | novel | c.971N>G | p.Asn324Ser | p.N324S | P49411 | protein_coding | deleterious(0.02) | probably_damaging(0.985) | TCGA-AA-3663-01 | Colorectum | colon adenocarcinoma | Male | <65 | I/II | Unknown | Unknown | SD |
| TUFM | SNV | Missense_Mutation | rs180768366 | c.850C>T | p.Arg284Cys | p.R284C | P49411 | protein_coding | deleterious(0.01) | benign(0.055) | TCGA-AZ-6601-01 | Colorectum | colon adenocarcinoma | Male | >=65 | I/II | Unknown | Unknown | PD |
| TUFM | SNV | Missense_Mutation | novel | c.253G>A | p.Ala85Thr | p.A85T | P49411 | protein_coding | deleterious(0.01) | benign(0.255) | TCGA-CA-6717-01 | Colorectum | colon adenocarcinoma | Male | <65 | I/II | Chemotherapy | oxaliplatin | CR |
| TUFM | SNV | Missense_Mutation | c.850C>A | p.Arg284Ser | p.R284S | P49411 | protein_coding | deleterious(0.01) | possibly_damaging(0.58) | TCGA-D5-5540-01 | Colorectum | colon adenocarcinoma | Male | >=65 | I/II | Unknown | Unknown | SD | |
| TUFM | SNV | Missense_Mutation | rs753682714 | c.1001N>A | p.Arg334Gln | p.R334Q | P49411 | protein_coding | deleterious(0) | possibly_damaging(0.84) | TCGA-G4-6320-01 | Colorectum | colon adenocarcinoma | Male | >=65 | III/IV | Chemotherapy | oxaliplatin | SD |
| Page: 1 2 3 4 5 |
Top |
Related drugs of malignant transformation related genes |
| Identification of chemicals and drugs interact with genes involved in malignant transfromation |
| (DGIdb 4.0) |
| Entrez ID | Symbol | Category | Interaction Types | Drug Claim Name | Drug Name | PMIDs |
| Page: 1 |

Copyright 2023-Present -The University of Texas Health Science Center at Houston |