
|
|||||
|
 | |
| |
| |
| |
| |
| |
|
Gene: TUBGCP4 |
Gene summary for TUBGCP4 |
| Gene information | Species | Human | Gene symbol | TUBGCP4 | Gene ID | 27229 |
| Gene name | tubulin gamma complex associated protein 4 | |
| Gene Alias | 76P | |
| Cytomap | 15q15.3 | |
| Gene Type | protein-coding | GO ID | GO:0000003 | UniProtAcc | Q9UGJ1 |
Top |
Malignant transformation analysis |
| Identification of the aberrant gene expression in precancerous and cancerous lesions by comparing the gene expression of stem-like cells in diseased tissues with normal stem cells |
| Entrez ID | Symbol | Replicates | Species | Organ | Tissue | Adj P-value | Log2FC | Malignancy |
| 27229 | TUBGCP4 | HCC1_Meng | Human | Liver | HCC | 7.83e-34 | 5.35e-02 | 0.0246 |
| 27229 | TUBGCP4 | HCC2_Meng | Human | Liver | HCC | 1.26e-14 | 7.61e-02 | 0.0107 |
| 27229 | TUBGCP4 | HCC1 | Human | Liver | HCC | 8.07e-11 | 2.41e+00 | 0.5336 |
| 27229 | TUBGCP4 | HCC2 | Human | Liver | HCC | 7.87e-21 | 2.82e+00 | 0.5341 |
| 27229 | TUBGCP4 | HCC5 | Human | Liver | HCC | 1.45e-15 | 1.21e+00 | 0.4932 |
| 27229 | TUBGCP4 | S015 | Human | Liver | HCC | 6.45e-03 | 1.68e-01 | 0.2375 |
| 27229 | TUBGCP4 | S016 | Human | Liver | HCC | 2.69e-02 | 1.57e-01 | 0.2243 |
| 27229 | TUBGCP4 | S027 | Human | Liver | HCC | 1.29e-04 | 4.01e-01 | 0.2446 |
| 27229 | TUBGCP4 | S028 | Human | Liver | HCC | 7.18e-13 | 4.12e-01 | 0.2503 |
| 27229 | TUBGCP4 | S029 | Human | Liver | HCC | 3.82e-03 | 2.02e-01 | 0.2581 |
| Page: 1 |
| Tissue | Expression Dynamics | Abbreviation |
| Liver | 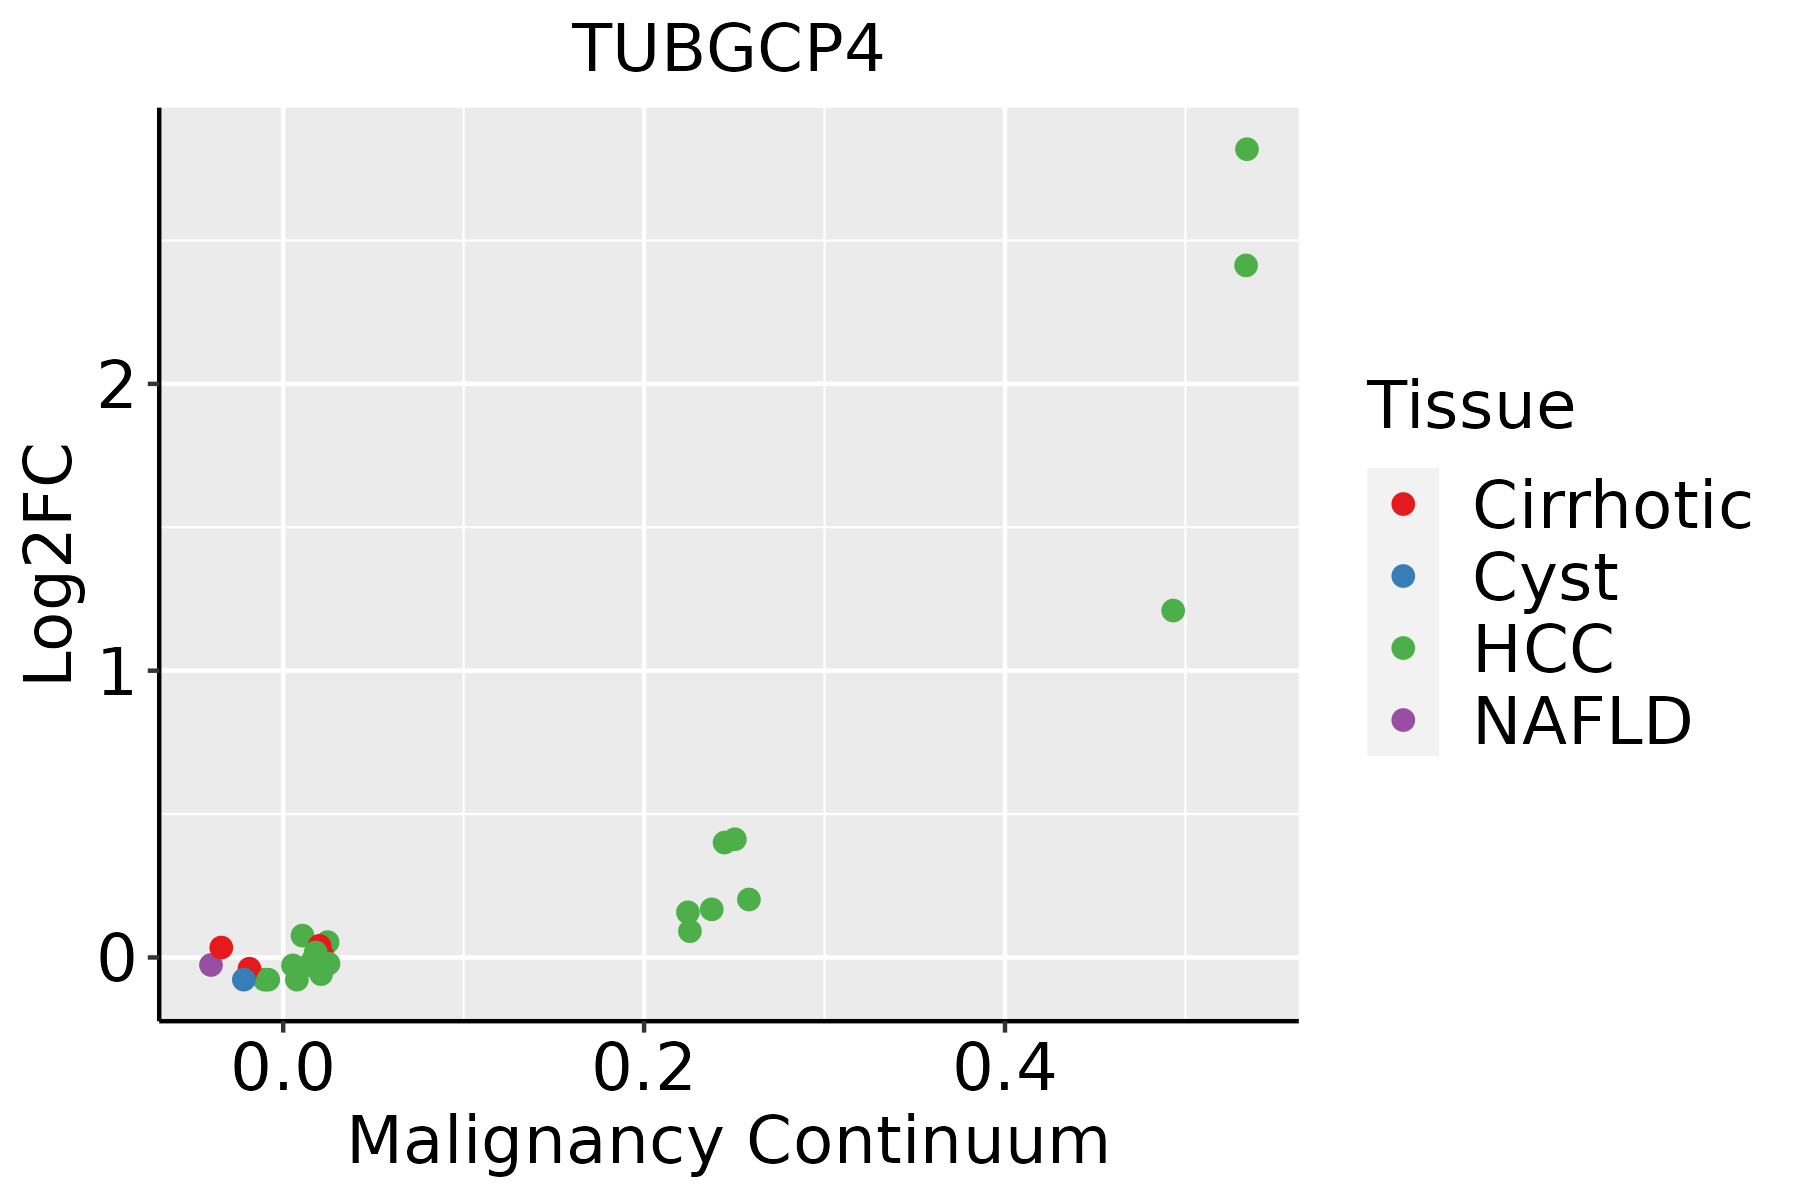 | HCC: Hepatocellular carcinoma |
| NAFLD: Non-alcoholic fatty liver disease |
| ∗log2FC in expression of this searched gene in stem-like cells from each diseased tissue sample relative to stem-like cells in normal samples in each tissue plotted against the malignancy continuum. Samples are colored based on if they are from different disease stage. |
Top |
Malignant transformation related pathway analysis |
| Find out the enriched GO biological processes and KEGG pathways involved in transition from healthy to precancer to cancer |
| Tissue | Disease Stage | Enriched GO biological Processes |
| Colorectum | AD |  |
| Colorectum | SER |  |
| Colorectum | MSS |  |
| Colorectum | MSI-H |  |
| Colorectum | FAP |  |
| ∗Top 15 enriched GO BP terms are showed in the bar plot of each disease state in each tissue. Each row represents a significant GO biological process which is colored according to the -log10(p.adjust). |
| Page: 1 2 3 4 5 6 7 8 9 |
| GO ID | Tissue | Disease Stage | Description | Gene Ratio | Bg Ratio | pvalue | p.adjust | Count |
| GO:005125822 | Liver | HCC | protein polymerization | 182/7958 | 297/18723 | 4.17e-11 | 1.58e-09 | 182 |
| GO:000705111 | Liver | HCC | spindle organization | 116/7958 | 184/18723 | 1.40e-08 | 3.40e-07 | 116 |
| GO:005122511 | Liver | HCC | spindle assembly | 75/7958 | 117/18723 | 1.92e-06 | 2.67e-05 | 75 |
| GO:0046785 | Liver | HCC | microtubule polymerization | 51/7958 | 83/18723 | 3.82e-04 | 2.61e-03 | 51 |
| GO:0007020 | Liver | HCC | microtubule nucleation | 25/7958 | 35/18723 | 5.05e-04 | 3.29e-03 | 25 |
| GO:00311222 | Liver | HCC | cytoplasmic microtubule organization | 35/7958 | 56/18723 | 2.00e-03 | 1.01e-02 | 35 |
| GO:0031109 | Liver | HCC | microtubule polymerization or depolymerization | 68/7958 | 122/18723 | 2.14e-03 | 1.08e-02 | 68 |
| Page: 1 |
| Pathway ID | Tissue | Disease Stage | Description | Gene Ratio | Bg Ratio | pvalue | p.adjust | qvalue | Count |
| Page: 1 |
Top |
Cell-cell communication analysis |
| Identification of potential cell-cell interactions between two cell types and their ligand-receptor pairs for different disease states |
| Ligand | Receptor | LRpair | Pathway | Tissue | Disease Stage |
| Page: 1 |
Top |
Single-cell gene regulatory network inference analysis |
| Find out the significant the regulons (TFs) and the target genes of each regulon across cell types for different disease states |
| TF | Cell Type | Tissue | Disease Stage | Target Gene | RSS | Regulon Activity |
| ∗The dot plots of a searched regulon are shown for all cell subpopulations in each disease state of each tissue based on the regulon specific score inferred using pySCENIC and by calculating the average expression. |
| Page: 1 |
Top |
Somatic mutation of malignant transformation related genes |
| Annotation of somatic variants for genes involved in malignant transformation |
| Hugo Symbol | Variant Class | Variant Classification | dbSNP RS | HGVSc | HGVSp | HGVSp Short | SWISSPROT | BIOTYPE | SIFT | PolyPhen | Tumor Sample Barcode | Tissue | Histology | Sex | Age | Stage | Therapy Types | Drugs | Outcome |
| TUBGCP4 | SNV | Missense_Mutation | c.1108C>A | p.Gln370Lys | p.Q370K | Q9UGJ1 | protein_coding | tolerated(0.15) | benign(0.27) | TCGA-A8-A07B-01 | Breast | breast invasive carcinoma | Female | >=65 | I/II | Unknown | Unknown | SD | |
| TUBGCP4 | SNV | Missense_Mutation | novel | c.212N>C | p.His71Pro | p.H71P | Q9UGJ1 | protein_coding | tolerated(0.34) | benign(0) | TCGA-A8-A08S-01 | Breast | breast invasive carcinoma | Female | >=65 | I/II | Hormone Therapy | anastrozole | SD |
| TUBGCP4 | SNV | Missense_Mutation | rs748313412 | c.185A>G | p.Tyr62Cys | p.Y62C | Q9UGJ1 | protein_coding | tolerated(0.06) | benign(0.022) | TCGA-A8-A09Z-01 | Breast | breast invasive carcinoma | Female | >=65 | I/II | Unknown | Unknown | SD |
| TUBGCP4 | insertion | Frame_Shift_Ins | novel | c.1125_1126insCCACCTTG | p.Ala376ProfsTer8 | p.A376Pfs*8 | Q9UGJ1 | protein_coding | TCGA-AN-A03X-01 | Breast | breast invasive carcinoma | Female | >=65 | I/II | Unknown | Unknown | SD | ||
| TUBGCP4 | insertion | In_Frame_Ins | novel | c.1127_1128insCTCCCAAAATGCTGGGATTCCCCACTGTCTTTT | p.Ala376_Gln377insSerGlnAsnAlaGlyIleProHisCysLeuPhe | p.A376_Q377insSQNAGIPHCLF | Q9UGJ1 | protein_coding | TCGA-AN-A03X-01 | Breast | breast invasive carcinoma | Female | >=65 | I/II | Unknown | Unknown | SD | ||
| TUBGCP4 | SNV | Missense_Mutation | novel | c.545N>C | p.Val182Ala | p.V182A | Q9UGJ1 | protein_coding | tolerated(0.11) | benign(0.116) | TCGA-2W-A8YY-01 | Cervix | cervical & endocervical cancer | Female | <65 | I/II | Chemotherapy | cisplatin | CR |
| TUBGCP4 | SNV | Missense_Mutation | novel | c.664N>A | p.Glu222Lys | p.E222K | Q9UGJ1 | protein_coding | deleterious(0.02) | benign(0.086) | TCGA-2W-A8YY-01 | Cervix | cervical & endocervical cancer | Female | <65 | I/II | Chemotherapy | cisplatin | CR |
| TUBGCP4 | SNV | Missense_Mutation | rs748017076 | c.1312C>T | p.Arg438Trp | p.R438W | Q9UGJ1 | protein_coding | deleterious(0.01) | possibly_damaging(0.773) | TCGA-5M-AAT5-01 | Colorectum | colon adenocarcinoma | Unknown | Unknown | I/II | Unknown | Unknown | Unknown |
| TUBGCP4 | SNV | Missense_Mutation | novel | c.1622N>C | p.Phe541Ser | p.F541S | Q9UGJ1 | protein_coding | deleterious(0.01) | probably_damaging(0.995) | TCGA-AA-3966-01 | Colorectum | colon adenocarcinoma | Female | >=65 | I/II | Unknown | Unknown | SD |
| TUBGCP4 | SNV | Missense_Mutation | c.174N>A | p.Phe58Leu | p.F58L | Q9UGJ1 | protein_coding | deleterious(0.01) | probably_damaging(0.997) | TCGA-AA-3984-01 | Colorectum | colon adenocarcinoma | Female | <65 | I/II | Unknown | Unknown | SD |
| Page: 1 2 3 4 5 6 |
Top |
Related drugs of malignant transformation related genes |
| Identification of chemicals and drugs interact with genes involved in malignant transfromation |
| (DGIdb 4.0) |
| Entrez ID | Symbol | Category | Interaction Types | Drug Claim Name | Drug Name | PMIDs |
| Page: 1 |

Copyright 2023-Present -The University of Texas Health Science Center at Houston |