
|
|||||
|
 | |
| |
| |
| |
| |
| |
|
Gene: TUBGCP3 |
Gene summary for TUBGCP3 |
| Gene information | Species | Human | Gene symbol | TUBGCP3 | Gene ID | 10426 |
| Gene name | tubulin gamma complex associated protein 3 | |
| Gene Alias | 104p | |
| Cytomap | 13q34 | |
| Gene Type | protein-coding | GO ID | GO:0000003 | UniProtAcc | B4DYP7 |
Top |
Malignant transformation analysis |
| Identification of the aberrant gene expression in precancerous and cancerous lesions by comparing the gene expression of stem-like cells in diseased tissues with normal stem cells |
| Entrez ID | Symbol | Replicates | Species | Organ | Tissue | Adj P-value | Log2FC | Malignancy |
| 10426 | TUBGCP3 | C04 | Human | Oral cavity | OSCC | 1.99e-09 | 5.81e-01 | 0.2633 |
| 10426 | TUBGCP3 | C21 | Human | Oral cavity | OSCC | 3.31e-18 | 5.56e-01 | 0.2678 |
| 10426 | TUBGCP3 | C30 | Human | Oral cavity | OSCC | 2.61e-11 | 6.42e-01 | 0.3055 |
| 10426 | TUBGCP3 | C43 | Human | Oral cavity | OSCC | 1.08e-07 | 1.98e-01 | 0.1704 |
| 10426 | TUBGCP3 | C46 | Human | Oral cavity | OSCC | 3.07e-06 | 2.40e-01 | 0.1673 |
| 10426 | TUBGCP3 | C06 | Human | Oral cavity | OSCC | 1.21e-03 | 6.65e-01 | 0.2699 |
| 10426 | TUBGCP3 | C08 | Human | Oral cavity | OSCC | 3.28e-10 | 2.46e-01 | 0.1919 |
| 10426 | TUBGCP3 | EOLP-1 | Human | Oral cavity | EOLP | 1.87e-04 | 1.72e-01 | -0.0202 |
| 10426 | TUBGCP3 | SYSMH3 | Human | Oral cavity | OSCC | 5.78e-03 | 1.07e-01 | 0.2442 |
| 10426 | TUBGCP3 | SYSMH5 | Human | Oral cavity | OSCC | 4.43e-03 | 6.46e-02 | 0.0647 |
| Page: 1 |
| Tissue | Expression Dynamics | Abbreviation |
| Oral Cavity | 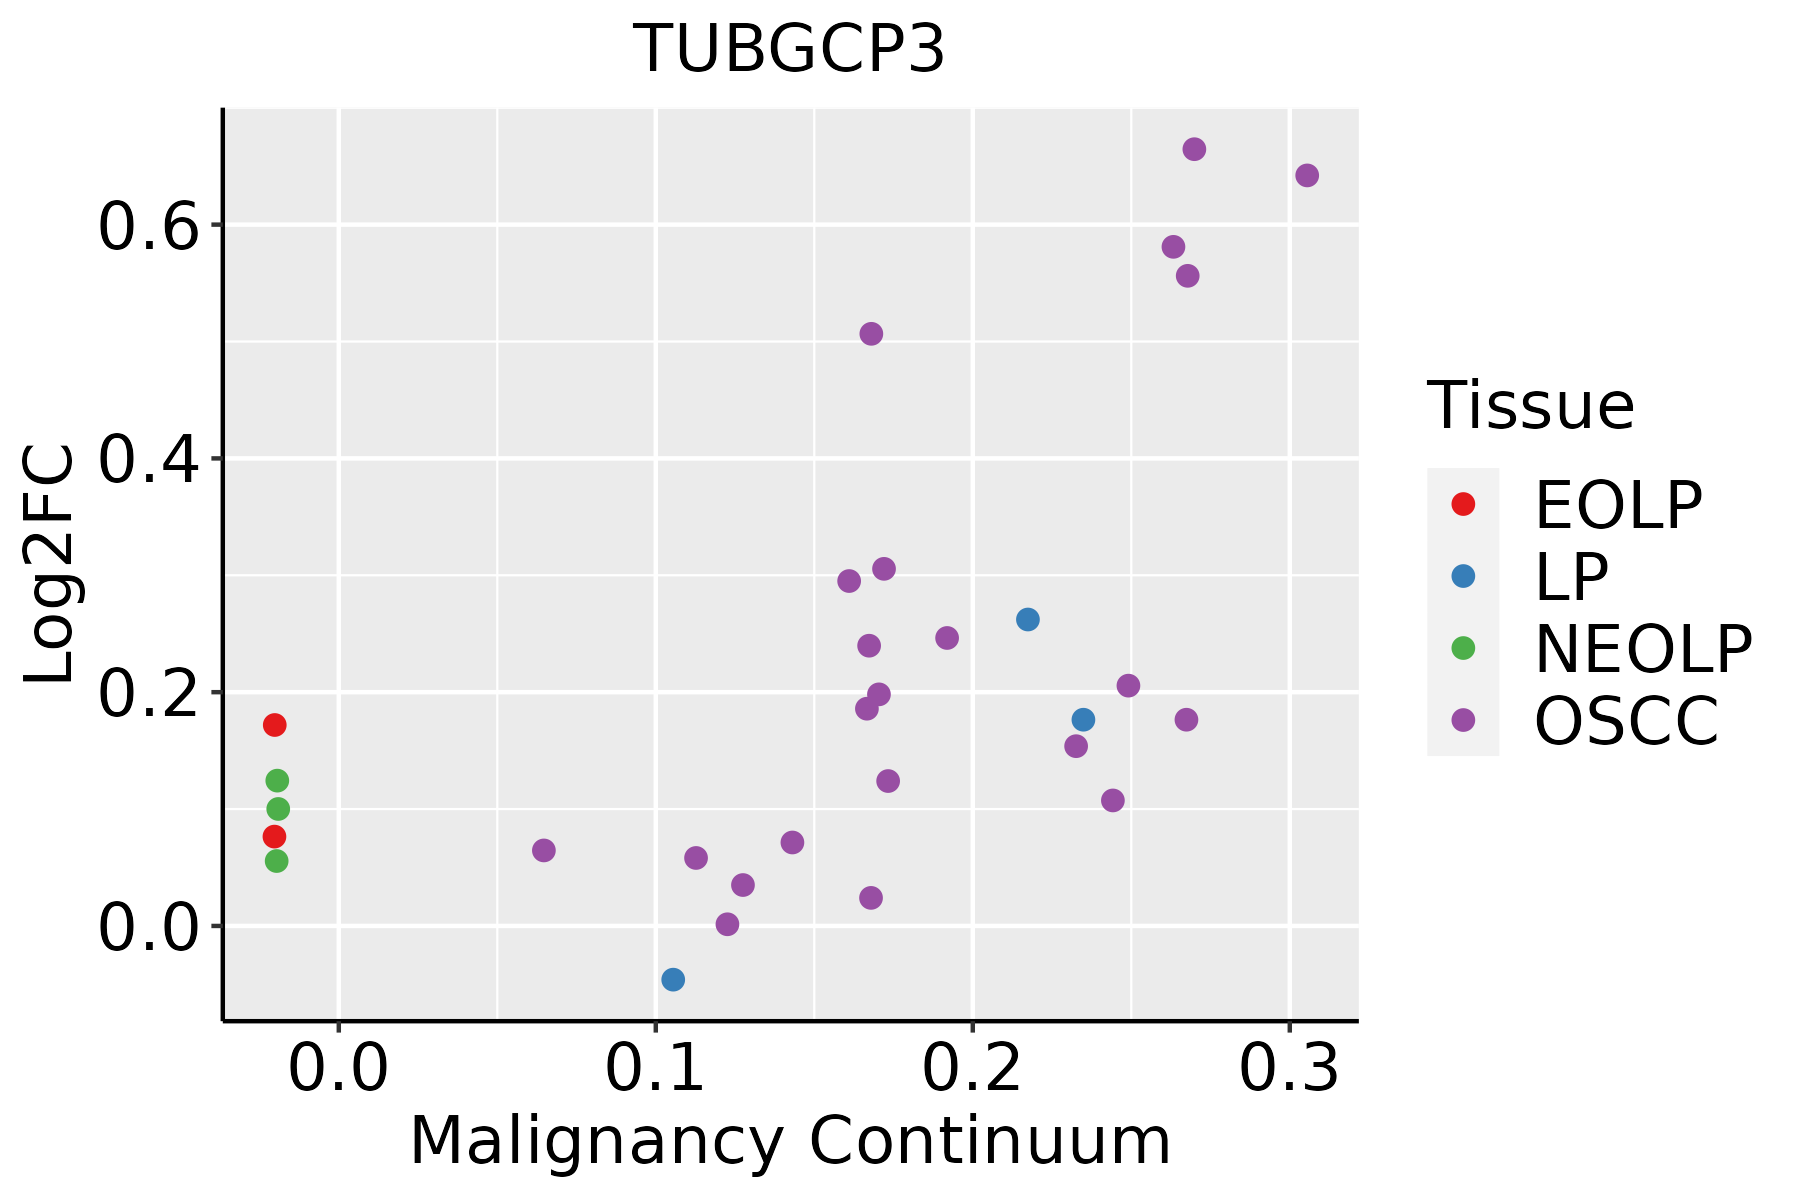 | EOLP: Erosive Oral lichen planus |
| LP: leukoplakia | ||
| NEOLP: Non-erosive oral lichen planus | ||
| OSCC: Oral squamous cell carcinoma |
| ∗log2FC in expression of this searched gene in stem-like cells from each diseased tissue sample relative to stem-like cells in normal samples in each tissue plotted against the malignancy continuum. Samples are colored based on if they are from different disease stage. |
Top |
Malignant transformation related pathway analysis |
| Find out the enriched GO biological processes and KEGG pathways involved in transition from healthy to precancer to cancer |
| Tissue | Disease Stage | Enriched GO biological Processes |
| Colorectum | AD |  |
| Colorectum | SER |  |
| Colorectum | MSS |  |
| Colorectum | MSI-H |  |
| Colorectum | FAP |  |
| ∗Top 15 enriched GO BP terms are showed in the bar plot of each disease state in each tissue. Each row represents a significant GO biological process which is colored according to the -log10(p.adjust). |
| Page: 1 2 3 4 5 6 7 8 9 |
| GO ID | Tissue | Disease Stage | Description | Gene Ratio | Bg Ratio | pvalue | p.adjust | Count |
| GO:00070517 | Oral cavity | OSCC | spindle organization | 117/7305 | 184/18723 | 1.16e-11 | 4.17e-10 | 117 |
| GO:005125820 | Oral cavity | OSCC | protein polymerization | 169/7305 | 297/18723 | 2.57e-10 | 7.17e-09 | 169 |
| GO:00512255 | Oral cavity | OSCC | spindle assembly | 73/7305 | 117/18723 | 2.51e-07 | 3.96e-06 | 73 |
| GO:00070204 | Oral cavity | OSCC | microtubule nucleation | 28/7305 | 35/18723 | 8.71e-07 | 1.19e-05 | 28 |
| GO:00311226 | Oral cavity | OSCC | cytoplasmic microtubule organization | 39/7305 | 56/18723 | 3.29e-06 | 3.93e-05 | 39 |
| GO:00467855 | Oral cavity | OSCC | microtubule polymerization | 53/7305 | 83/18723 | 3.96e-06 | 4.65e-05 | 53 |
| GO:00311093 | Oral cavity | OSCC | microtubule polymerization or depolymerization | 68/7305 | 122/18723 | 1.29e-04 | 9.21e-04 | 68 |
| GO:005125825 | Oral cavity | EOLP | protein polymerization | 74/2218 | 297/18723 | 2.65e-10 | 2.45e-08 | 74 |
| GO:00070202 | Oral cavity | EOLP | microtubule nucleation | 14/2218 | 35/18723 | 2.11e-05 | 3.28e-04 | 14 |
| GO:004678521 | Oral cavity | EOLP | microtubule polymerization | 23/2218 | 83/18723 | 6.67e-05 | 8.27e-04 | 23 |
| GO:003112213 | Oral cavity | EOLP | cytoplasmic microtubule organization | 16/2218 | 56/18723 | 5.70e-04 | 4.82e-03 | 16 |
| GO:00311091 | Oral cavity | EOLP | microtubule polymerization or depolymerization | 26/2218 | 122/18723 | 2.01e-03 | 1.28e-02 | 26 |
| GO:000705121 | Oral cavity | EOLP | spindle organization | 35/2218 | 184/18723 | 3.05e-03 | 1.79e-02 | 35 |
| Page: 1 |
| Pathway ID | Tissue | Disease Stage | Description | Gene Ratio | Bg Ratio | pvalue | p.adjust | qvalue | Count |
| Page: 1 |
Top |
Cell-cell communication analysis |
| Identification of potential cell-cell interactions between two cell types and their ligand-receptor pairs for different disease states |
| Ligand | Receptor | LRpair | Pathway | Tissue | Disease Stage |
| Page: 1 |
Top |
Single-cell gene regulatory network inference analysis |
| Find out the significant the regulons (TFs) and the target genes of each regulon across cell types for different disease states |
| TF | Cell Type | Tissue | Disease Stage | Target Gene | RSS | Regulon Activity |
| ∗The dot plots of a searched regulon are shown for all cell subpopulations in each disease state of each tissue based on the regulon specific score inferred using pySCENIC and by calculating the average expression. |
| Page: 1 |
Top |
Somatic mutation of malignant transformation related genes |
| Annotation of somatic variants for genes involved in malignant transformation |
| Hugo Symbol | Variant Class | Variant Classification | dbSNP RS | HGVSc | HGVSp | HGVSp Short | SWISSPROT | BIOTYPE | SIFT | PolyPhen | Tumor Sample Barcode | Tissue | Histology | Sex | Age | Stage | Therapy Types | Drugs | Outcome |
| TUBGCP3 | SNV | Missense_Mutation | rs767141672 | c.1856N>A | p.Arg619Gln | p.R619Q | Q96CW5 | protein_coding | tolerated(0.14) | benign(0.017) | TCGA-AN-A046-01 | Breast | breast invasive carcinoma | Female | >=65 | I/II | Unknown | Unknown | SD |
| TUBGCP3 | SNV | Missense_Mutation | novel | c.1333N>A | p.Glu445Lys | p.E445K | Q96CW5 | protein_coding | deleterious(0) | probably_damaging(0.987) | TCGA-AN-A046-01 | Breast | breast invasive carcinoma | Female | >=65 | I/II | Unknown | Unknown | SD |
| TUBGCP3 | SNV | Missense_Mutation | rs758583156 | c.469N>A | p.Val157Met | p.V157M | Q96CW5 | protein_coding | tolerated(0.35) | benign(0) | TCGA-AR-A24O-01 | Breast | breast invasive carcinoma | Female | <65 | III/IV | Chemotherapy | cytoxan | PD |
| TUBGCP3 | SNV | Missense_Mutation | c.119N>A | p.Gly40Asp | p.G40D | Q96CW5 | protein_coding | deleterious(0.01) | probably_damaging(0.983) | TCGA-C8-A26Y-01 | Breast | breast invasive carcinoma | Female | >=65 | I/II | Unknown | Unknown | SD | |
| TUBGCP3 | SNV | Missense_Mutation | c.2650G>A | p.Glu884Lys | p.E884K | Q96CW5 | protein_coding | deleterious(0.02) | probably_damaging(0.969) | TCGA-E9-A1RE-01 | Breast | breast invasive carcinoma | Female | >=65 | III/IV | Hormone Therapy | tamoxiphen | SD | |
| TUBGCP3 | insertion | Frame_Shift_Ins | novel | c.1982_1983insCCAGCCCCCACTGGGTGCGGTTTCCAGCAACTCC | p.Arg662GlnfsTer15 | p.R662Qfs*15 | Q96CW5 | protein_coding | TCGA-AN-A04C-01 | Breast | breast invasive carcinoma | Female | <65 | I/II | Unknown | Unknown | SD | ||
| TUBGCP3 | deletion | Frame_Shift_Del | novel | c.340delT | p.Tyr114MetfsTer28 | p.Y114Mfs*28 | Q96CW5 | protein_coding | TCGA-D8-A27V-01 | Breast | breast invasive carcinoma | Female | <65 | I/II | Hormone Therapy | tamoxiphen | SD | ||
| TUBGCP3 | SNV | Missense_Mutation | novel | c.623C>T | p.Thr208Ile | p.T208I | Q96CW5 | protein_coding | tolerated(0.25) | benign(0.011) | TCGA-2W-A8YY-01 | Cervix | cervical & endocervical cancer | Female | <65 | I/II | Chemotherapy | cisplatin | CR |
| TUBGCP3 | SNV | Missense_Mutation | novel | c.424A>G | p.Ser142Gly | p.S142G | Q96CW5 | protein_coding | tolerated(0.37) | benign(0) | TCGA-2W-A8YY-01 | Cervix | cervical & endocervical cancer | Female | <65 | I/II | Chemotherapy | cisplatin | CR |
| TUBGCP3 | SNV | Missense_Mutation | c.2205N>C | p.Trp735Cys | p.W735C | Q96CW5 | protein_coding | tolerated(0.1) | probably_damaging(0.95) | TCGA-C5-A1BQ-01 | Cervix | cervical & endocervical cancer | Female | >=65 | III/IV | Chemotherapy | cisplatin | CR |
| Page: 1 2 3 4 5 6 7 8 9 10 11 |
Top |
Related drugs of malignant transformation related genes |
| Identification of chemicals and drugs interact with genes involved in malignant transfromation |
| (DGIdb 4.0) |
| Entrez ID | Symbol | Category | Interaction Types | Drug Claim Name | Drug Name | PMIDs |
| Page: 1 |

Copyright 2023-Present -The University of Texas Health Science Center at Houston |