
|
|||||
|
 | |
| |
| |
| |
| |
| |
|
Gene: TUBG1 |
Gene summary for TUBG1 |
| Gene information | Species | Human | Gene symbol | TUBG1 | Gene ID | 7283 |
| Gene name | tubulin gamma 1 | |
| Gene Alias | CDCBM4 | |
| Cytomap | 17q21.2 | |
| Gene Type | protein-coding | GO ID | GO:0000003 | UniProtAcc | P23258 |
Top |
Malignant transformation analysis |
| Identification of the aberrant gene expression in precancerous and cancerous lesions by comparing the gene expression of stem-like cells in diseased tissues with normal stem cells |
| Entrez ID | Symbol | Replicates | Species | Organ | Tissue | Adj P-value | Log2FC | Malignancy |
| 7283 | TUBG1 | LZE4T | Human | Esophagus | ESCC | 5.09e-11 | 2.52e-01 | 0.0811 |
| 7283 | TUBG1 | LZE7T | Human | Esophagus | ESCC | 1.64e-12 | 8.67e-01 | 0.0667 |
| 7283 | TUBG1 | LZE8T | Human | Esophagus | ESCC | 1.24e-02 | 2.08e-01 | 0.067 |
| 7283 | TUBG1 | LZE20T | Human | Esophagus | ESCC | 5.24e-03 | 1.18e-01 | 0.0662 |
| 7283 | TUBG1 | LZE24T | Human | Esophagus | ESCC | 2.53e-24 | 7.33e-01 | 0.0596 |
| 7283 | TUBG1 | LZE21T | Human | Esophagus | ESCC | 3.89e-04 | 5.75e-01 | 0.0655 |
| 7283 | TUBG1 | LZE6T | Human | Esophagus | ESCC | 2.45e-15 | 6.83e-01 | 0.0845 |
| 7283 | TUBG1 | P1T-E | Human | Esophagus | ESCC | 7.32e-09 | 4.01e-01 | 0.0875 |
| 7283 | TUBG1 | P2T-E | Human | Esophagus | ESCC | 2.47e-25 | 6.63e-01 | 0.1177 |
| 7283 | TUBG1 | P4T-E | Human | Esophagus | ESCC | 7.55e-31 | 7.74e-01 | 0.1323 |
| 7283 | TUBG1 | P5T-E | Human | Esophagus | ESCC | 3.72e-52 | 1.15e+00 | 0.1327 |
| 7283 | TUBG1 | P8T-E | Human | Esophagus | ESCC | 1.33e-14 | 3.62e-01 | 0.0889 |
| 7283 | TUBG1 | P9T-E | Human | Esophagus | ESCC | 1.15e-16 | 4.75e-01 | 0.1131 |
| 7283 | TUBG1 | P10T-E | Human | Esophagus | ESCC | 5.52e-05 | 2.62e-01 | 0.116 |
| 7283 | TUBG1 | P11T-E | Human | Esophagus | ESCC | 2.85e-17 | 8.65e-01 | 0.1426 |
| 7283 | TUBG1 | P12T-E | Human | Esophagus | ESCC | 8.05e-19 | 4.98e-01 | 0.1122 |
| 7283 | TUBG1 | P15T-E | Human | Esophagus | ESCC | 1.02e-18 | 5.10e-01 | 0.1149 |
| 7283 | TUBG1 | P16T-E | Human | Esophagus | ESCC | 2.60e-14 | 4.80e-01 | 0.1153 |
| 7283 | TUBG1 | P17T-E | Human | Esophagus | ESCC | 2.35e-14 | 7.66e-01 | 0.1278 |
| 7283 | TUBG1 | P19T-E | Human | Esophagus | ESCC | 1.28e-18 | 1.37e+00 | 0.1662 |
| Page: 1 2 3 4 5 6 |
| Tissue | Expression Dynamics | Abbreviation |
| Esophagus | 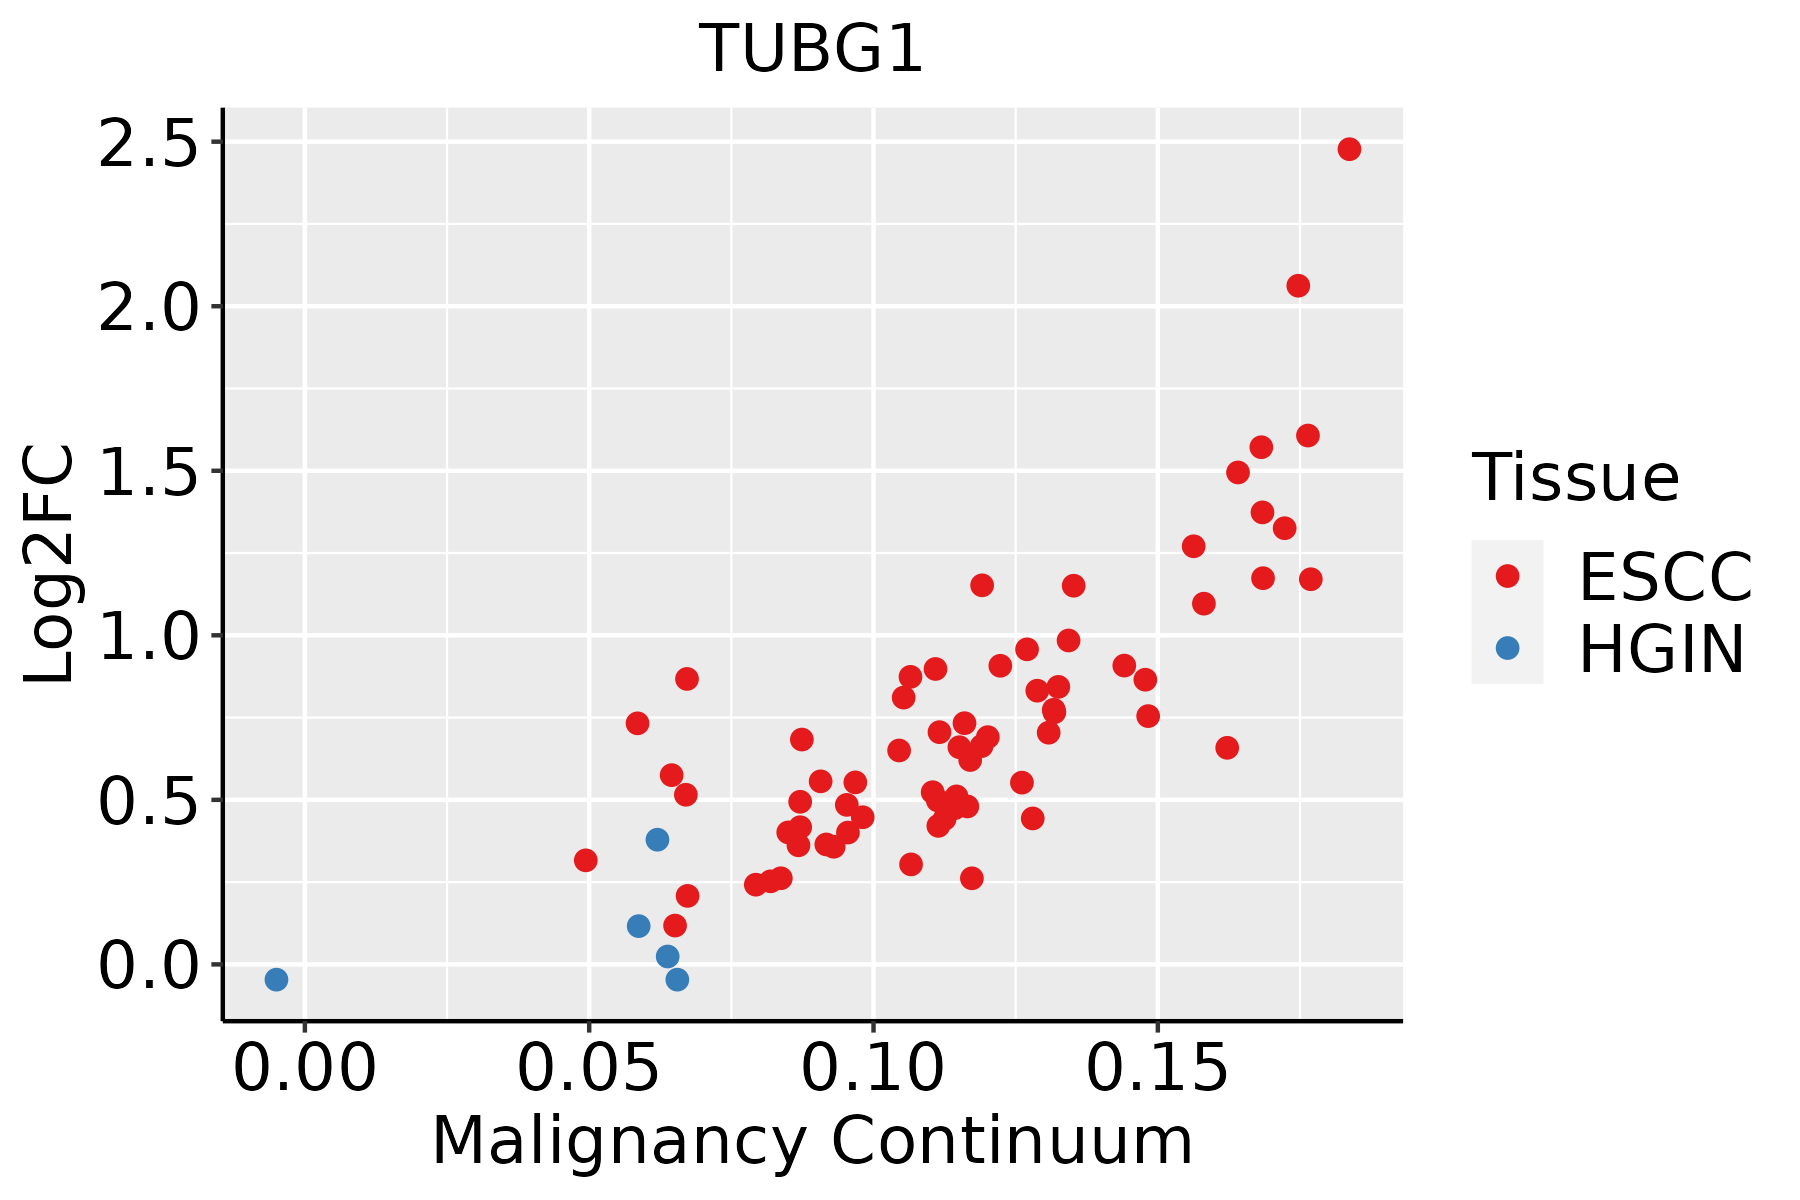 | ESCC: Esophageal squamous cell carcinoma |
| HGIN: High-grade intraepithelial neoplasias | ||
| LGIN: Low-grade intraepithelial neoplasias | ||
| Liver | 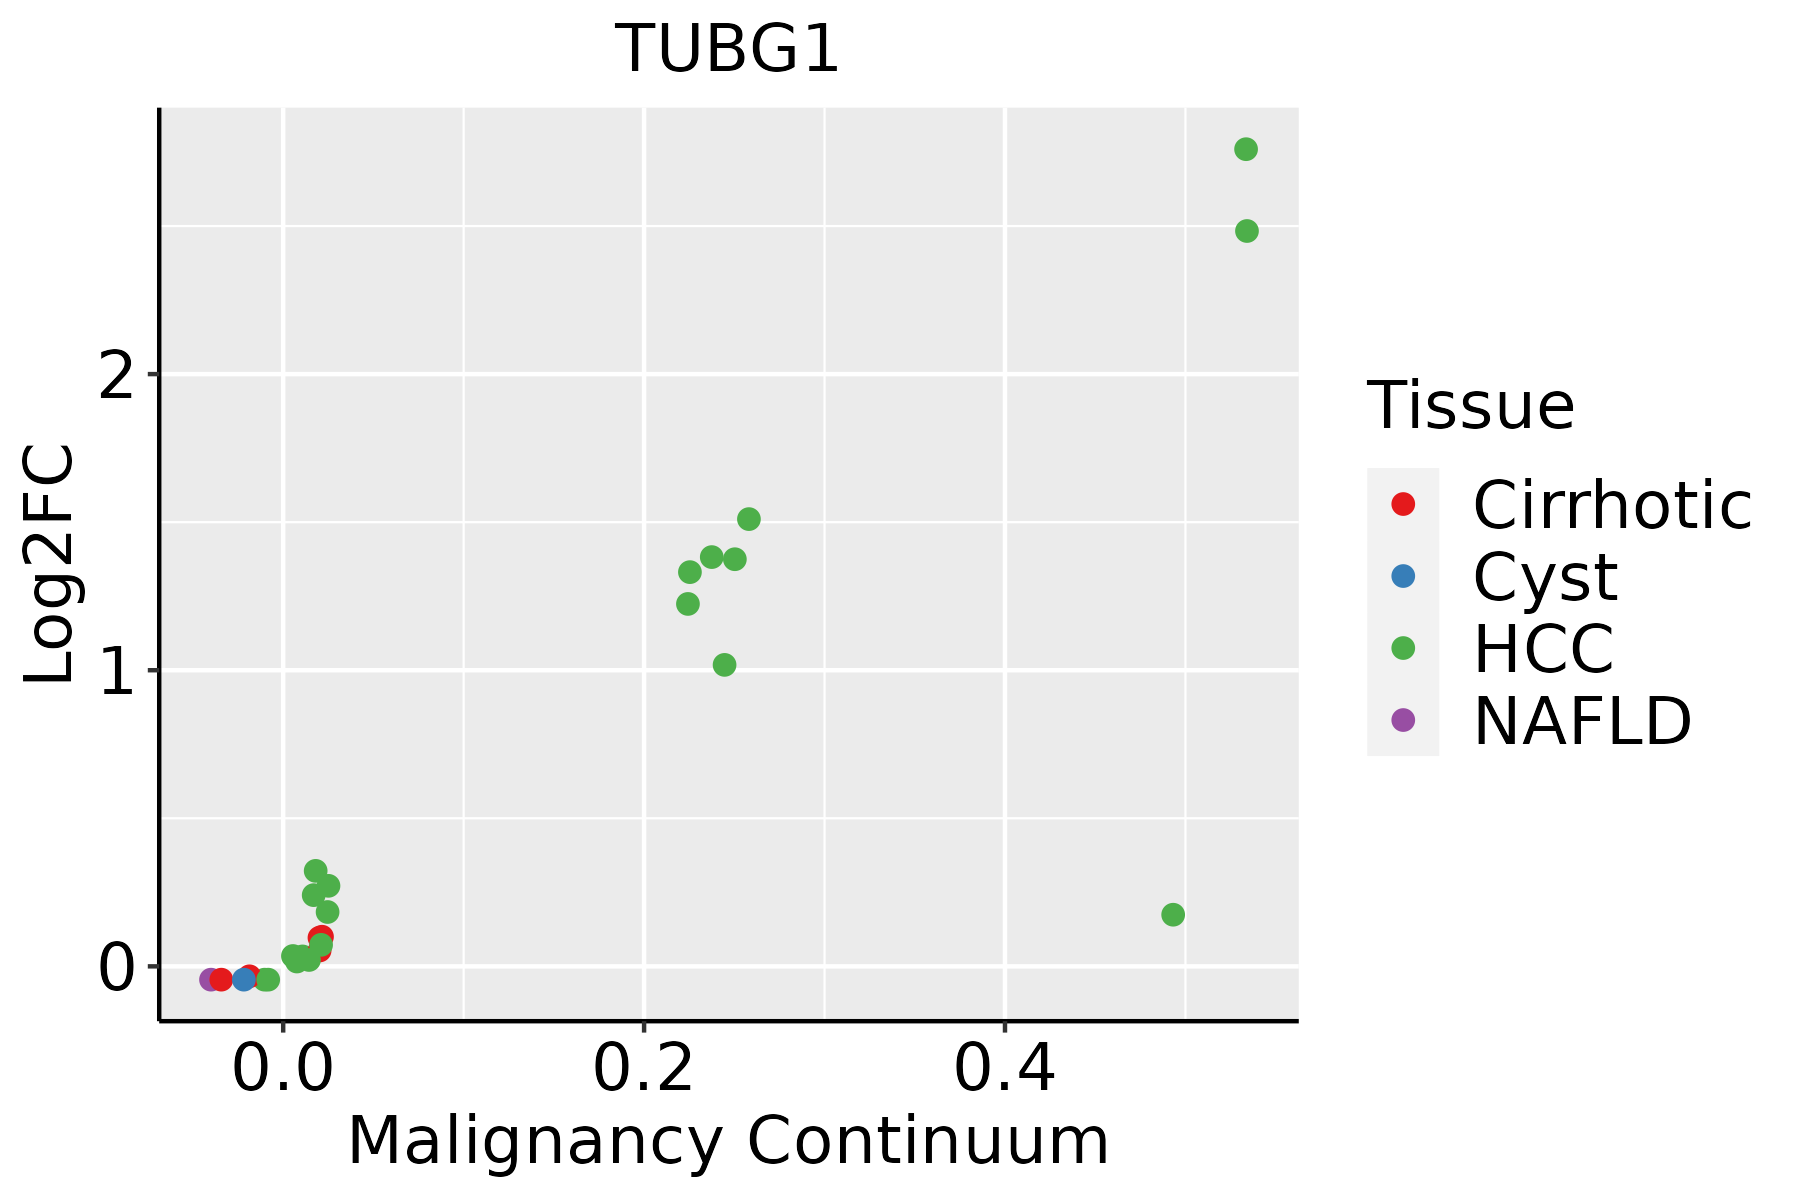 | HCC: Hepatocellular carcinoma |
| NAFLD: Non-alcoholic fatty liver disease | ||
| Oral Cavity | 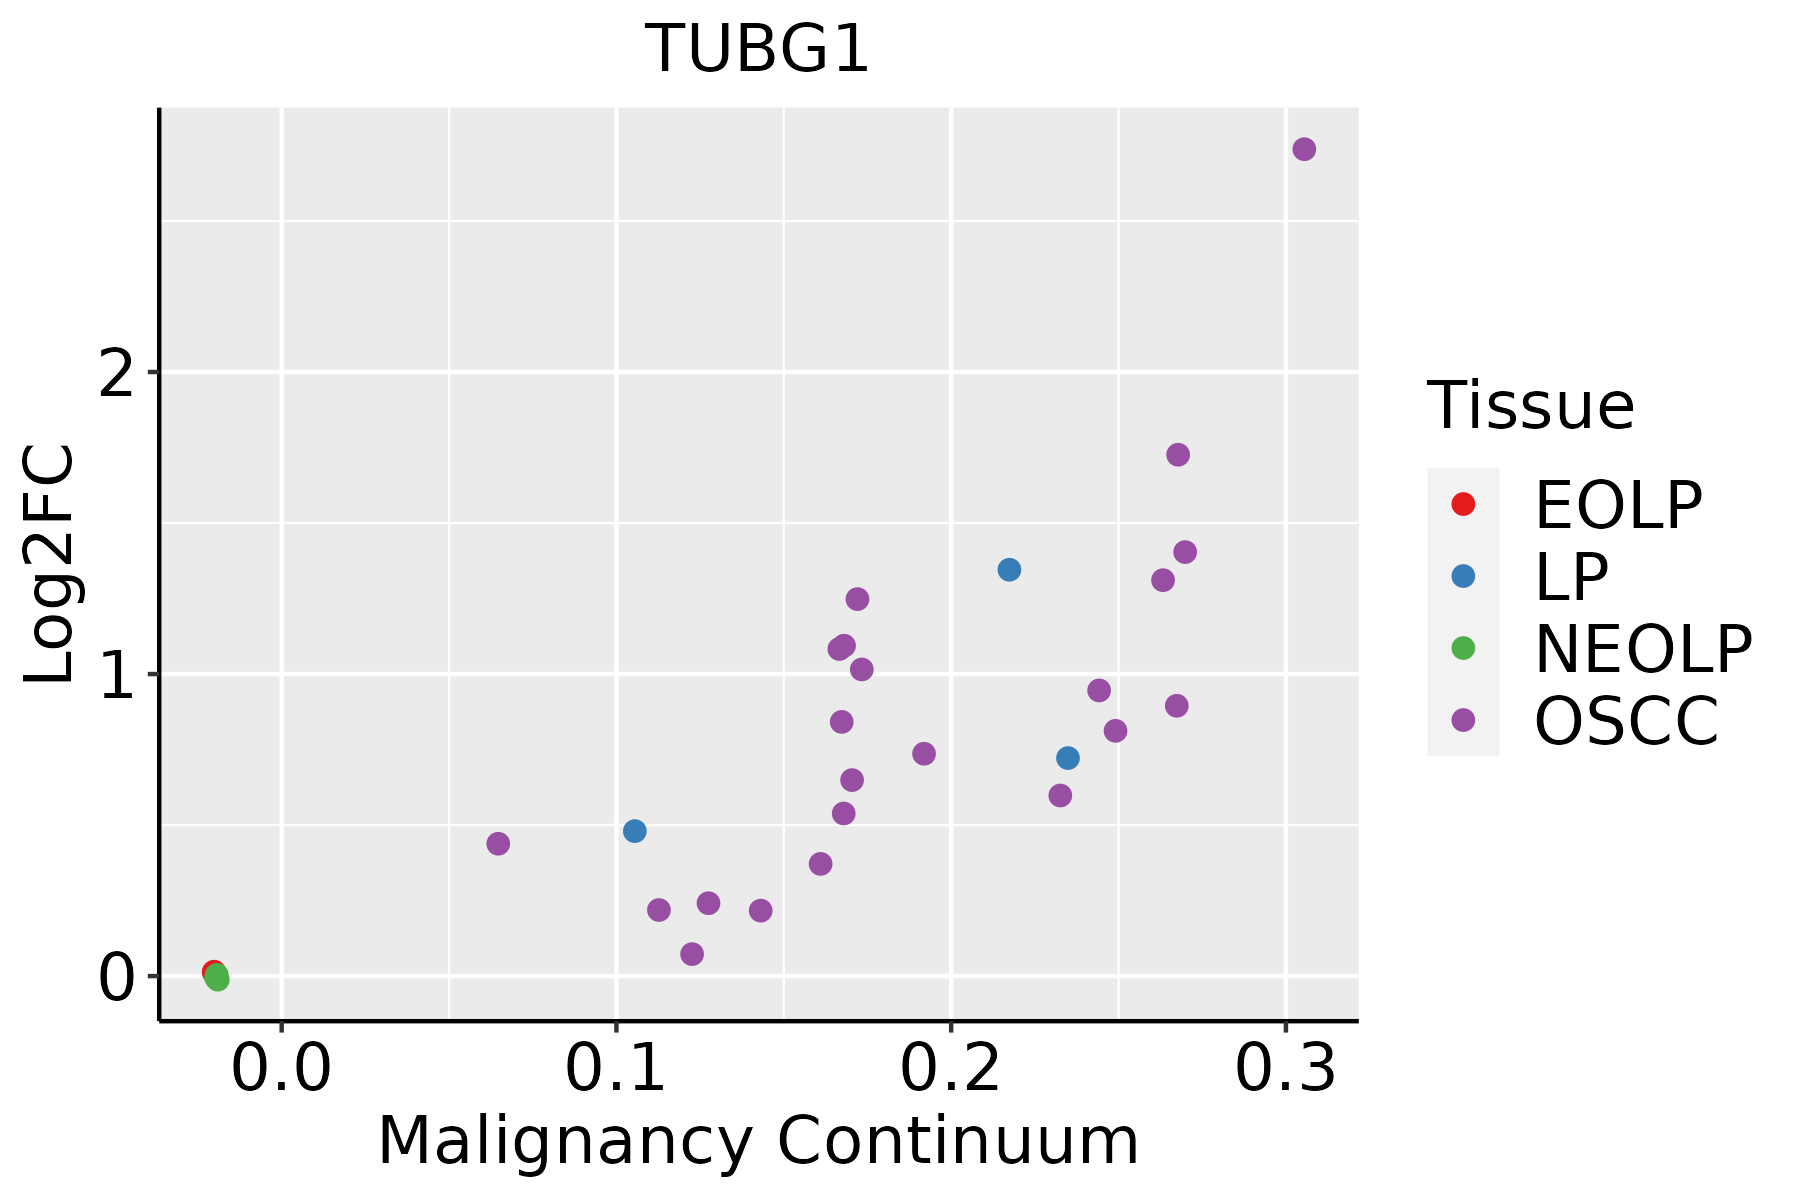 | EOLP: Erosive Oral lichen planus |
| LP: leukoplakia | ||
| NEOLP: Non-erosive oral lichen planus | ||
| OSCC: Oral squamous cell carcinoma | ||
| Skin | 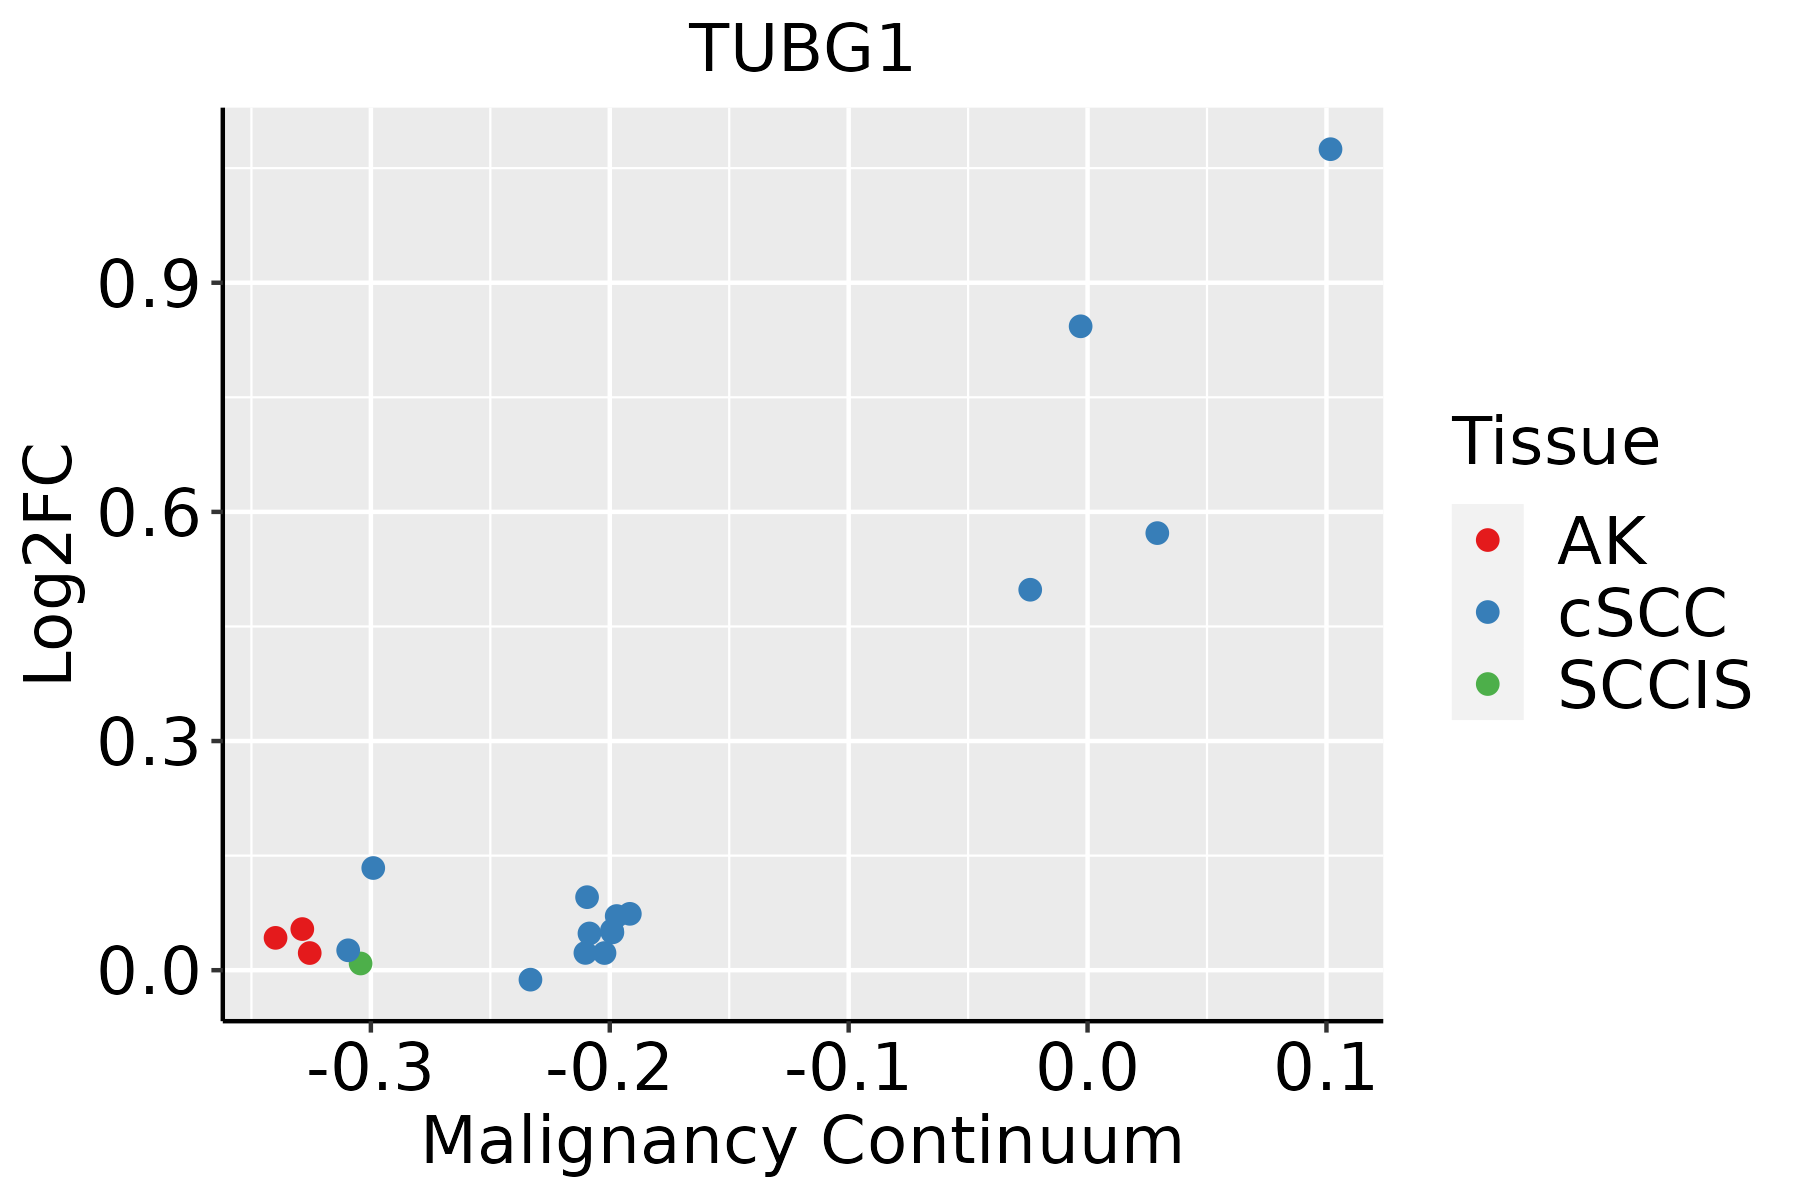 | AK: Actinic keratosis |
| cSCC: Cutaneous squamous cell carcinoma | ||
| SCCIS:squamous cell carcinoma in situ | ||
| Thyroid | 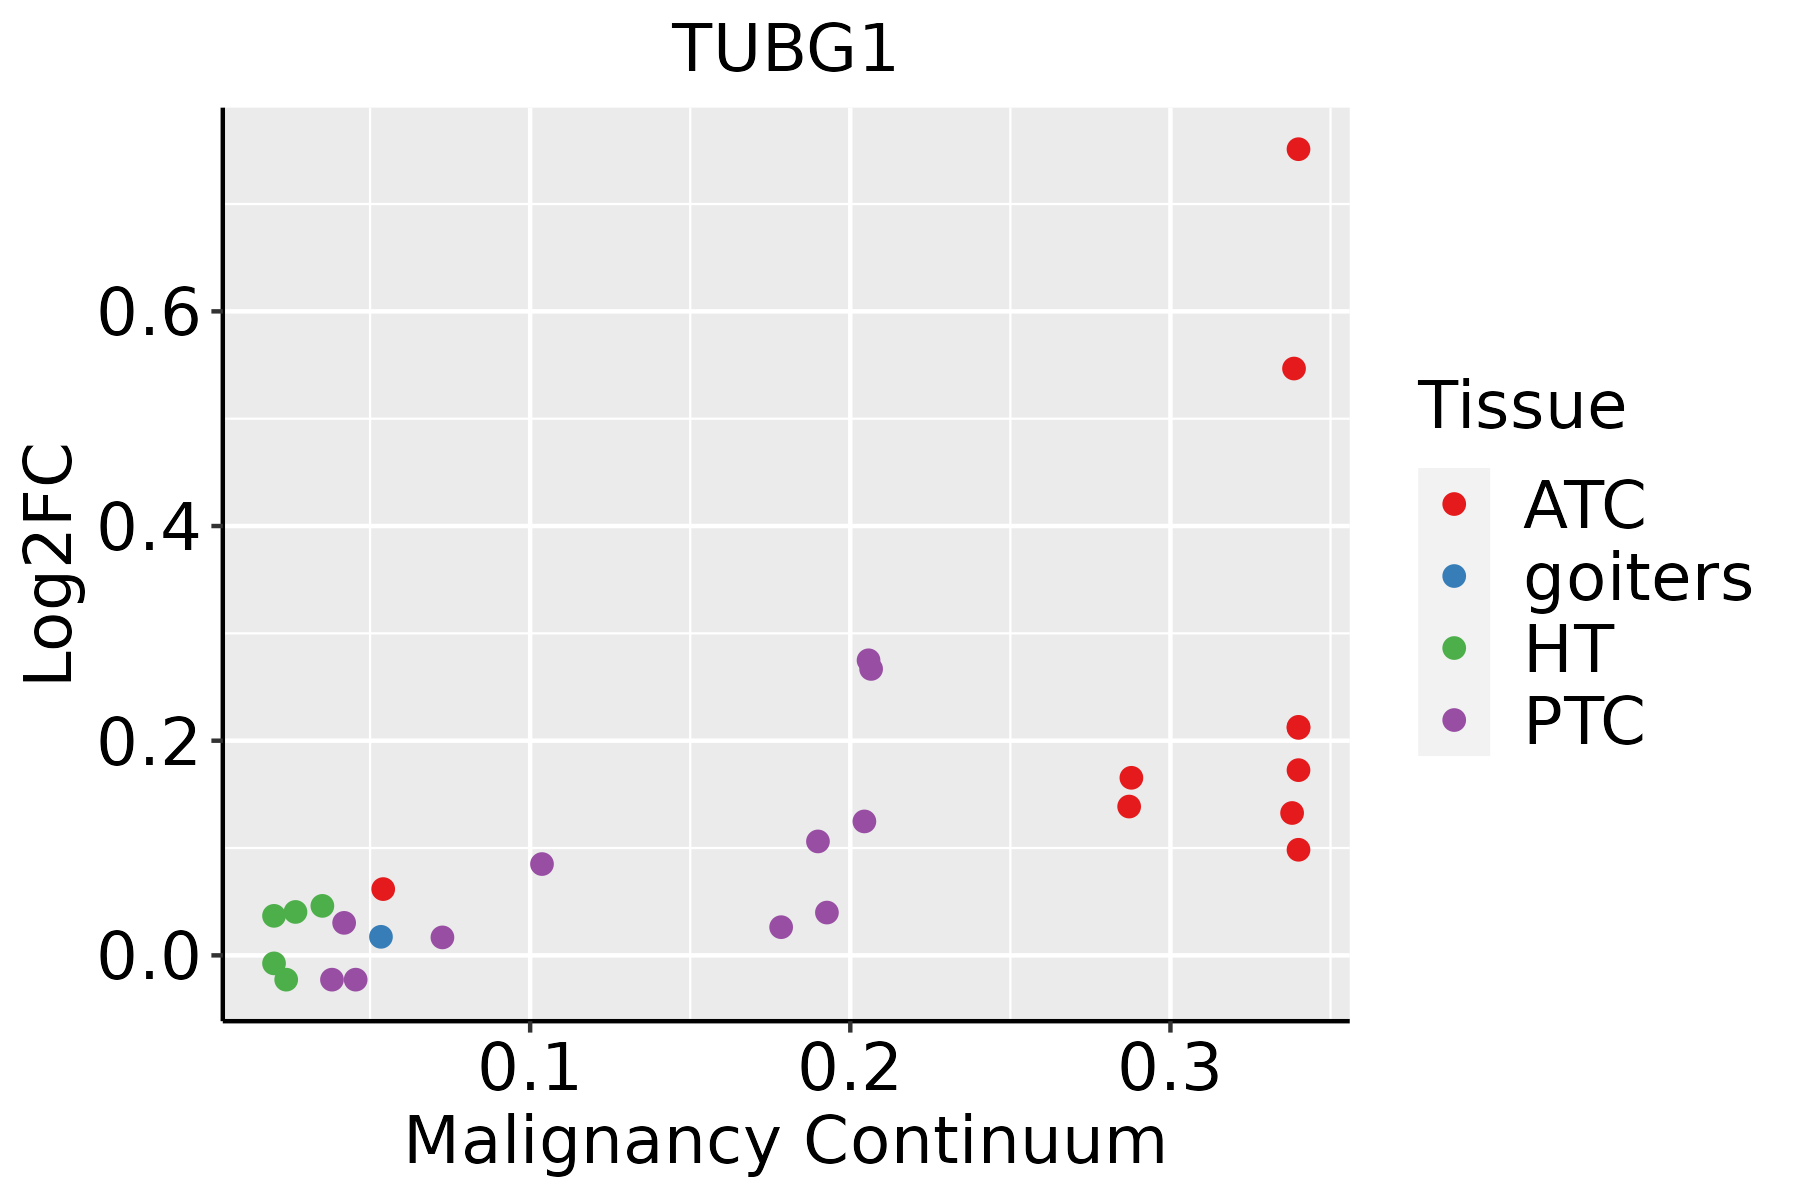 | ATC: Anaplastic thyroid cancer |
| HT: Hashimoto's thyroiditis | ||
| PTC: Papillary thyroid cancer |
| ∗log2FC in expression of this searched gene in stem-like cells from each diseased tissue sample relative to stem-like cells in normal samples in each tissue plotted against the malignancy continuum. Samples are colored based on if they are from different disease stage. |
Top |
Malignant transformation related pathway analysis |
| Find out the enriched GO biological processes and KEGG pathways involved in transition from healthy to precancer to cancer |
| Tissue | Disease Stage | Enriched GO biological Processes |
| Colorectum | AD |  |
| Colorectum | SER |  |
| Colorectum | MSS |  |
| Colorectum | MSI-H |  |
| Colorectum | FAP |  |
| ∗Top 15 enriched GO BP terms are showed in the bar plot of each disease state in each tissue. Each row represents a significant GO biological process which is colored according to the -log10(p.adjust). |
| Page: 1 2 3 4 5 6 7 8 9 |
| GO ID | Tissue | Disease Stage | Description | Gene Ratio | Bg Ratio | pvalue | p.adjust | Count |
| GO:014001414 | Esophagus | ESCC | mitotic nuclear division | 218/8552 | 287/18723 | 6.17e-26 | 1.78e-23 | 218 |
| GO:000007011 | Esophagus | ESCC | mitotic sister chromatid segregation | 138/8552 | 168/18723 | 1.37e-22 | 2.63e-20 | 138 |
| GO:00008194 | Esophagus | ESCC | sister chromatid segregation | 157/8552 | 202/18723 | 8.41e-21 | 1.33e-18 | 157 |
| GO:000705911 | Esophagus | ESCC | chromosome segregation | 238/8552 | 346/18723 | 1.72e-18 | 1.82e-16 | 238 |
| GO:190285015 | Esophagus | ESCC | microtubule cytoskeleton organization involved in mitosis | 116/8552 | 147/18723 | 1.25e-16 | 9.91e-15 | 116 |
| GO:000705214 | Esophagus | ESCC | mitotic spindle organization | 97/8552 | 120/18723 | 2.17e-15 | 1.33e-13 | 97 |
| GO:000705114 | Esophagus | ESCC | spindle organization | 134/8552 | 184/18723 | 5.70e-14 | 2.87e-12 | 134 |
| GO:00482853 | Esophagus | ESCC | organelle fission | 301/8552 | 488/18723 | 4.64e-13 | 2.12e-11 | 301 |
| GO:00988133 | Esophagus | ESCC | nuclear chromosome segregation | 187/8552 | 281/18723 | 1.00e-12 | 4.36e-11 | 187 |
| GO:00002802 | Esophagus | ESCC | nuclear division | 270/8552 | 439/18723 | 1.17e-11 | 4.24e-10 | 270 |
| GO:0051258111 | Esophagus | ESCC | protein polymerization | 183/8552 | 297/18723 | 1.94e-08 | 3.75e-07 | 183 |
| GO:00311094 | Esophagus | ESCC | microtubule polymerization or depolymerization | 77/8552 | 122/18723 | 7.60e-05 | 5.68e-04 | 77 |
| GO:00467856 | Esophagus | ESCC | microtubule polymerization | 55/8552 | 83/18723 | 1.21e-04 | 8.31e-04 | 55 |
| GO:00070205 | Esophagus | ESCC | microtubule nucleation | 27/8552 | 35/18723 | 1.48e-04 | 9.88e-04 | 27 |
| GO:00311227 | Esophagus | ESCC | cytoplasmic microtubule organization | 38/8552 | 56/18723 | 6.60e-04 | 3.50e-03 | 38 |
| GO:005125812 | Liver | Cirrhotic | protein polymerization | 116/4634 | 297/18723 | 2.87e-08 | 9.78e-07 | 116 |
| GO:01400142 | Liver | Cirrhotic | mitotic nuclear division | 97/4634 | 287/18723 | 3.32e-04 | 2.87e-03 | 97 |
| GO:00070522 | Liver | Cirrhotic | mitotic spindle organization | 46/4634 | 120/18723 | 6.56e-04 | 4.98e-03 | 46 |
| GO:19028502 | Liver | Cirrhotic | microtubule cytoskeleton organization involved in mitosis | 52/4634 | 147/18723 | 2.52e-03 | 1.51e-02 | 52 |
| GO:00070514 | Liver | Cirrhotic | spindle organization | 62/4634 | 184/18723 | 3.88e-03 | 2.10e-02 | 62 |
| Page: 1 2 3 4 5 6 |
| Pathway ID | Tissue | Disease Stage | Description | Gene Ratio | Bg Ratio | pvalue | p.adjust | qvalue | Count |
| hsa0516510 | Esophagus | ESCC | Human papillomavirus infection | 215/4205 | 331/8465 | 7.86e-09 | 7.12e-08 | 3.65e-08 | 215 |
| hsa0516515 | Esophagus | ESCC | Human papillomavirus infection | 215/4205 | 331/8465 | 7.86e-09 | 7.12e-08 | 3.65e-08 | 215 |
| hsa05165 | Liver | Cirrhotic | Human papillomavirus infection | 124/2530 | 331/8465 | 1.55e-03 | 7.83e-03 | 4.83e-03 | 124 |
| hsa051651 | Liver | Cirrhotic | Human papillomavirus infection | 124/2530 | 331/8465 | 1.55e-03 | 7.83e-03 | 4.83e-03 | 124 |
| hsa051652 | Liver | HCC | Human papillomavirus infection | 188/4020 | 331/8465 | 3.34e-04 | 1.49e-03 | 8.29e-04 | 188 |
| hsa051653 | Liver | HCC | Human papillomavirus infection | 188/4020 | 331/8465 | 3.34e-04 | 1.49e-03 | 8.29e-04 | 188 |
| hsa051659 | Oral cavity | OSCC | Human papillomavirus infection | 200/3704 | 331/8465 | 3.83e-10 | 4.93e-09 | 2.51e-09 | 200 |
| hsa0516514 | Oral cavity | OSCC | Human papillomavirus infection | 200/3704 | 331/8465 | 3.83e-10 | 4.93e-09 | 2.51e-09 | 200 |
| hsa0516523 | Oral cavity | LP | Human papillomavirus infection | 121/2418 | 331/8465 | 8.00e-04 | 3.86e-03 | 2.49e-03 | 121 |
| hsa0516533 | Oral cavity | LP | Human papillomavirus infection | 121/2418 | 331/8465 | 8.00e-04 | 3.86e-03 | 2.49e-03 | 121 |
| Page: 1 |
Top |
Cell-cell communication analysis |
| Identification of potential cell-cell interactions between two cell types and their ligand-receptor pairs for different disease states |
| Ligand | Receptor | LRpair | Pathway | Tissue | Disease Stage |
| Page: 1 |
Top |
Single-cell gene regulatory network inference analysis |
| Find out the significant the regulons (TFs) and the target genes of each regulon across cell types for different disease states |
| TF | Cell Type | Tissue | Disease Stage | Target Gene | RSS | Regulon Activity |
| ∗The dot plots of a searched regulon are shown for all cell subpopulations in each disease state of each tissue based on the regulon specific score inferred using pySCENIC and by calculating the average expression. |
| Page: 1 |
Top |
Somatic mutation of malignant transformation related genes |
| Annotation of somatic variants for genes involved in malignant transformation |
| Hugo Symbol | Variant Class | Variant Classification | dbSNP RS | HGVSc | HGVSp | HGVSp Short | SWISSPROT | BIOTYPE | SIFT | PolyPhen | Tumor Sample Barcode | Tissue | Histology | Sex | Age | Stage | Therapy Types | Drugs | Outcome |
| TUBG1 | SNV | Missense_Mutation | c.650G>T | p.Arg217Leu | p.R217L | P23258 | protein_coding | deleterious(0.03) | possibly_damaging(0.633) | TCGA-A8-A0A9-01 | Breast | breast invasive carcinoma | Female | >=65 | I/II | Hormone Therapy | anastrozole | SD | |
| TUBG1 | SNV | Missense_Mutation | c.127N>A | p.Glu43Lys | p.E43K | P23258 | protein_coding | tolerated(0.24) | benign(0.077) | TCGA-D8-A1Y2-01 | Breast | breast invasive carcinoma | Female | >=65 | I/II | Hormone Therapy | tamoxiphen | SD | |
| TUBG1 | SNV | Missense_Mutation | novel | c.1255N>C | p.Asp419His | p.D419H | P23258 | protein_coding | deleterious(0.04) | benign(0.269) | TCGA-EA-A3HU-01 | Cervix | cervical & endocervical cancer | Female | <65 | I/II | Unknown | Unknown | SD |
| TUBG1 | SNV | Missense_Mutation | rs777881464 | c.731N>A | p.Arg244His | p.R244H | P23258 | protein_coding | deleterious(0) | probably_damaging(0.964) | TCGA-EK-A2RO-01 | Cervix | cervical & endocervical cancer | Female | <65 | I/II | Unknown | Unknown | SD |
| TUBG1 | SNV | Missense_Mutation | c.1260G>C | p.Glu420Asp | p.E420D | P23258 | protein_coding | deleterious(0.02) | probably_damaging(0.988) | TCGA-IR-A3LK-01 | Cervix | cervical & endocervical cancer | Female | >=65 | I/II | Chemotherapy | cisplatin | PD | |
| TUBG1 | SNV | Missense_Mutation | novel | c.1291C>T | p.Leu431Phe | p.L431F | P23258 | protein_coding | deleterious(0) | probably_damaging(0.947) | TCGA-MA-AA42-01 | Cervix | cervical & endocervical cancer | Female | >=65 | I/II | Unknown | Unknown | SD |
| TUBG1 | SNV | Missense_Mutation | rs756401278 | c.1178N>A | p.Arg393His | p.R393H | P23258 | protein_coding | tolerated(0.14) | benign(0.003) | TCGA-AA-3864-01 | Colorectum | colon adenocarcinoma | Male | >=65 | I/II | Unknown | Unknown | SD |
| TUBG1 | SNV | Missense_Mutation | c.1263G>T | p.Met421Ile | p.M421I | P23258 | protein_coding | deleterious(0.01) | benign(0) | TCGA-CK-5913-01 | Colorectum | colon adenocarcinoma | Female | <65 | I/II | Unknown | Unknown | SD | |
| TUBG1 | SNV | Missense_Mutation | c.650N>A | p.Arg217His | p.R217H | P23258 | protein_coding | tolerated(0.08) | possibly_damaging(0.824) | TCGA-G4-6304-01 | Colorectum | colon adenocarcinoma | Female | >=65 | I/II | Chemotherapy | fluorouracil | PD | |
| TUBG1 | SNV | Missense_Mutation | c.675N>A | p.Phe225Leu | p.F225L | P23258 | protein_coding | tolerated(0.05) | benign(0.019) | TCGA-AP-A059-01 | Endometrium | uterine corpus endometrioid carcinoma | Female | >=65 | I/II | Unknown | Unknown | SD |
| Page: 1 2 3 4 5 |
Top |
Related drugs of malignant transformation related genes |
| Identification of chemicals and drugs interact with genes involved in malignant transfromation |
| (DGIdb 4.0) |
| Entrez ID | Symbol | Category | Interaction Types | Drug Claim Name | Drug Name | PMIDs |
| Page: 1 |

Copyright 2023-Present -The University of Texas Health Science Center at Houston |