
|
|||||
|
 | |
| |
| |
| |
| |
| |
|
Gene: TUBD1 |
Gene summary for TUBD1 |
| Gene information | Species | Human | Gene symbol | TUBD1 | Gene ID | 51174 |
| Gene name | tubulin delta 1 | |
| Gene Alias | TUBD | |
| Cytomap | 17q23.1 | |
| Gene Type | protein-coding | GO ID | GO:0000226 | UniProtAcc | Q9UJT1 |
Top |
Malignant transformation analysis |
| Identification of the aberrant gene expression in precancerous and cancerous lesions by comparing the gene expression of stem-like cells in diseased tissues with normal stem cells |
| Entrez ID | Symbol | Replicates | Species | Organ | Tissue | Adj P-value | Log2FC | Malignancy |
| 51174 | TUBD1 | LZE4T | Human | Esophagus | ESCC | 4.09e-04 | 1.15e-01 | 0.0811 |
| 51174 | TUBD1 | LZE24T | Human | Esophagus | ESCC | 3.53e-12 | 4.33e-01 | 0.0596 |
| 51174 | TUBD1 | P1T-E | Human | Esophagus | ESCC | 1.55e-05 | 2.20e-01 | 0.0875 |
| 51174 | TUBD1 | P2T-E | Human | Esophagus | ESCC | 3.75e-15 | 2.44e-01 | 0.1177 |
| 51174 | TUBD1 | P4T-E | Human | Esophagus | ESCC | 3.92e-06 | 1.13e-01 | 0.1323 |
| 51174 | TUBD1 | P8T-E | Human | Esophagus | ESCC | 7.78e-17 | 3.31e-01 | 0.0889 |
| 51174 | TUBD1 | P9T-E | Human | Esophagus | ESCC | 1.35e-08 | 8.52e-02 | 0.1131 |
| 51174 | TUBD1 | P10T-E | Human | Esophagus | ESCC | 6.94e-09 | 1.98e-01 | 0.116 |
| 51174 | TUBD1 | P12T-E | Human | Esophagus | ESCC | 1.13e-12 | 2.69e-01 | 0.1122 |
| 51174 | TUBD1 | P15T-E | Human | Esophagus | ESCC | 1.32e-07 | 2.01e-01 | 0.1149 |
| 51174 | TUBD1 | P16T-E | Human | Esophagus | ESCC | 2.73e-10 | 1.94e-01 | 0.1153 |
| 51174 | TUBD1 | P20T-E | Human | Esophagus | ESCC | 1.41e-07 | 1.57e-01 | 0.1124 |
| 51174 | TUBD1 | P21T-E | Human | Esophagus | ESCC | 1.64e-11 | 1.59e-01 | 0.1617 |
| 51174 | TUBD1 | P22T-E | Human | Esophagus | ESCC | 1.10e-09 | 1.21e-01 | 0.1236 |
| 51174 | TUBD1 | P23T-E | Human | Esophagus | ESCC | 5.47e-17 | 4.86e-01 | 0.108 |
| 51174 | TUBD1 | P24T-E | Human | Esophagus | ESCC | 2.52e-07 | 9.57e-02 | 0.1287 |
| 51174 | TUBD1 | P26T-E | Human | Esophagus | ESCC | 1.12e-18 | 2.98e-01 | 0.1276 |
| 51174 | TUBD1 | P27T-E | Human | Esophagus | ESCC | 2.34e-10 | 1.84e-01 | 0.1055 |
| 51174 | TUBD1 | P28T-E | Human | Esophagus | ESCC | 1.15e-04 | 9.84e-02 | 0.1149 |
| 51174 | TUBD1 | P31T-E | Human | Esophagus | ESCC | 6.17e-12 | 2.15e-01 | 0.1251 |
| Page: 1 2 3 4 |
| Tissue | Expression Dynamics | Abbreviation |
| Esophagus |  | ESCC: Esophageal squamous cell carcinoma |
| HGIN: High-grade intraepithelial neoplasias | ||
| LGIN: Low-grade intraepithelial neoplasias | ||
| Liver |  | HCC: Hepatocellular carcinoma |
| NAFLD: Non-alcoholic fatty liver disease | ||
| Oral Cavity | 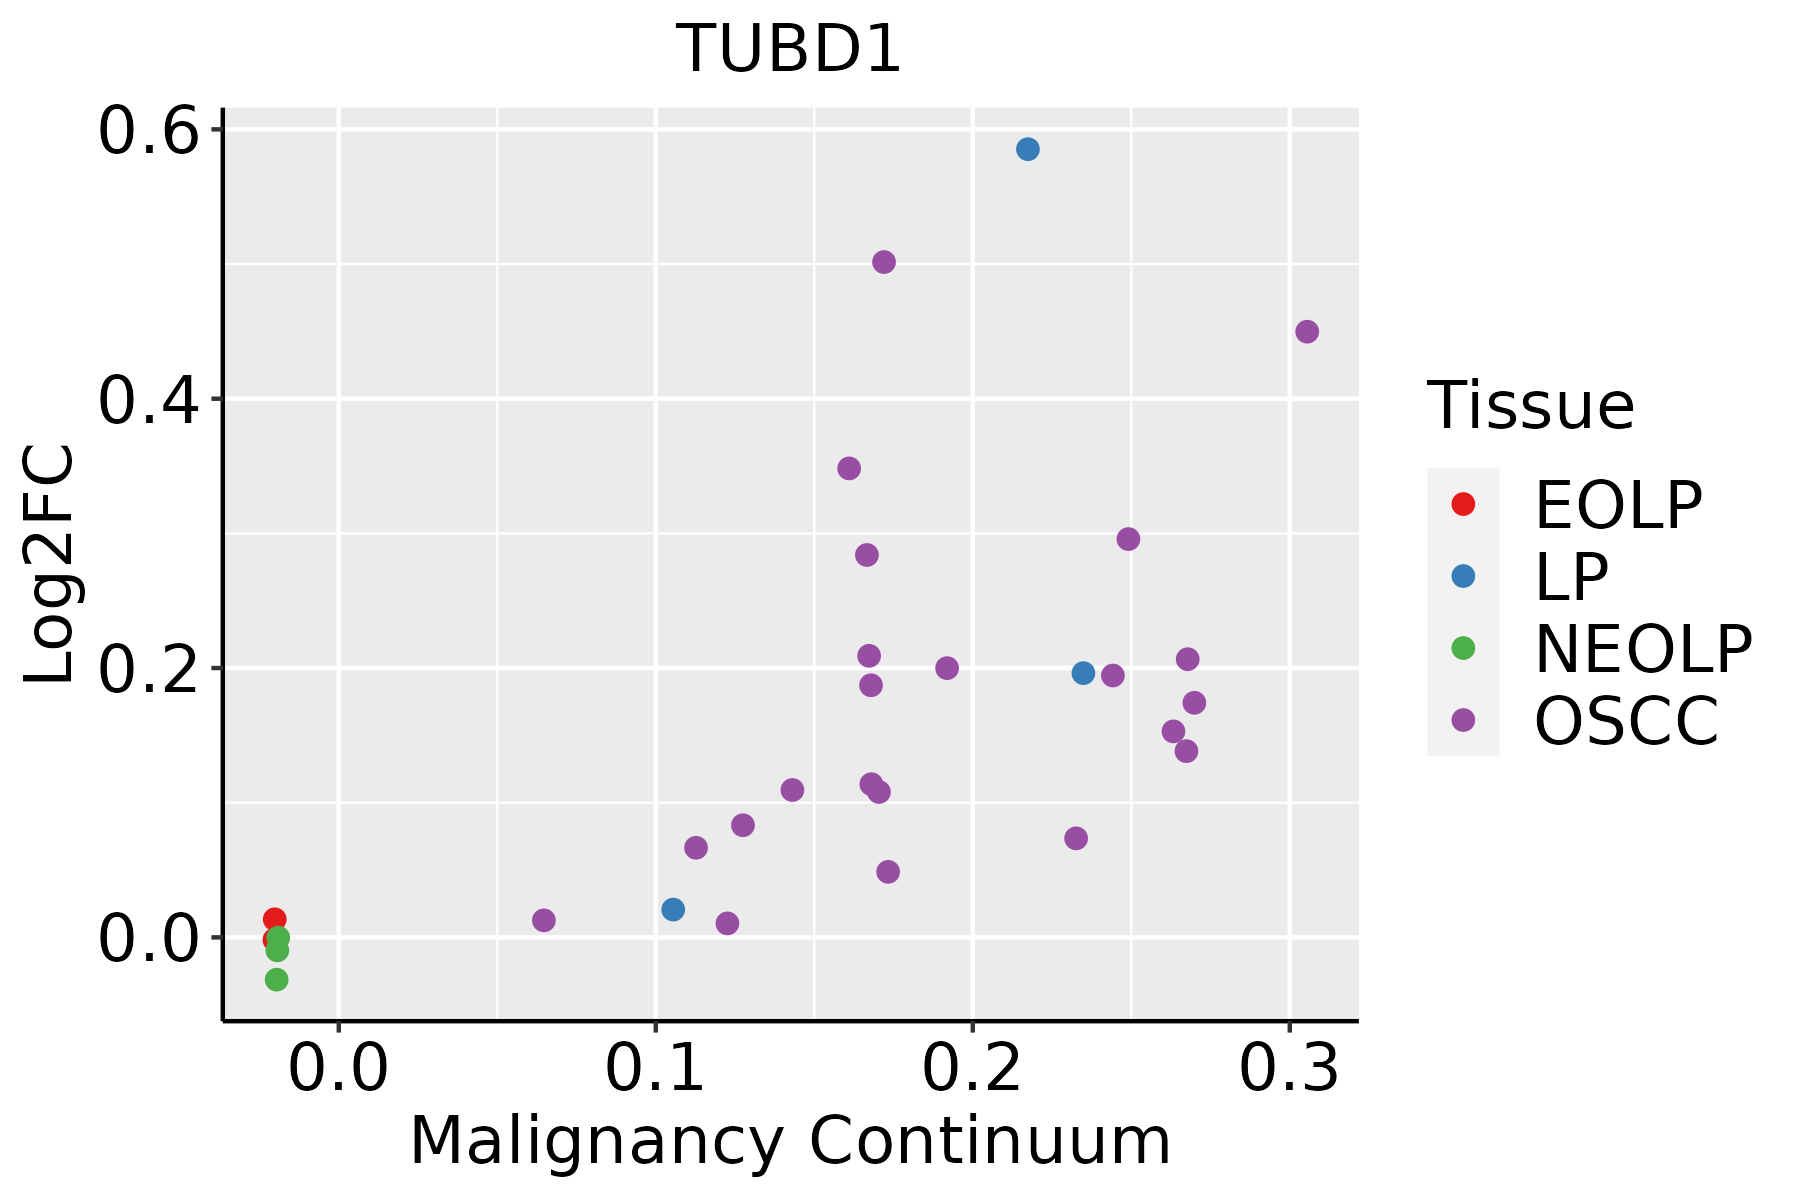 | EOLP: Erosive Oral lichen planus |
| LP: leukoplakia | ||
| NEOLP: Non-erosive oral lichen planus | ||
| OSCC: Oral squamous cell carcinoma |
| ∗log2FC in expression of this searched gene in stem-like cells from each diseased tissue sample relative to stem-like cells in normal samples in each tissue plotted against the malignancy continuum. Samples are colored based on if they are from different disease stage. |
Top |
Malignant transformation related pathway analysis |
| Find out the enriched GO biological processes and KEGG pathways involved in transition from healthy to precancer to cancer |
| Tissue | Disease Stage | Enriched GO biological Processes |
| Colorectum | AD |  |
| Colorectum | SER |  |
| Colorectum | MSS |  |
| Colorectum | MSI-H |  |
| Colorectum | FAP |  |
| ∗Top 15 enriched GO BP terms are showed in the bar plot of each disease state in each tissue. Each row represents a significant GO biological process which is colored according to the -log10(p.adjust). |
| Page: 1 2 3 4 5 6 7 8 9 |
| GO ID | Tissue | Disease Stage | Description | Gene Ratio | Bg Ratio | pvalue | p.adjust | Count |
| Page: 1 |
| Pathway ID | Tissue | Disease Stage | Description | Gene Ratio | Bg Ratio | pvalue | p.adjust | qvalue | Count |
| Page: 1 |
Top |
Cell-cell communication analysis |
| Identification of potential cell-cell interactions between two cell types and their ligand-receptor pairs for different disease states |
| Ligand | Receptor | LRpair | Pathway | Tissue | Disease Stage |
| Page: 1 |
Top |
Single-cell gene regulatory network inference analysis |
| Find out the significant the regulons (TFs) and the target genes of each regulon across cell types for different disease states |
| TF | Cell Type | Tissue | Disease Stage | Target Gene | RSS | Regulon Activity |
| ∗The dot plots of a searched regulon are shown for all cell subpopulations in each disease state of each tissue based on the regulon specific score inferred using pySCENIC and by calculating the average expression. |
| Page: 1 |
Top |
Somatic mutation of malignant transformation related genes |
| Annotation of somatic variants for genes involved in malignant transformation |
| Hugo Symbol | Variant Class | Variant Classification | dbSNP RS | HGVSc | HGVSp | HGVSp Short | SWISSPROT | BIOTYPE | SIFT | PolyPhen | Tumor Sample Barcode | Tissue | Histology | Sex | Age | Stage | Therapy Types | Drugs | Outcome |
| TUBD1 | SNV | Missense_Mutation | novel | c.1276N>A | p.Tyr426Asn | p.Y426N | Q9UJT1 | protein_coding | deleterious(0) | probably_damaging(0.999) | TCGA-AC-A23H-01 | Breast | breast invasive carcinoma | Female | >=65 | I/II | Unknown | Unknown | PD |
| TUBD1 | SNV | Missense_Mutation | c.331N>T | p.His111Tyr | p.H111Y | Q9UJT1 | protein_coding | deleterious(0) | benign(0.14) | TCGA-AC-A23H-01 | Breast | breast invasive carcinoma | Female | >=65 | I/II | Unknown | Unknown | PD | |
| TUBD1 | SNV | Missense_Mutation | c.338C>T | p.Pro113Leu | p.P113L | Q9UJT1 | protein_coding | deleterious(0) | possibly_damaging(0.463) | TCGA-BH-A0DE-01 | Breast | breast invasive carcinoma | Female | <65 | I/II | Unknown | Unknown | SD | |
| TUBD1 | SNV | Missense_Mutation | c.110G>C | p.Arg37Thr | p.R37T | Q9UJT1 | protein_coding | deleterious(0.02) | benign(0.015) | TCGA-BH-A0HP-01 | Breast | breast invasive carcinoma | Female | >=65 | III/IV | Chemotherapy | doxorubicin | SD | |
| TUBD1 | SNV | Missense_Mutation | rs762961361 | c.370N>T | p.Arg124Trp | p.R124W | Q9UJT1 | protein_coding | deleterious(0) | probably_damaging(0.995) | TCGA-BH-A18G-01 | Breast | breast invasive carcinoma | Female | >=65 | I/II | Unknown | Unknown | SD |
| TUBD1 | SNV | Missense_Mutation | novel | c.488N>T | p.Ser163Leu | p.S163L | Q9UJT1 | protein_coding | deleterious(0) | benign(0.102) | TCGA-LD-A74U-01 | Breast | breast invasive carcinoma | Female | >=65 | III/IV | Chemotherapy | taxotere | SD |
| TUBD1 | insertion | Nonsense_Mutation | novel | c.1265_1266insAAAGTAAATAGGTAAATGTGTACTTAGTGTGCTTTT | p.Tyr422delinsTer | p.Y422delins* | Q9UJT1 | protein_coding | TCGA-A8-A06X-01 | Breast | breast invasive carcinoma | Female | >=65 | I/II | Unknown | Unknown | SD | ||
| TUBD1 | insertion | Frame_Shift_Ins | novel | c.256_257insCA | p.Trp86SerfsTer35 | p.W86Sfs*35 | Q9UJT1 | protein_coding | TCGA-AR-A0U0-01 | Breast | breast invasive carcinoma | Female | >=65 | I/II | Unknown | Unknown | SD | ||
| TUBD1 | insertion | In_Frame_Ins | novel | c.255_256insAGAACC | p.Gln85_Trp86insArgThr | p.Q85_W86insRT | Q9UJT1 | protein_coding | TCGA-AR-A0U0-01 | Breast | breast invasive carcinoma | Female | >=65 | I/II | Unknown | Unknown | SD | ||
| TUBD1 | SNV | Missense_Mutation | novel | c.410N>C | p.Phe137Ser | p.F137S | Q9UJT1 | protein_coding | tolerated(0.08) | benign(0.056) | TCGA-C5-A8YT-01 | Cervix | cervical & endocervical cancer | Female | <65 | I/II | Chemotherapy | cisplatin | PD |
| Page: 1 2 3 4 5 |
Top |
Related drugs of malignant transformation related genes |
| Identification of chemicals and drugs interact with genes involved in malignant transfromation |
| (DGIdb 4.0) |
| Entrez ID | Symbol | Category | Interaction Types | Drug Claim Name | Drug Name | PMIDs |
| Page: 1 |

Copyright 2023-Present -The University of Texas Health Science Center at Houston |