
|
|||||
|
 | |
| |
| |
| |
| |
| |
|
Gene: TUBB6 |
Gene summary for TUBB6 |
| Gene information | Species | Human | Gene symbol | TUBB6 | Gene ID | 84617 |
| Gene name | tubulin beta 6 class V | |
| Gene Alias | FPVEPD | |
| Cytomap | 18p11.21 | |
| Gene Type | protein-coding | GO ID | GO:0000226 | UniProtAcc | Q9BUF5 |
Top |
Malignant transformation analysis |
| Identification of the aberrant gene expression in precancerous and cancerous lesions by comparing the gene expression of stem-like cells in diseased tissues with normal stem cells |
| Entrez ID | Symbol | Replicates | Species | Organ | Tissue | Adj P-value | Log2FC | Malignancy |
| 84617 | TUBB6 | LZE4T | Human | Esophagus | ESCC | 1.31e-07 | 1.13e-01 | 0.0811 |
| 84617 | TUBB6 | LZE7T | Human | Esophagus | ESCC | 1.92e-03 | 7.55e-02 | 0.0667 |
| 84617 | TUBB6 | P2T-E | Human | Esophagus | ESCC | 5.09e-15 | 4.85e-01 | 0.1177 |
| 84617 | TUBB6 | P4T-E | Human | Esophagus | ESCC | 5.96e-17 | 7.96e-01 | 0.1323 |
| 84617 | TUBB6 | P5T-E | Human | Esophagus | ESCC | 7.83e-72 | 1.74e+00 | 0.1327 |
| 84617 | TUBB6 | P9T-E | Human | Esophagus | ESCC | 1.23e-25 | 9.17e-01 | 0.1131 |
| 84617 | TUBB6 | P10T-E | Human | Esophagus | ESCC | 1.71e-05 | 3.21e-01 | 0.116 |
| 84617 | TUBB6 | P11T-E | Human | Esophagus | ESCC | 6.22e-16 | 1.04e+00 | 0.1426 |
| 84617 | TUBB6 | P12T-E | Human | Esophagus | ESCC | 3.85e-15 | 5.50e-01 | 0.1122 |
| 84617 | TUBB6 | P15T-E | Human | Esophagus | ESCC | 1.35e-07 | 5.49e-01 | 0.1149 |
| 84617 | TUBB6 | P16T-E | Human | Esophagus | ESCC | 1.68e-08 | 2.17e-01 | 0.1153 |
| 84617 | TUBB6 | P17T-E | Human | Esophagus | ESCC | 1.62e-18 | 1.56e+00 | 0.1278 |
| 84617 | TUBB6 | P19T-E | Human | Esophagus | ESCC | 5.97e-08 | 8.71e-01 | 0.1662 |
| 84617 | TUBB6 | P20T-E | Human | Esophagus | ESCC | 3.33e-15 | 5.78e-01 | 0.1124 |
| 84617 | TUBB6 | P21T-E | Human | Esophagus | ESCC | 1.62e-55 | 1.89e+00 | 0.1617 |
| 84617 | TUBB6 | P22T-E | Human | Esophagus | ESCC | 3.72e-13 | 5.23e-01 | 0.1236 |
| 84617 | TUBB6 | P23T-E | Human | Esophagus | ESCC | 3.30e-09 | 5.33e-01 | 0.108 |
| 84617 | TUBB6 | P24T-E | Human | Esophagus | ESCC | 5.18e-32 | 1.01e+00 | 0.1287 |
| 84617 | TUBB6 | P26T-E | Human | Esophagus | ESCC | 1.65e-25 | 8.01e-01 | 0.1276 |
| 84617 | TUBB6 | P27T-E | Human | Esophagus | ESCC | 4.64e-07 | 2.00e-01 | 0.1055 |
| Page: 1 2 3 4 5 |
| Tissue | Expression Dynamics | Abbreviation |
| Esophagus | 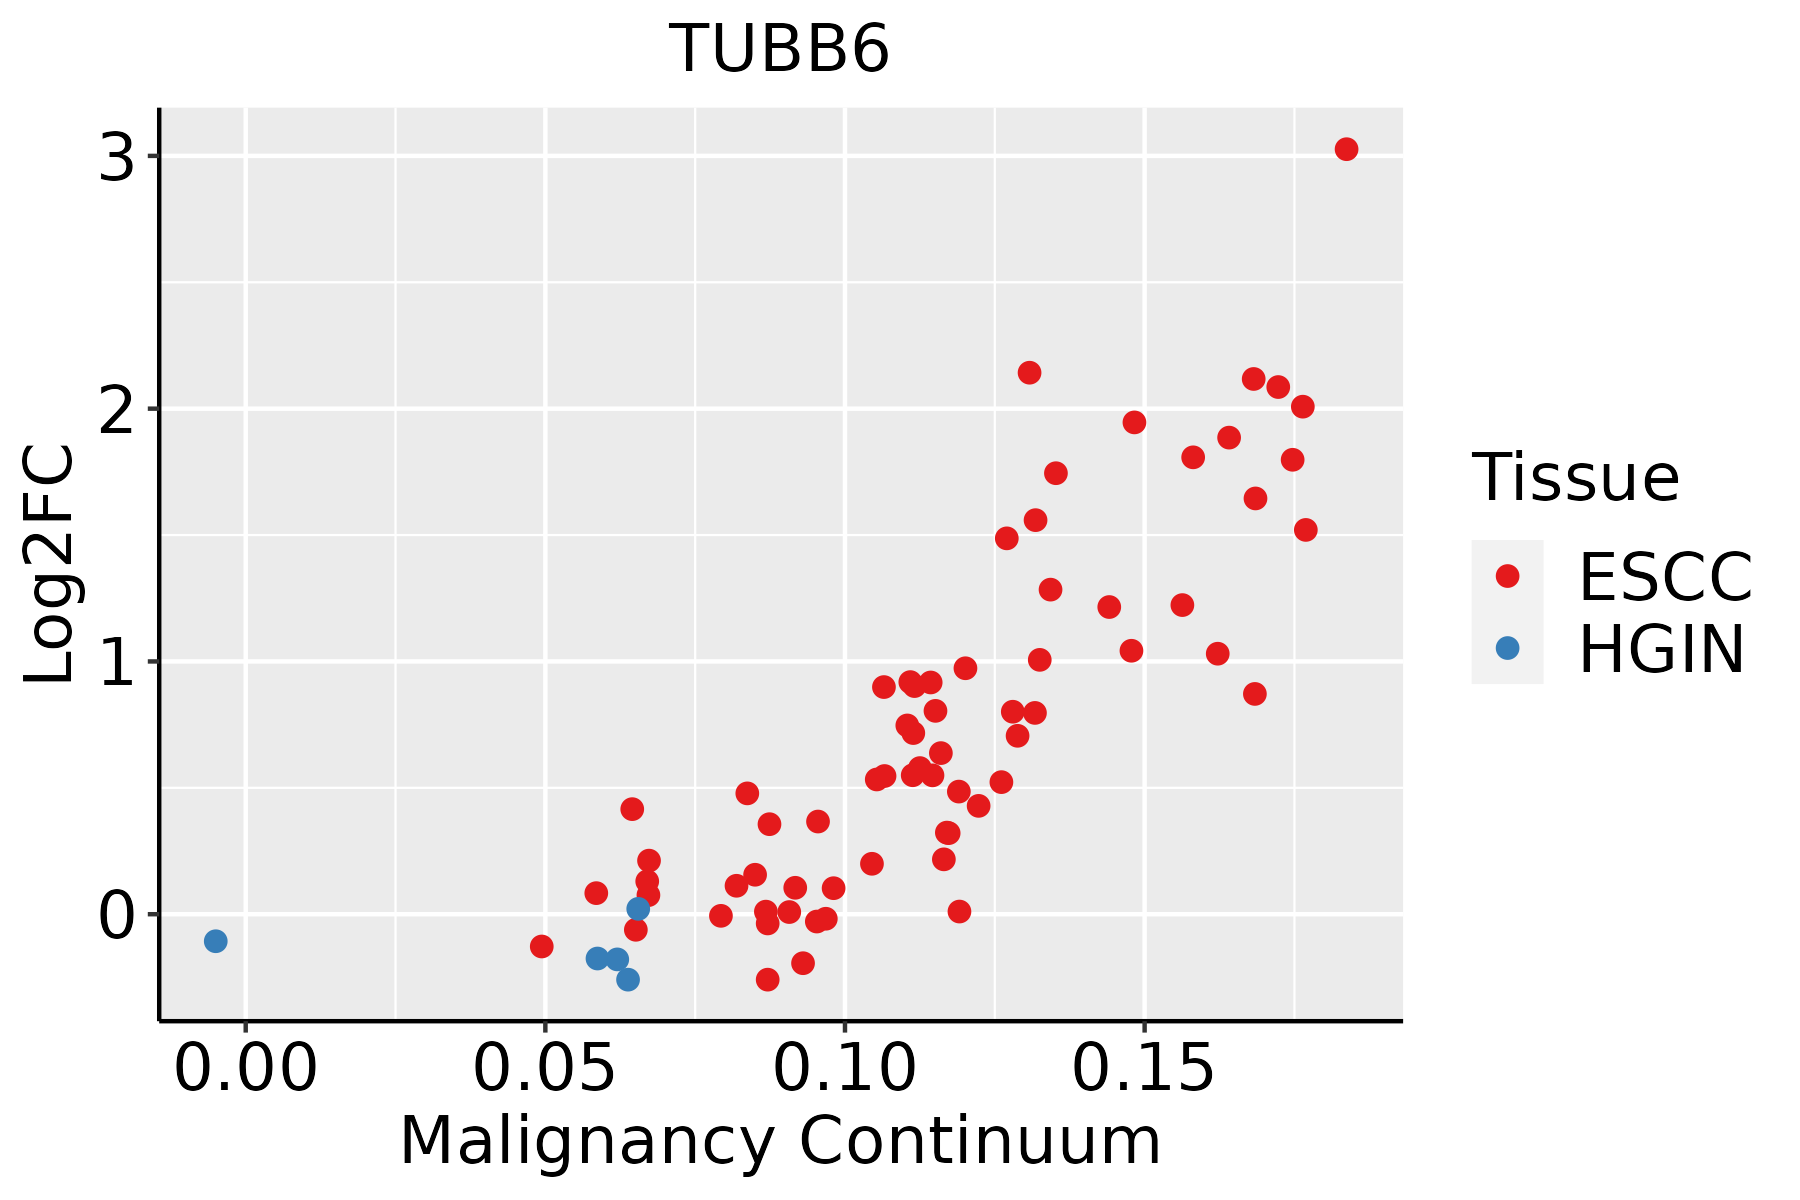 | ESCC: Esophageal squamous cell carcinoma |
| HGIN: High-grade intraepithelial neoplasias | ||
| LGIN: Low-grade intraepithelial neoplasias | ||
| Oral Cavity |  | EOLP: Erosive Oral lichen planus |
| LP: leukoplakia | ||
| NEOLP: Non-erosive oral lichen planus | ||
| OSCC: Oral squamous cell carcinoma | ||
| Skin | 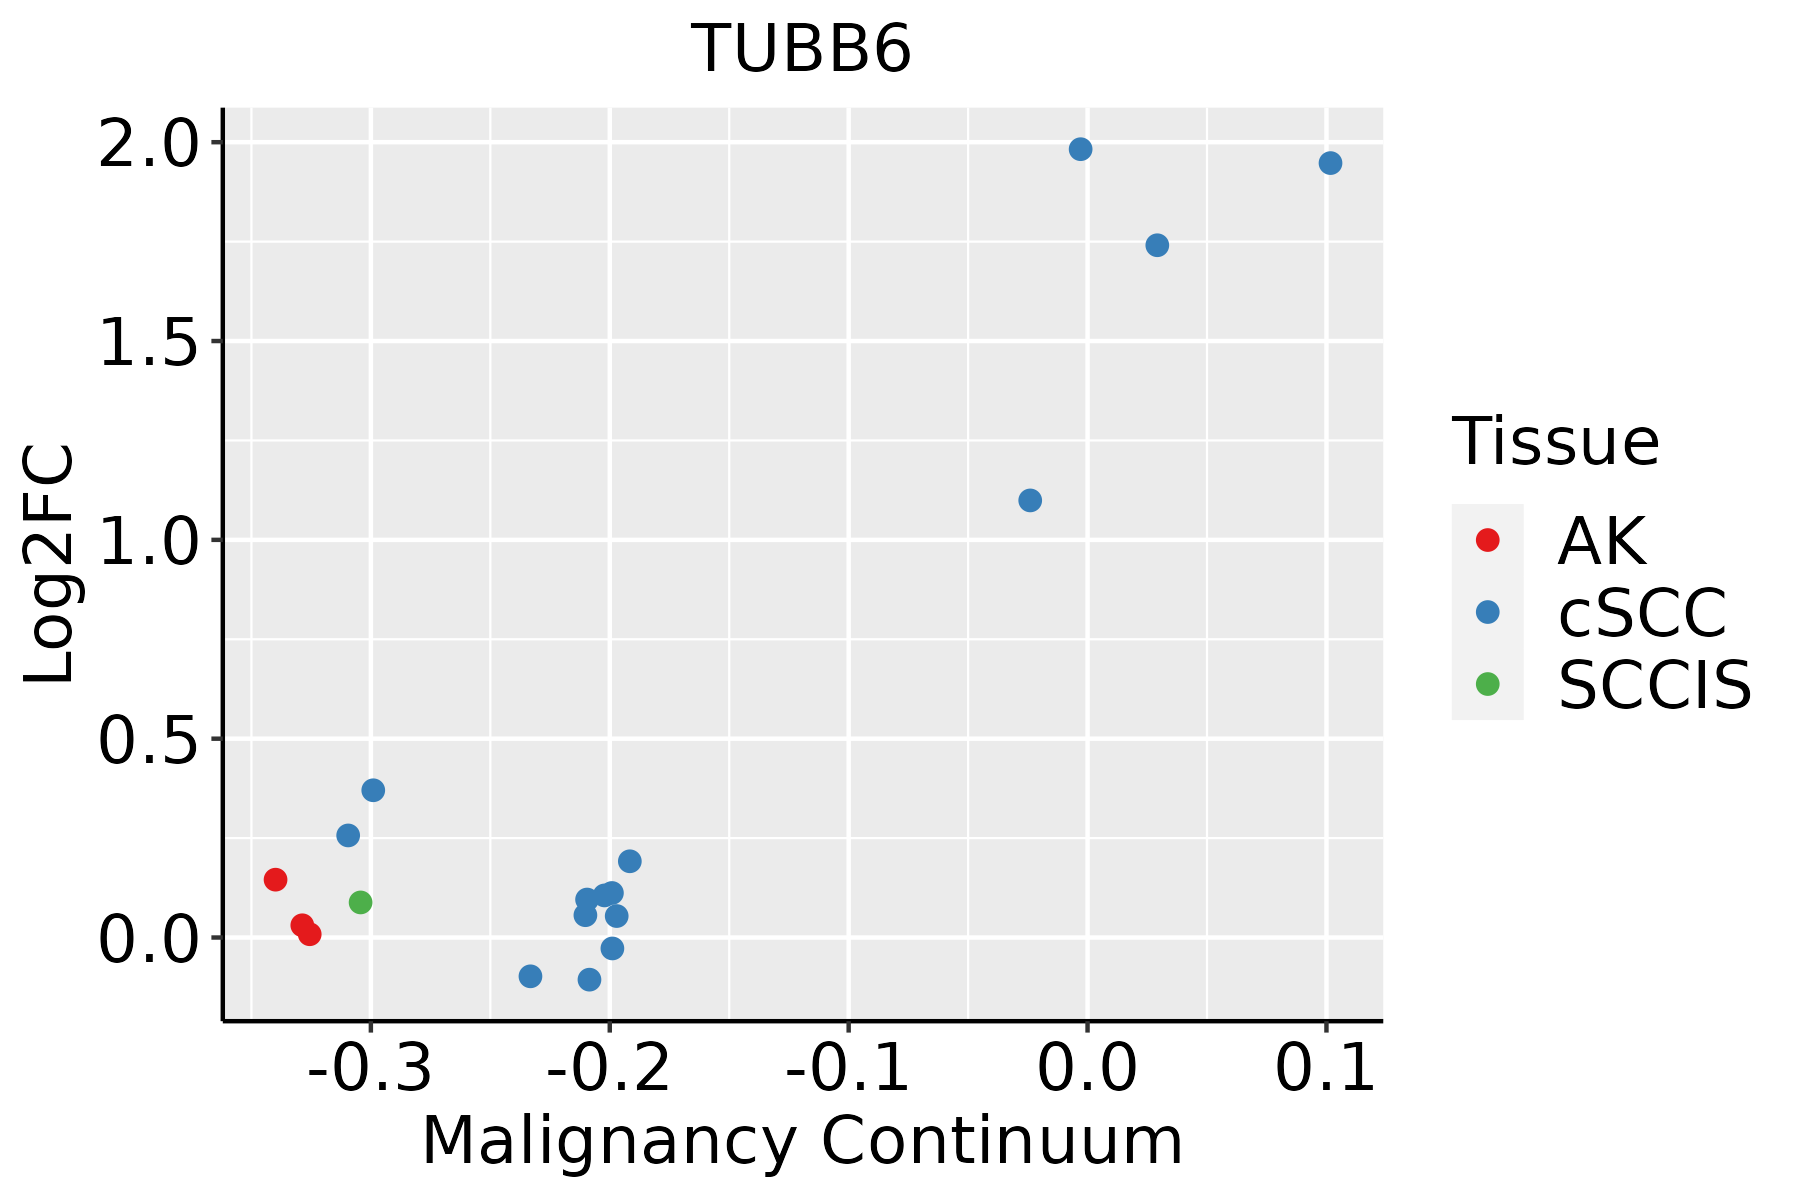 | AK: Actinic keratosis |
| cSCC: Cutaneous squamous cell carcinoma | ||
| SCCIS:squamous cell carcinoma in situ | ||
| Thyroid | 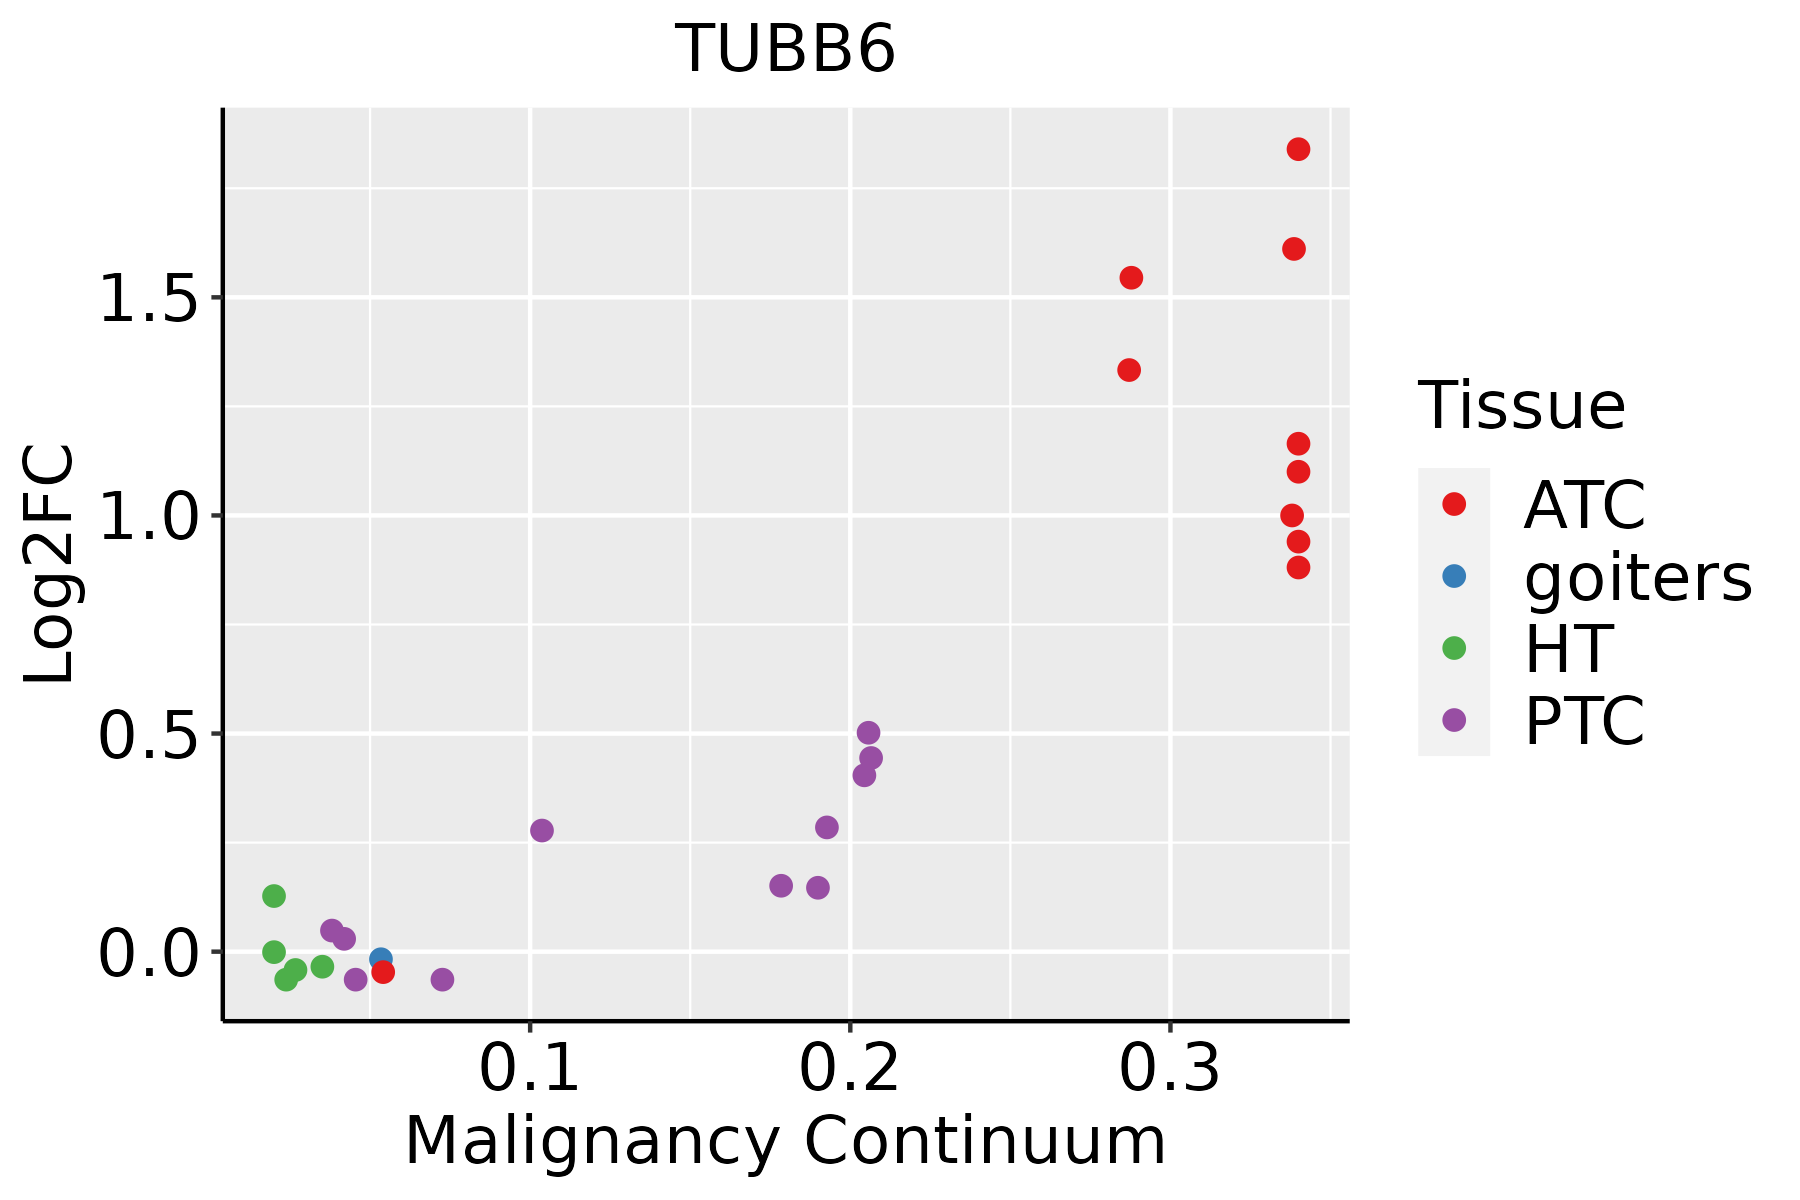 | ATC: Anaplastic thyroid cancer |
| HT: Hashimoto's thyroiditis | ||
| PTC: Papillary thyroid cancer |
| ∗log2FC in expression of this searched gene in stem-like cells from each diseased tissue sample relative to stem-like cells in normal samples in each tissue plotted against the malignancy continuum. Samples are colored based on if they are from different disease stage. |
Top |
Malignant transformation related pathway analysis |
| Find out the enriched GO biological processes and KEGG pathways involved in transition from healthy to precancer to cancer |
| Tissue | Disease Stage | Enriched GO biological Processes |
| Colorectum | AD |  |
| Colorectum | SER |  |
| Colorectum | MSS |  |
| Colorectum | MSI-H |  |
| Colorectum | FAP |  |
| ∗Top 15 enriched GO BP terms are showed in the bar plot of each disease state in each tissue. Each row represents a significant GO biological process which is colored according to the -log10(p.adjust). |
| Page: 1 2 3 4 5 6 7 8 9 |
| GO ID | Tissue | Disease Stage | Description | Gene Ratio | Bg Ratio | pvalue | p.adjust | Count |
| Page: 1 |
| Pathway ID | Tissue | Disease Stage | Description | Gene Ratio | Bg Ratio | pvalue | p.adjust | qvalue | Count |
| hsa05014210 | Esophagus | ESCC | Amyotrophic lateral sclerosis | 266/4205 | 364/8465 | 1.31e-20 | 2.20e-18 | 1.13e-18 | 266 |
| hsa05132211 | Esophagus | ESCC | Salmonella infection | 191/4205 | 249/8465 | 6.51e-19 | 5.45e-17 | 2.79e-17 | 191 |
| hsa05016210 | Esophagus | ESCC | Huntington disease | 226/4205 | 306/8465 | 1.38e-18 | 8.72e-17 | 4.46e-17 | 226 |
| hsa05012211 | Esophagus | ESCC | Parkinson disease | 201/4205 | 266/8465 | 1.56e-18 | 8.72e-17 | 4.46e-17 | 201 |
| hsa05022210 | Esophagus | ESCC | Pathways of neurodegeneration - multiple diseases | 318/4205 | 476/8465 | 6.10e-15 | 2.04e-13 | 1.05e-13 | 318 |
| hsa05010210 | Esophagus | ESCC | Alzheimer disease | 263/4205 | 384/8465 | 1.80e-14 | 5.47e-13 | 2.80e-13 | 263 |
| hsa05020210 | Esophagus | ESCC | Prion disease | 193/4205 | 273/8465 | 6.42e-13 | 1.34e-11 | 6.89e-12 | 193 |
| hsa05130211 | Esophagus | ESCC | Pathogenic Escherichia coli infection | 142/4205 | 197/8465 | 8.21e-11 | 1.06e-09 | 5.42e-10 | 142 |
| hsa0414530 | Esophagus | ESCC | Phagosome | 100/4205 | 152/8465 | 3.81e-05 | 1.72e-04 | 8.82e-05 | 100 |
| hsa0501438 | Esophagus | ESCC | Amyotrophic lateral sclerosis | 266/4205 | 364/8465 | 1.31e-20 | 2.20e-18 | 1.13e-18 | 266 |
| hsa05132310 | Esophagus | ESCC | Salmonella infection | 191/4205 | 249/8465 | 6.51e-19 | 5.45e-17 | 2.79e-17 | 191 |
| hsa0501638 | Esophagus | ESCC | Huntington disease | 226/4205 | 306/8465 | 1.38e-18 | 8.72e-17 | 4.46e-17 | 226 |
| hsa05012310 | Esophagus | ESCC | Parkinson disease | 201/4205 | 266/8465 | 1.56e-18 | 8.72e-17 | 4.46e-17 | 201 |
| hsa0502238 | Esophagus | ESCC | Pathways of neurodegeneration - multiple diseases | 318/4205 | 476/8465 | 6.10e-15 | 2.04e-13 | 1.05e-13 | 318 |
| hsa0501038 | Esophagus | ESCC | Alzheimer disease | 263/4205 | 384/8465 | 1.80e-14 | 5.47e-13 | 2.80e-13 | 263 |
| hsa0502038 | Esophagus | ESCC | Prion disease | 193/4205 | 273/8465 | 6.42e-13 | 1.34e-11 | 6.89e-12 | 193 |
| hsa05130310 | Esophagus | ESCC | Pathogenic Escherichia coli infection | 142/4205 | 197/8465 | 8.21e-11 | 1.06e-09 | 5.42e-10 | 142 |
| hsa04145114 | Esophagus | ESCC | Phagosome | 100/4205 | 152/8465 | 3.81e-05 | 1.72e-04 | 8.82e-05 | 100 |
| hsa0501428 | Oral cavity | OSCC | Amyotrophic lateral sclerosis | 246/3704 | 364/8465 | 6.65e-21 | 1.11e-18 | 5.67e-19 | 246 |
| hsa0501230 | Oral cavity | OSCC | Parkinson disease | 188/3704 | 266/8465 | 1.82e-19 | 1.52e-17 | 7.75e-18 | 188 |
| Page: 1 2 3 |
Top |
Cell-cell communication analysis |
| Identification of potential cell-cell interactions between two cell types and their ligand-receptor pairs for different disease states |
| Ligand | Receptor | LRpair | Pathway | Tissue | Disease Stage |
| Page: 1 |
Top |
Single-cell gene regulatory network inference analysis |
| Find out the significant the regulons (TFs) and the target genes of each regulon across cell types for different disease states |
| TF | Cell Type | Tissue | Disease Stage | Target Gene | RSS | Regulon Activity |
| ∗The dot plots of a searched regulon are shown for all cell subpopulations in each disease state of each tissue based on the regulon specific score inferred using pySCENIC and by calculating the average expression. |
| Page: 1 |
Top |
Somatic mutation of malignant transformation related genes |
| Annotation of somatic variants for genes involved in malignant transformation |
| Hugo Symbol | Variant Class | Variant Classification | dbSNP RS | HGVSc | HGVSp | HGVSp Short | SWISSPROT | BIOTYPE | SIFT | PolyPhen | Tumor Sample Barcode | Tissue | Histology | Sex | Age | Stage | Therapy Types | Drugs | Outcome |
| TUBB6 | SNV | Missense_Mutation | rs763504507 | c.1172G>A | p.Arg391His | p.R391H | Q9BUF5 | protein_coding | deleterious_low_confidence(0.03) | probably_damaging(0.96) | TCGA-D8-A1XZ-01 | Breast | breast invasive carcinoma | Female | >=65 | III/IV | Hormone Therapy | tamoxiphen+anastrozolum | SD |
| TUBB6 | SNV | Missense_Mutation | c.935N>T | p.Thr312Ile | p.T312I | Q9BUF5 | protein_coding | deleterious_low_confidence(0) | probably_damaging(1) | TCGA-A6-5665-01 | Colorectum | colon adenocarcinoma | Female | >=65 | I/II | Unknown | Unknown | PD | |
| TUBB6 | SNV | Missense_Mutation | c.730N>T | p.Gly244Cys | p.G244C | Q9BUF5 | protein_coding | deleterious_low_confidence(0) | probably_damaging(0.996) | TCGA-AA-3680-01 | Colorectum | colon adenocarcinoma | Female | >=65 | III/IV | Chemotherapy | folinic | PD | |
| TUBB6 | SNV | Missense_Mutation | novel | c.418N>C | p.Gly140Arg | p.G140R | Q9BUF5 | protein_coding | deleterious_low_confidence(0) | probably_damaging(1) | TCGA-AA-3952-01 | Colorectum | colon adenocarcinoma | Male | >=65 | III/IV | Unknown | Unknown | PD |
| TUBB6 | SNV | Missense_Mutation | rs756545880 | c.751N>T | p.Arg251Cys | p.R251C | Q9BUF5 | protein_coding | deleterious_low_confidence(0) | probably_damaging(0.994) | TCGA-AA-3984-01 | Colorectum | colon adenocarcinoma | Female | <65 | I/II | Unknown | Unknown | SD |
| TUBB6 | SNV | Missense_Mutation | novel | c.1194N>A | p.Phe398Leu | p.F398L | Q9BUF5 | protein_coding | deleterious_low_confidence(0) | benign(0.054) | TCGA-EI-6917-01 | Colorectum | rectum adenocarcinoma | Male | <65 | III/IV | Chemotherapy | 5fluorouracil+oxaciplatina+l-folinian | SD |
| TUBB6 | SNV | Missense_Mutation | novel | c.130N>A | p.Leu44Met | p.L44M | Q9BUF5 | protein_coding | deleterious_low_confidence(0.01) | possibly_damaging(0.866) | TCGA-AJ-A3EK-01 | Endometrium | uterine corpus endometrioid carcinoma | Female | <65 | I/II | Chemotherapy | carboplatin | CR |
| TUBB6 | SNV | Missense_Mutation | novel | c.1091N>T | p.Ala364Val | p.A364V | Q9BUF5 | protein_coding | deleterious_low_confidence(0.02) | possibly_damaging(0.642) | TCGA-AJ-A3EK-01 | Endometrium | uterine corpus endometrioid carcinoma | Female | <65 | I/II | Chemotherapy | carboplatin | CR |
| TUBB6 | SNV | Missense_Mutation | rs777748559 | c.990N>A | p.Met330Ile | p.M330I | Q9BUF5 | protein_coding | tolerated_low_confidence(0.09) | benign(0.121) | TCGA-AP-A051-01 | Endometrium | uterine corpus endometrioid carcinoma | Female | >=65 | I/II | Unknown | Unknown | SD |
| TUBB6 | SNV | Missense_Mutation | novel | c.611A>G | p.Asn204Ser | p.N204S | Q9BUF5 | protein_coding | deleterious_low_confidence(0) | possibly_damaging(0.906) | TCGA-AX-A063-01 | Endometrium | uterine corpus endometrioid carcinoma | Female | <65 | I/II | Unknown | Unknown | SD |
| Page: 1 2 3 4 5 |
Top |
Related drugs of malignant transformation related genes |
| Identification of chemicals and drugs interact with genes involved in malignant transfromation |
| (DGIdb 4.0) |
| Entrez ID | Symbol | Category | Interaction Types | Drug Claim Name | Drug Name | PMIDs |
| 84617 | TUBB6 | DRUGGABLE GENOME | inhibitor | CHEMBL1742994 | BRENTUXIMAB VEDOTIN | |
| 84617 | TUBB6 | DRUGGABLE GENOME | COLCHICINE | COLCHICINE | 23750455,25805446,24502232,25061803,25937236,24773591,25938266 | |
| 84617 | TUBB6 | DRUGGABLE GENOME | inhibitor | CHEMBL289351 | FOSBRETABULIN DISODIUM | |
| 84617 | TUBB6 | DRUGGABLE GENOME | CYCLOSTREPTIN | CYCLOSTREPTIN | 17206139 | |
| 84617 | TUBB6 | DRUGGABLE GENOME | inhibitor | CHEMBL552212 | LEXIBULIN | |
| 84617 | TUBB6 | DRUGGABLE GENOME | VINBLASTINE | VINBLASTINE | 23708010,23916255 | |
| 84617 | TUBB6 | DRUGGABLE GENOME | CHEMBL492399 | VERUBULIN | ||
| 84617 | TUBB6 | DRUGGABLE GENOME | inhibitor | CHEMBL1201752 | IXABEPILONE | |
| 84617 | TUBB6 | DRUGGABLE GENOME | PACLITAXEL | PACLITAXEL | 23631389,25369367,25768699,24457094,22595423,23313639,17887662,23387901,19758808,23725535,24953821 | |
| 84617 | TUBB6 | DRUGGABLE GENOME | CHEMBL2304041 | SAGOPILONE |
| Page: 1 2 3 4 5 |

Copyright 2023-Present -The University of Texas Health Science Center at Houston |