
|
|||||
|
 | |
| |
| |
| |
| |
| |
|
Gene: TUBB4B |
Gene summary for TUBB4B |
| Gene information | Species | Human | Gene symbol | TUBB4B | Gene ID | 10383 |
| Gene name | tubulin beta 4B class IVb | |
| Gene Alias | Beta2 | |
| Cytomap | 9q34.3 | |
| Gene Type | protein-coding | GO ID | GO:0000226 | UniProtAcc | P68371 |
Top |
Malignant transformation analysis |
| Identification of the aberrant gene expression in precancerous and cancerous lesions by comparing the gene expression of stem-like cells in diseased tissues with normal stem cells |
| Entrez ID | Symbol | Replicates | Species | Organ | Tissue | Adj P-value | Log2FC | Malignancy |
| 10383 | TUBB4B | GSM4909286 | Human | Breast | IDC | 1.08e-07 | -3.18e-01 | 0.1081 |
| 10383 | TUBB4B | GSM4909290 | Human | Breast | IDC | 2.67e-05 | -5.11e-01 | 0.2096 |
| 10383 | TUBB4B | GSM4909293 | Human | Breast | IDC | 1.31e-02 | 1.32e-01 | 0.1581 |
| 10383 | TUBB4B | GSM4909294 | Human | Breast | IDC | 2.63e-03 | 8.59e-02 | 0.2022 |
| 10383 | TUBB4B | GSM4909296 | Human | Breast | IDC | 2.44e-06 | -1.83e-01 | 0.1524 |
| 10383 | TUBB4B | GSM4909297 | Human | Breast | IDC | 8.66e-15 | -2.20e-01 | 0.1517 |
| 10383 | TUBB4B | GSM4909298 | Human | Breast | IDC | 1.49e-02 | -3.27e-01 | 0.1551 |
| 10383 | TUBB4B | GSM4909301 | Human | Breast | IDC | 1.33e-07 | -4.81e-01 | 0.1577 |
| 10383 | TUBB4B | GSM4909302 | Human | Breast | IDC | 2.23e-06 | -4.94e-01 | 0.1545 |
| 10383 | TUBB4B | GSM4909307 | Human | Breast | IDC | 2.17e-11 | -5.78e-01 | 0.1569 |
| 10383 | TUBB4B | GSM4909308 | Human | Breast | IDC | 4.73e-06 | -4.43e-01 | 0.158 |
| 10383 | TUBB4B | GSM4909311 | Human | Breast | IDC | 7.31e-33 | -6.02e-01 | 0.1534 |
| 10383 | TUBB4B | GSM4909312 | Human | Breast | IDC | 2.64e-14 | -4.71e-01 | 0.1552 |
| 10383 | TUBB4B | GSM4909313 | Human | Breast | IDC | 2.10e-03 | -4.43e-01 | 0.0391 |
| 10383 | TUBB4B | GSM4909318 | Human | Breast | IDC | 2.94e-05 | 4.40e-01 | 0.2031 |
| 10383 | TUBB4B | GSM4909319 | Human | Breast | IDC | 1.60e-36 | -4.78e-01 | 0.1563 |
| 10383 | TUBB4B | GSM4909320 | Human | Breast | IDC | 1.70e-02 | -4.98e-01 | 0.1575 |
| 10383 | TUBB4B | GSM4909321 | Human | Breast | IDC | 4.12e-09 | -8.59e-02 | 0.1559 |
| 10383 | TUBB4B | brca1 | Human | Breast | Precancer | 1.32e-39 | 6.44e-01 | -0.0338 |
| 10383 | TUBB4B | brca2 | Human | Breast | Precancer | 7.99e-18 | 3.58e-01 | -0.024 |
| Page: 1 2 3 4 5 6 7 8 9 10 11 12 13 14 |
| Tissue | Expression Dynamics | Abbreviation |
| Breast | 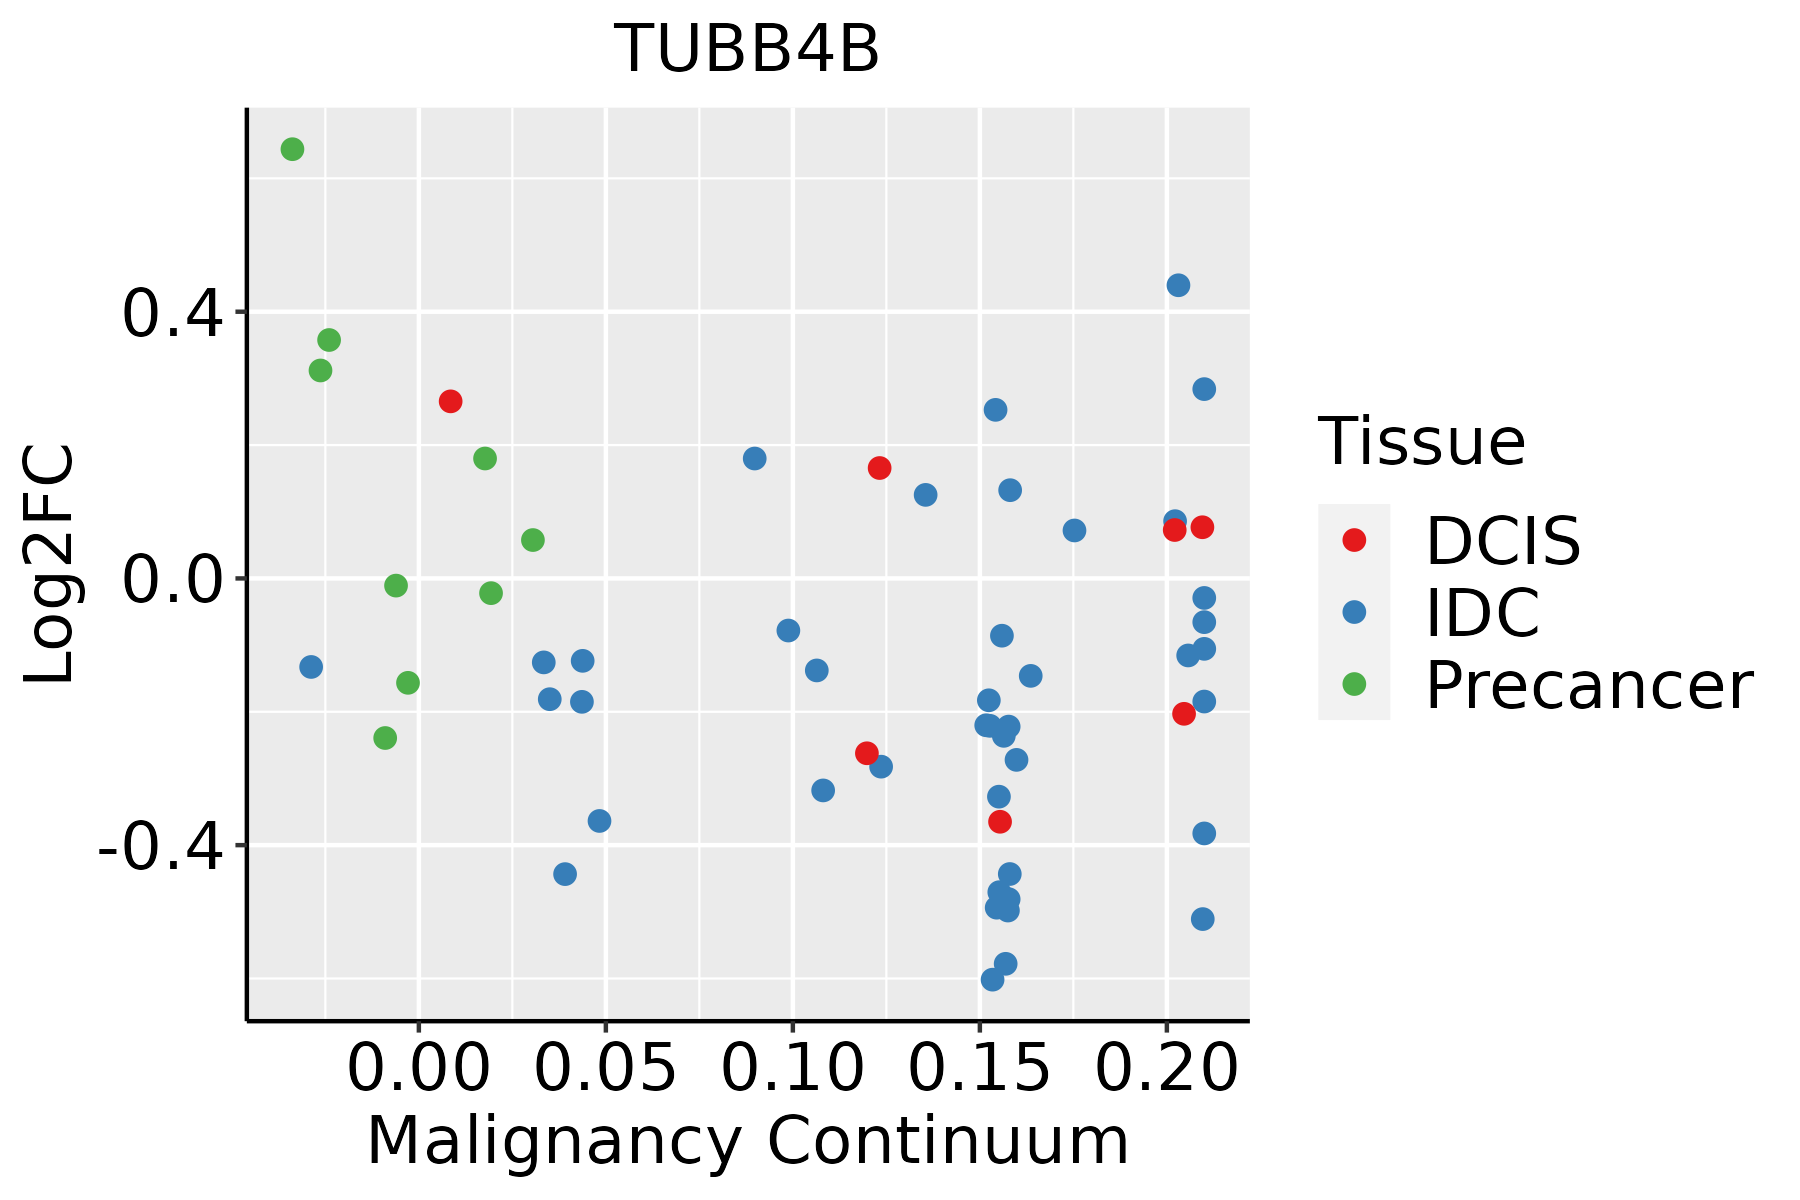 | IDC: Invasive ductal carcinoma |
| DCIS: Ductal carcinoma in situ | ||
| Precancer(BRCA1-mut): Precancerous lesion from BRCA1 mutation carriers | ||
| Cervix |  | CC: Cervix cancer |
| HSIL_HPV: HPV-infected high-grade squamous intraepithelial lesions | ||
| N_HPV: HPV-infected normal cervix | ||
| Colorectum (GSE201348) |  | FAP: Familial adenomatous polyposis |
| CRC: Colorectal cancer | ||
| Colorectum (HTA11) |  | AD: Adenomas |
| SER: Sessile serrated lesions | ||
| MSI-H: Microsatellite-high colorectal cancer | ||
| MSS: Microsatellite stable colorectal cancer | ||
| Endometrium |  | AEH: Atypical endometrial hyperplasia |
| EEC: Endometrioid Cancer | ||
| Esophagus | 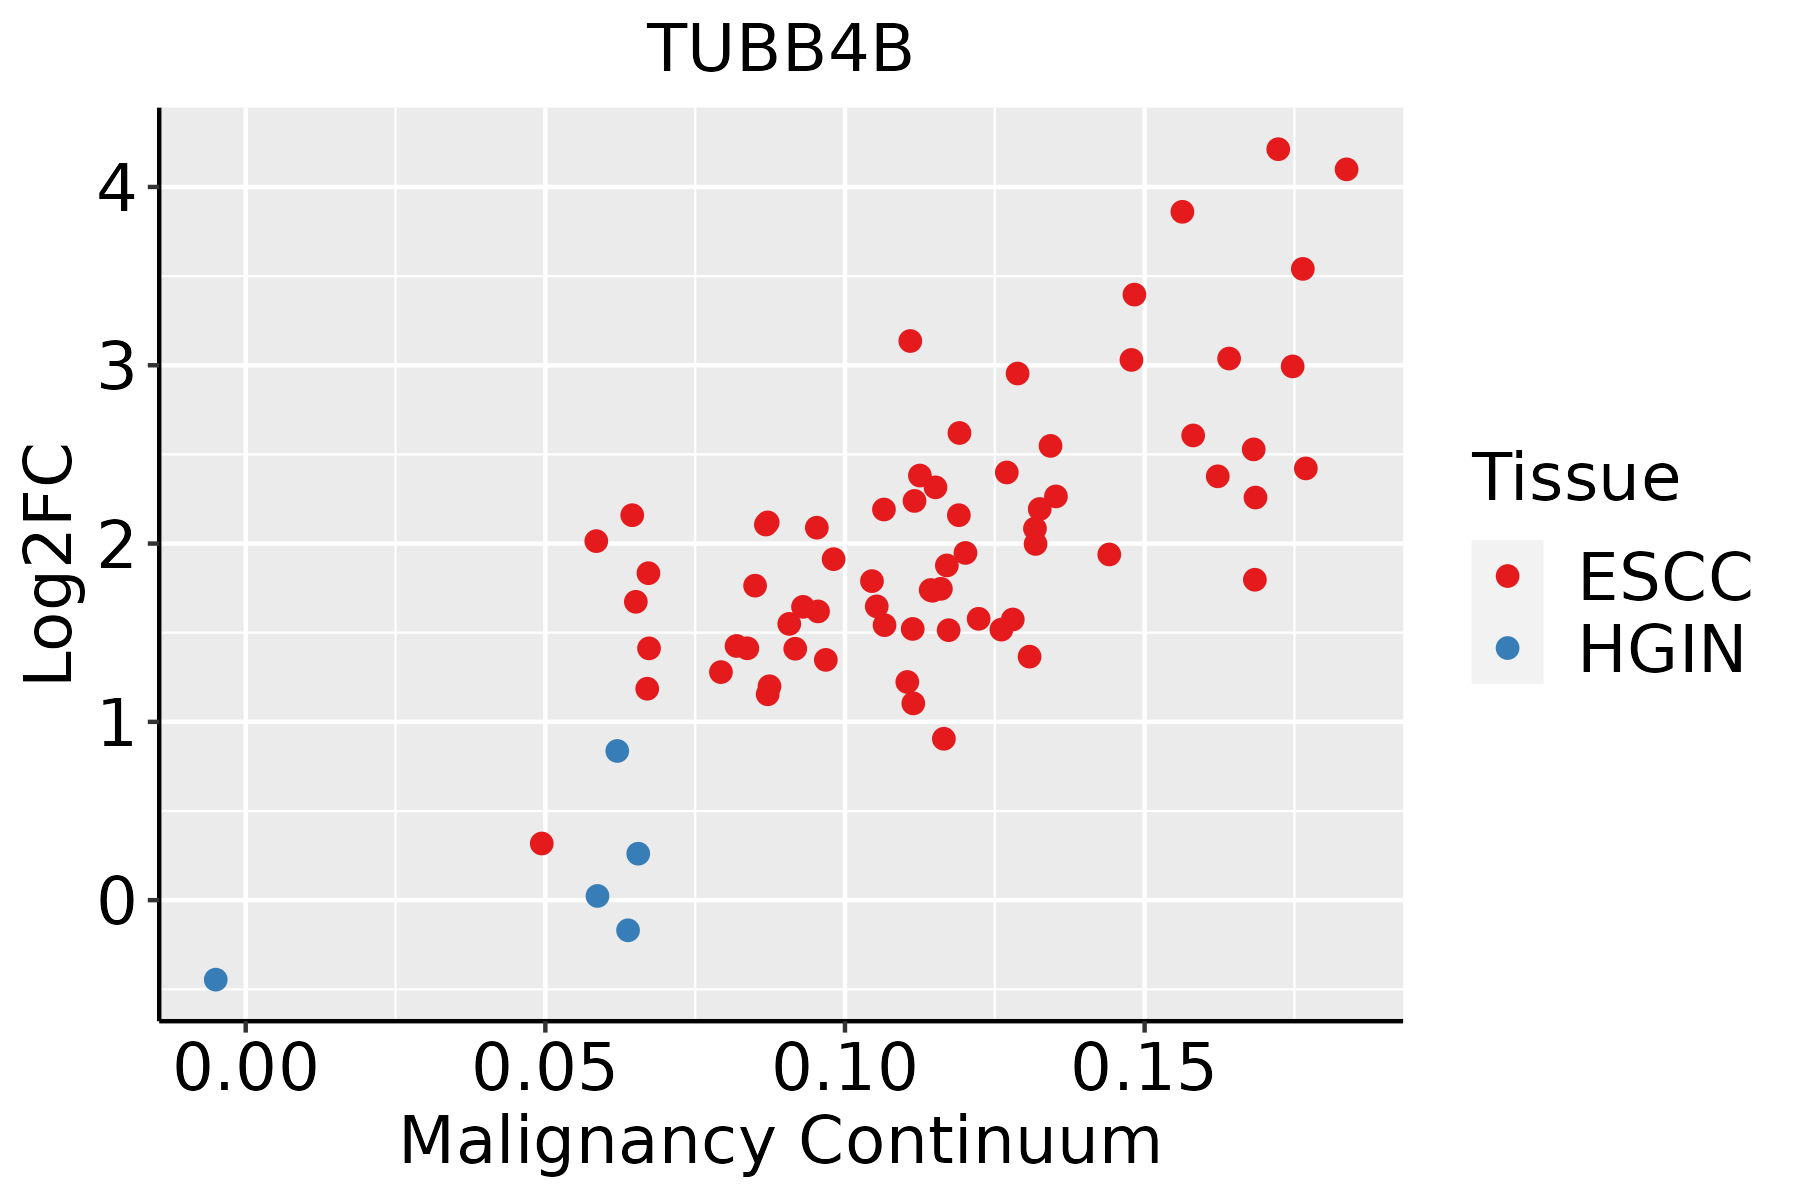 | ESCC: Esophageal squamous cell carcinoma |
| HGIN: High-grade intraepithelial neoplasias | ||
| LGIN: Low-grade intraepithelial neoplasias | ||
| GC |  | CAG: Chronic atrophic gastritis |
| CAG with IM: Chronic atrophic gastritis with intestinal metaplasia | ||
| CSG: Chronic superficial gastritis | ||
| GC: Gastric cancer | ||
| SIM: Severe intestinal metaplasia | ||
| WIM: Wild intestinal metaplasia | ||
| Liver |  | HCC: Hepatocellular carcinoma |
| NAFLD: Non-alcoholic fatty liver disease | ||
| Oral Cavity | 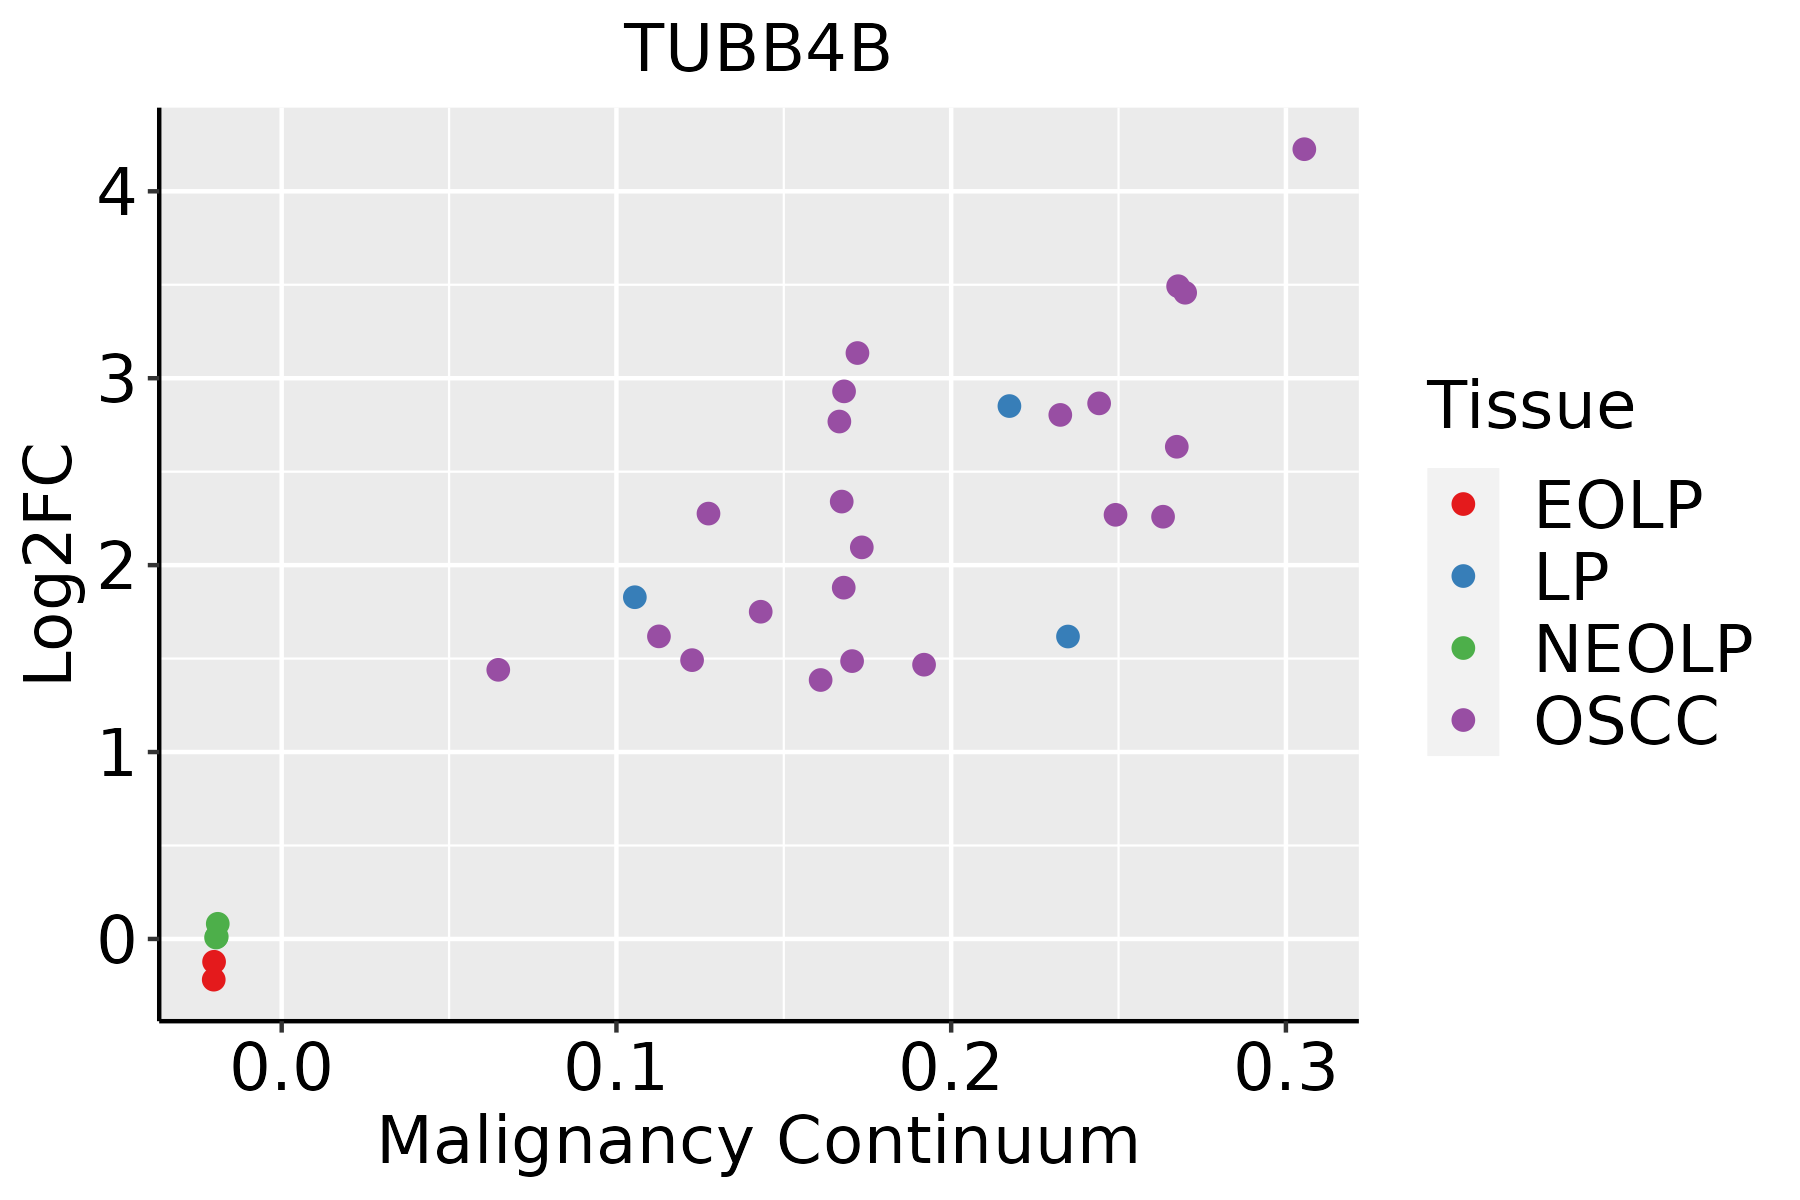 | EOLP: Erosive Oral lichen planus |
| LP: leukoplakia | ||
| NEOLP: Non-erosive oral lichen planus | ||
| OSCC: Oral squamous cell carcinoma | ||
| Prostate | 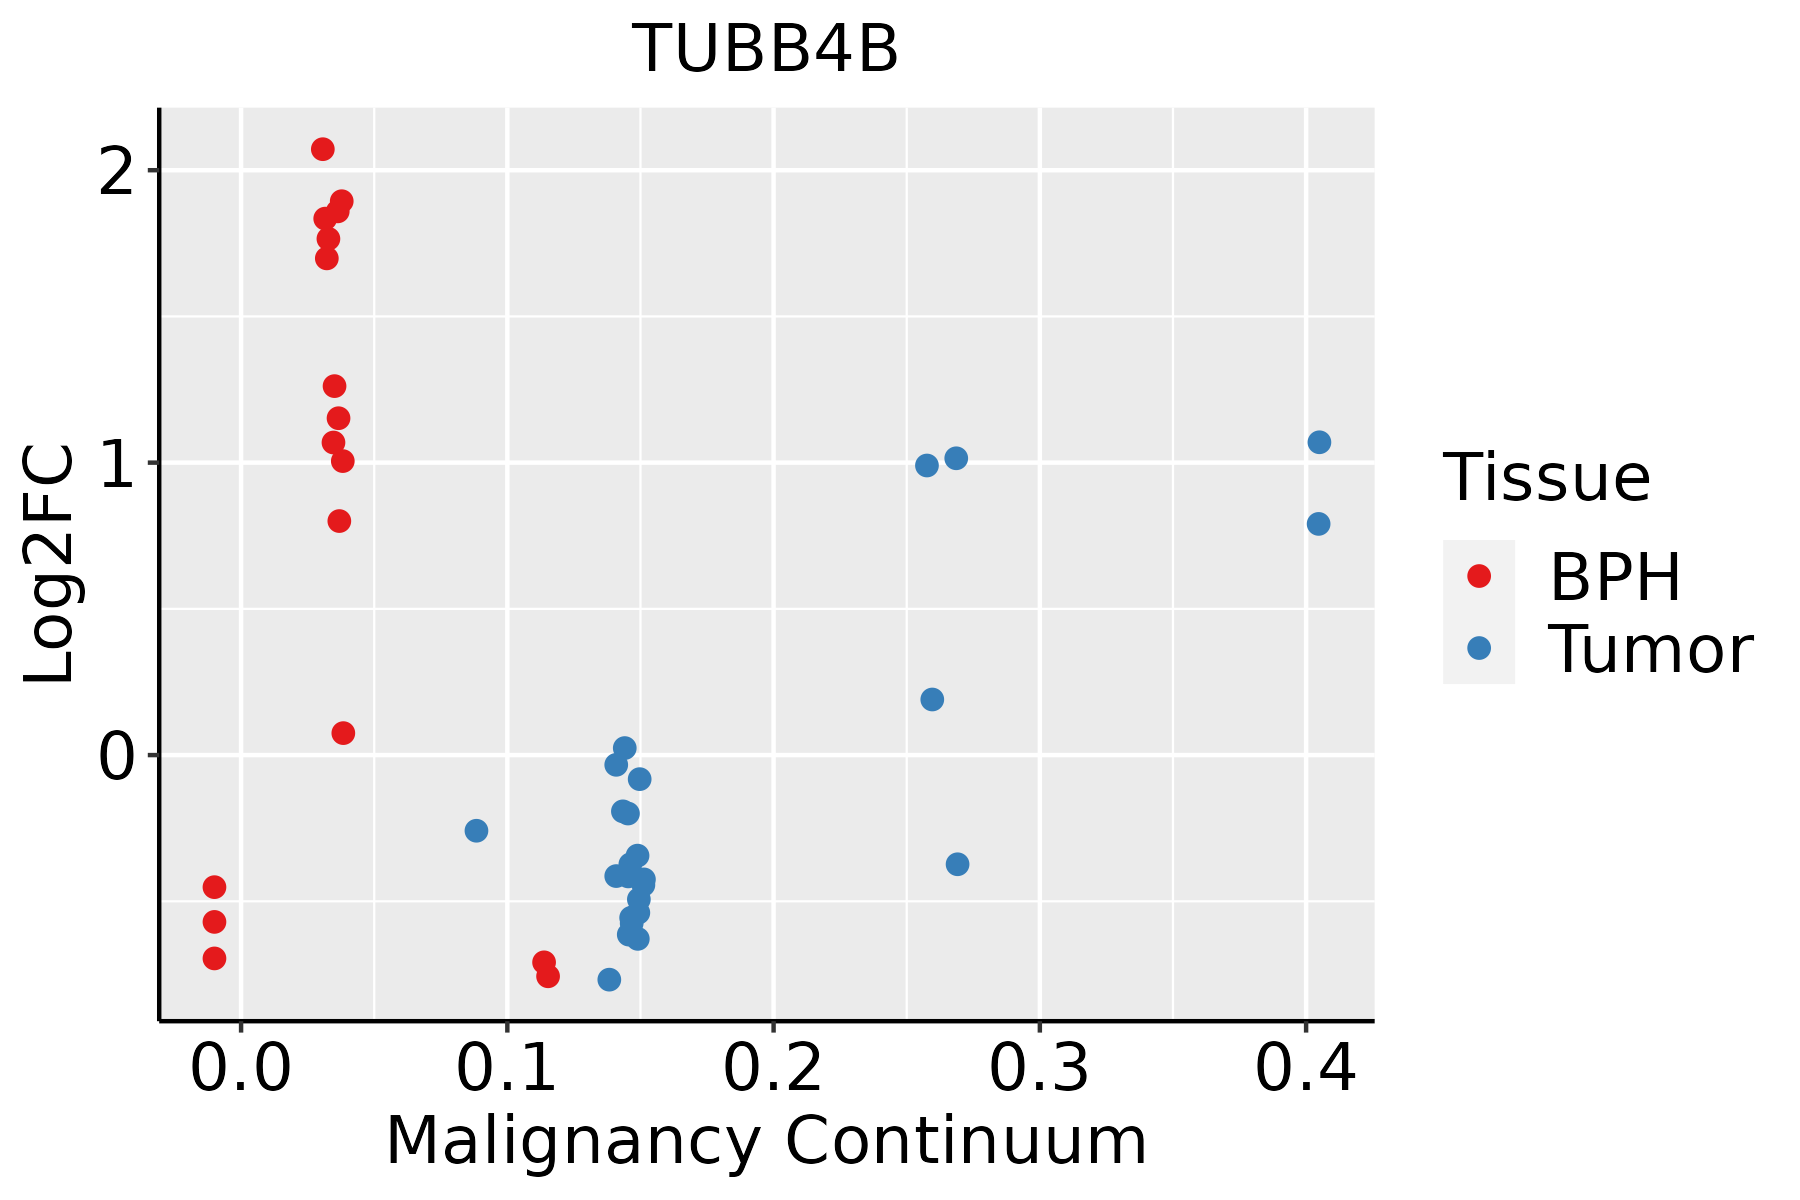 | BPH: Benign Prostatic Hyperplasia |
| Skin | 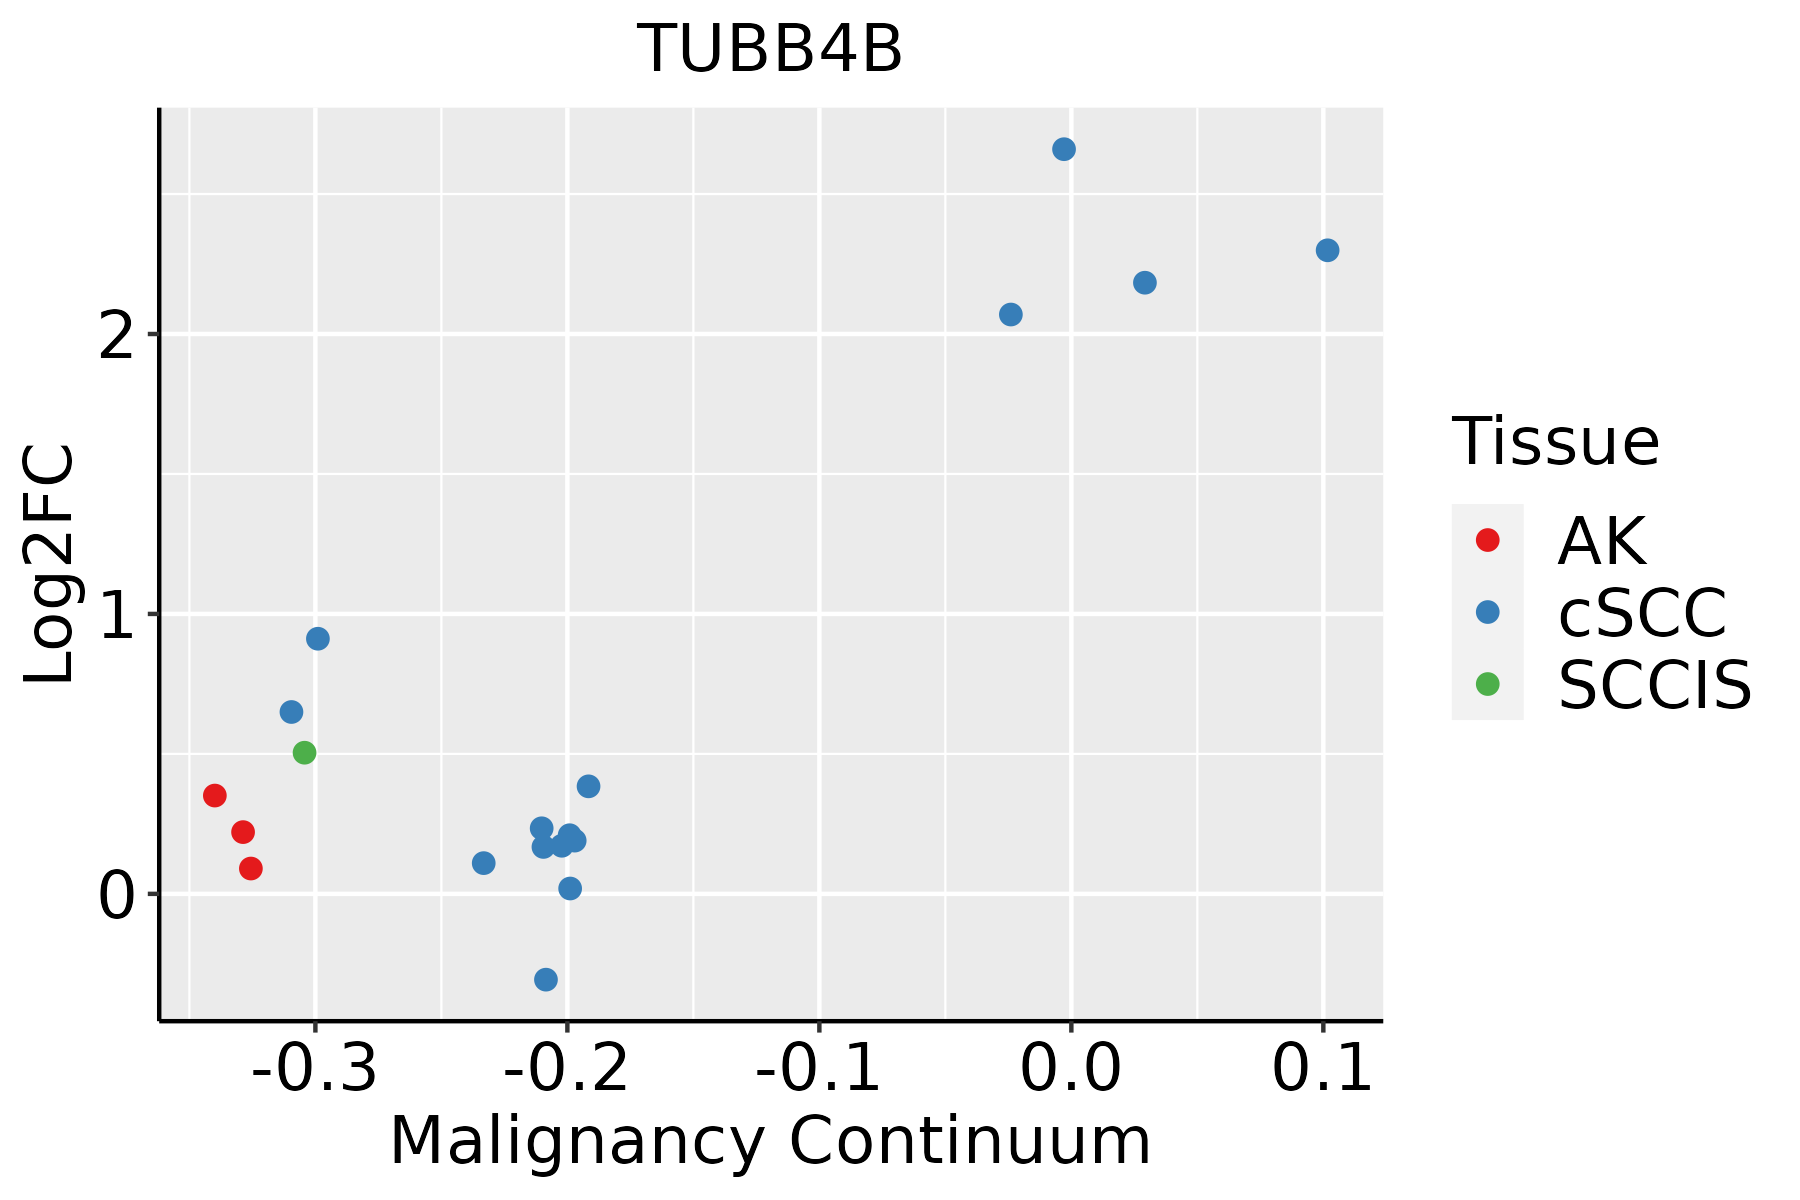 | AK: Actinic keratosis |
| cSCC: Cutaneous squamous cell carcinoma | ||
| SCCIS:squamous cell carcinoma in situ | ||
| Thyroid |  | ATC: Anaplastic thyroid cancer |
| HT: Hashimoto's thyroiditis | ||
| PTC: Papillary thyroid cancer |
| ∗log2FC in expression of this searched gene in stem-like cells from each diseased tissue sample relative to stem-like cells in normal samples in each tissue plotted against the malignancy continuum. Samples are colored based on if they are from different disease stage. |
Top |
Malignant transformation related pathway analysis |
| Find out the enriched GO biological processes and KEGG pathways involved in transition from healthy to precancer to cancer |
| Tissue | Disease Stage | Enriched GO biological Processes |
| Colorectum | AD |  |
| Colorectum | SER |  |
| Colorectum | MSS |  |
| Colorectum | MSI-H |  |
| Colorectum | FAP |  |
| ∗Top 15 enriched GO BP terms are showed in the bar plot of each disease state in each tissue. Each row represents a significant GO biological process which is colored according to the -log10(p.adjust). |
| Page: 1 2 3 4 5 6 7 8 9 |
| GO ID | Tissue | Disease Stage | Description | Gene Ratio | Bg Ratio | pvalue | p.adjust | Count |
| GO:00019067 | Cervix | CC | cell killing | 37/2311 | 188/18723 | 2.61e-03 | 1.80e-02 | 37 |
| GO:0002443 | Cervix | CC | leukocyte mediated immunity | 73/2311 | 440/18723 | 5.01e-03 | 2.98e-02 | 73 |
| GO:00024431 | Cervix | HSIL_HPV | leukocyte mediated immunity | 41/737 | 440/18723 | 3.14e-07 | 1.76e-05 | 41 |
| GO:00024493 | Cervix | HSIL_HPV | lymphocyte mediated immunity | 35/737 | 350/18723 | 4.45e-07 | 2.36e-05 | 35 |
| GO:000190611 | Cervix | HSIL_HPV | cell killing | 23/737 | 188/18723 | 1.45e-06 | 6.47e-05 | 23 |
| GO:00019093 | Cervix | HSIL_HPV | leukocyte mediated cytotoxicity | 12/737 | 124/18723 | 3.60e-03 | 3.22e-02 | 12 |
| GO:00024432 | Cervix | N_HPV | leukocyte mediated immunity | 39/534 | 440/18723 | 3.94e-10 | 2.24e-07 | 39 |
| GO:000244911 | Cervix | N_HPV | lymphocyte mediated immunity | 32/534 | 350/18723 | 7.29e-09 | 1.58e-06 | 32 |
| GO:000190621 | Cervix | N_HPV | cell killing | 22/534 | 188/18723 | 2.20e-08 | 3.03e-06 | 22 |
| GO:000190911 | Cervix | N_HPV | leukocyte mediated cytotoxicity | 13/534 | 124/18723 | 5.46e-05 | 1.22e-03 | 13 |
| GO:00019066 | Liver | Cyst | cell killing | 13/496 | 188/18723 | 1.55e-03 | 3.61e-02 | 13 |
| GO:00019092 | Liver | Cyst | leukocyte mediated cytotoxicity | 10/496 | 124/18723 | 1.72e-03 | 3.84e-02 | 10 |
| GO:00024433 | Oral cavity | EOLP | leukocyte mediated immunity | 73/2218 | 440/18723 | 1.78e-03 | 1.16e-02 | 73 |
| GO:0001906 | Stomach | GC | cell killing | 22/1159 | 188/18723 | 3.03e-03 | 2.71e-02 | 22 |
| GO:0002449 | Stomach | GC | lymphocyte mediated immunity | 34/1159 | 350/18723 | 6.25e-03 | 4.69e-02 | 34 |
| GO:00019061 | Stomach | CAG with IM | cell killing | 21/1050 | 188/18723 | 2.04e-03 | 2.11e-02 | 21 |
| GO:00024491 | Stomach | CAG with IM | lymphocyte mediated immunity | 33/1050 | 350/18723 | 2.50e-03 | 2.46e-02 | 33 |
| GO:00019062 | Stomach | CSG | cell killing | 22/1034 | 188/18723 | 7.18e-04 | 1.00e-02 | 22 |
| GO:00024492 | Stomach | CSG | lymphocyte mediated immunity | 33/1034 | 350/18723 | 1.96e-03 | 2.06e-02 | 33 |
| GO:00019063 | Stomach | CAG | cell killing | 19/552 | 188/18723 | 3.13e-06 | 1.55e-04 | 19 |
| Page: 1 2 |
| Pathway ID | Tissue | Disease Stage | Description | Gene Ratio | Bg Ratio | pvalue | p.adjust | qvalue | Count |
| hsa0501218 | Breast | Precancer | Parkinson disease | 99/684 | 266/8465 | 3.58e-42 | 5.65e-40 | 4.33e-40 | 99 |
| hsa0502016 | Breast | Precancer | Prion disease | 95/684 | 273/8465 | 1.39e-37 | 1.46e-35 | 1.12e-35 | 95 |
| hsa0501616 | Breast | Precancer | Huntington disease | 98/684 | 306/8465 | 2.85e-35 | 2.25e-33 | 1.72e-33 | 98 |
| hsa0501016 | Breast | Precancer | Alzheimer disease | 103/684 | 384/8465 | 1.03e-29 | 4.66e-28 | 3.57e-28 | 103 |
| hsa0501416 | Breast | Precancer | Amyotrophic lateral sclerosis | 98/684 | 364/8465 | 2.13e-28 | 8.41e-27 | 6.44e-27 | 98 |
| hsa0502216 | Breast | Precancer | Pathways of neurodegeneration - multiple diseases | 112/684 | 476/8465 | 6.96e-27 | 2.44e-25 | 1.87e-25 | 112 |
| hsa0513218 | Breast | Precancer | Salmonella infection | 49/684 | 249/8465 | 2.92e-09 | 6.15e-08 | 4.71e-08 | 49 |
| hsa0513018 | Breast | Precancer | Pathogenic Escherichia coli infection | 38/684 | 197/8465 | 3.12e-07 | 5.81e-06 | 4.45e-06 | 38 |
| hsa0414518 | Breast | Precancer | Phagosome | 27/684 | 152/8465 | 7.37e-05 | 6.85e-04 | 5.25e-04 | 27 |
| hsa0501219 | Breast | Precancer | Parkinson disease | 99/684 | 266/8465 | 3.58e-42 | 5.65e-40 | 4.33e-40 | 99 |
| hsa0502017 | Breast | Precancer | Prion disease | 95/684 | 273/8465 | 1.39e-37 | 1.46e-35 | 1.12e-35 | 95 |
| hsa0501617 | Breast | Precancer | Huntington disease | 98/684 | 306/8465 | 2.85e-35 | 2.25e-33 | 1.72e-33 | 98 |
| hsa0501017 | Breast | Precancer | Alzheimer disease | 103/684 | 384/8465 | 1.03e-29 | 4.66e-28 | 3.57e-28 | 103 |
| hsa0501417 | Breast | Precancer | Amyotrophic lateral sclerosis | 98/684 | 364/8465 | 2.13e-28 | 8.41e-27 | 6.44e-27 | 98 |
| hsa0502217 | Breast | Precancer | Pathways of neurodegeneration - multiple diseases | 112/684 | 476/8465 | 6.96e-27 | 2.44e-25 | 1.87e-25 | 112 |
| hsa0513219 | Breast | Precancer | Salmonella infection | 49/684 | 249/8465 | 2.92e-09 | 6.15e-08 | 4.71e-08 | 49 |
| hsa0513019 | Breast | Precancer | Pathogenic Escherichia coli infection | 38/684 | 197/8465 | 3.12e-07 | 5.81e-06 | 4.45e-06 | 38 |
| hsa0414519 | Breast | Precancer | Phagosome | 27/684 | 152/8465 | 7.37e-05 | 6.85e-04 | 5.25e-04 | 27 |
| hsa0501224 | Breast | IDC | Parkinson disease | 107/867 | 266/8465 | 2.57e-39 | 8.36e-37 | 6.26e-37 | 107 |
| hsa0502023 | Breast | IDC | Prion disease | 102/867 | 273/8465 | 3.70e-34 | 4.01e-32 | 3.00e-32 | 102 |
| Page: 1 2 3 4 5 6 7 8 9 10 11 12 13 14 15 16 17 18 19 20 21 22 23 |
Top |
Cell-cell communication analysis |
| Identification of potential cell-cell interactions between two cell types and their ligand-receptor pairs for different disease states |
| Ligand | Receptor | LRpair | Pathway | Tissue | Disease Stage |
| Page: 1 |
Top |
Single-cell gene regulatory network inference analysis |
| Find out the significant the regulons (TFs) and the target genes of each regulon across cell types for different disease states |
| TF | Cell Type | Tissue | Disease Stage | Target Gene | RSS | Regulon Activity |
| ∗The dot plots of a searched regulon are shown for all cell subpopulations in each disease state of each tissue based on the regulon specific score inferred using pySCENIC and by calculating the average expression. |
| Page: 1 |
Top |
Somatic mutation of malignant transformation related genes |
| Annotation of somatic variants for genes involved in malignant transformation |
| Hugo Symbol | Variant Class | Variant Classification | dbSNP RS | HGVSc | HGVSp | HGVSp Short | SWISSPROT | BIOTYPE | SIFT | PolyPhen | Tumor Sample Barcode | Tissue | Histology | Sex | Age | Stage | Therapy Types | Drugs | Outcome |
| TUBB4B | SNV | Missense_Mutation | c.1282N>A | p.Ala428Thr | p.A428T | P68371 | protein_coding | deleterious_low_confidence(0.02) | benign(0) | TCGA-A2-A0EQ-01 | Breast | breast invasive carcinoma | Female | <65 | I/II | Chemotherapy | adriamycin | SD | |
| TUBB4B | SNV | Missense_Mutation | c.1245G>A | p.Met415Ile | p.M415I | P68371 | protein_coding | tolerated_low_confidence(0.1) | benign(0.09) | TCGA-AO-A0JB-01 | Breast | breast invasive carcinoma | Female | <65 | III/IV | Chemotherapy | cyclophosphamide | SD | |
| TUBB4B | SNV | Missense_Mutation | novel | c.795C>A | p.Phe265Leu | p.F265L | P68371 | protein_coding | deleterious_low_confidence(0.02) | benign(0.115) | TCGA-C8-A135-01 | Breast | breast invasive carcinoma | Female | <65 | I/II | Chemotherapy | 5-fluorouracil | CR |
| TUBB4B | SNV | Missense_Mutation | novel | c.1316N>G | p.Glu439Gly | p.E439G | P68371 | protein_coding | deleterious_low_confidence(0.05) | probably_damaging(0.932) | TCGA-D8-A1XK-01 | Breast | breast invasive carcinoma | Female | <65 | I/II | Chemotherapy | doxorubicine+cyclophosphamide | SD |
| TUBB4B | deletion | Frame_Shift_Del | novel | c.309delN | p.His105ThrfsTer16 | p.H105Tfs*16 | P68371 | protein_coding | TCGA-D8-A27V-01 | Breast | breast invasive carcinoma | Female | <65 | I/II | Hormone Therapy | tamoxiphen | SD | ||
| TUBB4B | SNV | Missense_Mutation | c.1075N>T | p.Arg359Trp | p.R359W | P68371 | protein_coding | deleterious_low_confidence(0.03) | possibly_damaging(0.776) | TCGA-2W-A8YY-01 | Cervix | cervical & endocervical cancer | Female | <65 | I/II | Chemotherapy | cisplatin | CR | |
| TUBB4B | SNV | Missense_Mutation | c.1234G>A | p.Glu412Lys | p.E412K | P68371 | protein_coding | deleterious_low_confidence(0.03) | probably_damaging(0.999) | TCGA-C5-A1BQ-01 | Cervix | cervical & endocervical cancer | Female | >=65 | III/IV | Chemotherapy | cisplatin | CR | |
| TUBB4B | SNV | Missense_Mutation | novel | c.282N>C | p.Gln94His | p.Q94H | P68371 | protein_coding | deleterious_low_confidence(0.03) | benign(0.013) | TCGA-VS-A953-01 | Cervix | cervical & endocervical cancer | Female | <65 | I/II | Unknown | Unknown | PD |
| TUBB4B | SNV | Missense_Mutation | novel | c.98C>T | p.Thr33Met | p.T33M | P68371 | protein_coding | deleterious_low_confidence(0.03) | possibly_damaging(0.567) | TCGA-AA-3519-01 | Colorectum | colon adenocarcinoma | Male | <65 | III/IV | Unknown | Unknown | SD |
| TUBB4B | SNV | Missense_Mutation | c.371N>T | p.Ala124Val | p.A124V | P68371 | protein_coding | deleterious_low_confidence(0.04) | benign(0.019) | TCGA-AD-6895-01 | Colorectum | colon adenocarcinoma | Male | >=65 | III/IV | Unknown | Unknown | SD |
| Page: 1 2 3 4 5 |
Top |
Related drugs of malignant transformation related genes |
| Identification of chemicals and drugs interact with genes involved in malignant transfromation |
| (DGIdb 4.0) |
| Entrez ID | Symbol | Category | Interaction Types | Drug Claim Name | Drug Name | PMIDs |
| 10383 | TUBB4B | DRUGGABLE GENOME | MAYTANSINE | MAYTANSINE | 563462 | |
| 10383 | TUBB4B | DRUGGABLE GENOME | CHEMBL492399 | VERUBULIN | ||
| 10383 | TUBB4B | DRUGGABLE GENOME | 10,11-DIHYDROEPOTHILONE D | CHEMBL453818 | 12141877 | |
| 10383 | TUBB4B | DRUGGABLE GENOME | CHEMBL2108628 | PACLITAXEL POLIGLUMEX | ||
| 10383 | TUBB4B | DRUGGABLE GENOME | VINBLASTINE | VINBLASTINE | 23708010,23916255 | |
| 10383 | TUBB4B | DRUGGABLE GENOME | DOLASTATIN-10 | DOLASTATIN-10 | ||
| 10383 | TUBB4B | DRUGGABLE GENOME | inhibitor | CHEMBL538943 | VINORELBINE TARTRATE | |
| 10383 | TUBB4B | DRUGGABLE GENOME | VINCRISTINE | VINCRISTINE | 16539377,21664138,23916255 | |
| 10383 | TUBB4B | DRUGGABLE GENOME | inhibitor | CHEMBL107 | COLCHICINE | |
| 10383 | TUBB4B | DRUGGABLE GENOME | MEBENDAZOLE | MEBENDAZOLE |
| Page: 1 2 3 4 5 |

Copyright 2023-Present -The University of Texas Health Science Center at Houston |