
|
|||||
|
 | |
| |
| |
| |
| |
| |
|
Gene: TUBB2B |
Gene summary for TUBB2B |
| Gene information | Species | Human | Gene symbol | TUBB2B | Gene ID | 347733 |
| Gene name | tubulin beta 2B class IIb | |
| Gene Alias | CDCBM7 | |
| Cytomap | 6p25.2 | |
| Gene Type | protein-coding | GO ID | GO:0000226 | UniProtAcc | Q9BVA1 |
Top |
Malignant transformation analysis |
| Identification of the aberrant gene expression in precancerous and cancerous lesions by comparing the gene expression of stem-like cells in diseased tissues with normal stem cells |
| Entrez ID | Symbol | Replicates | Species | Organ | Tissue | Adj P-value | Log2FC | Malignancy |
| 347733 | TUBB2B | LZE7T | Human | Esophagus | ESCC | 8.44e-25 | 3.40e+00 | 0.0667 |
| 347733 | TUBB2B | P4T-E | Human | Esophagus | ESCC | 5.49e-24 | 1.49e+00 | 0.1323 |
| 347733 | TUBB2B | P11T-E | Human | Esophagus | ESCC | 6.79e-09 | 1.12e+00 | 0.1426 |
| 347733 | TUBB2B | P16T-E | Human | Esophagus | ESCC | 8.52e-09 | 3.07e-01 | 0.1153 |
| 347733 | TUBB2B | P19T-E | Human | Esophagus | ESCC | 1.24e-02 | 8.18e-01 | 0.1662 |
| 347733 | TUBB2B | P24T-E | Human | Esophagus | ESCC | 1.18e-03 | 4.31e-01 | 0.1287 |
| 347733 | TUBB2B | P27T-E | Human | Esophagus | ESCC | 1.32e-10 | 5.73e-01 | 0.1055 |
| 347733 | TUBB2B | P28T-E | Human | Esophagus | ESCC | 1.66e-17 | 7.26e-01 | 0.1149 |
| 347733 | TUBB2B | P30T-E | Human | Esophagus | ESCC | 2.31e-07 | 1.03e+00 | 0.137 |
| 347733 | TUBB2B | P32T-E | Human | Esophagus | ESCC | 9.78e-08 | 5.85e-01 | 0.1666 |
| 347733 | TUBB2B | P48T-E | Human | Esophagus | ESCC | 9.46e-18 | 1.05e+00 | 0.0959 |
| 347733 | TUBB2B | P52T-E | Human | Esophagus | ESCC | 5.39e-15 | 1.35e+00 | 0.1555 |
| 347733 | TUBB2B | P56T-E | Human | Esophagus | ESCC | 2.39e-03 | 1.04e+00 | 0.1613 |
| 347733 | TUBB2B | P57T-E | Human | Esophagus | ESCC | 6.82e-03 | 2.07e-01 | 0.0926 |
| 347733 | TUBB2B | P61T-E | Human | Esophagus | ESCC | 1.41e-04 | 4.06e-01 | 0.099 |
| 347733 | TUBB2B | P76T-E | Human | Esophagus | ESCC | 6.42e-26 | 1.14e+00 | 0.1207 |
| 347733 | TUBB2B | P79T-E | Human | Esophagus | ESCC | 3.74e-03 | 1.89e-01 | 0.1154 |
| 347733 | TUBB2B | P130T-E | Human | Esophagus | ESCC | 4.98e-69 | 2.34e+00 | 0.1676 |
| 347733 | TUBB2B | HCC1_Meng | Human | Liver | HCC | 3.61e-08 | -3.24e-02 | 0.0246 |
| 347733 | TUBB2B | cirrhotic2 | Human | Liver | Cirrhotic | 3.26e-04 | 9.73e-02 | 0.0201 |
| Page: 1 2 |
| Tissue | Expression Dynamics | Abbreviation |
| Esophagus | 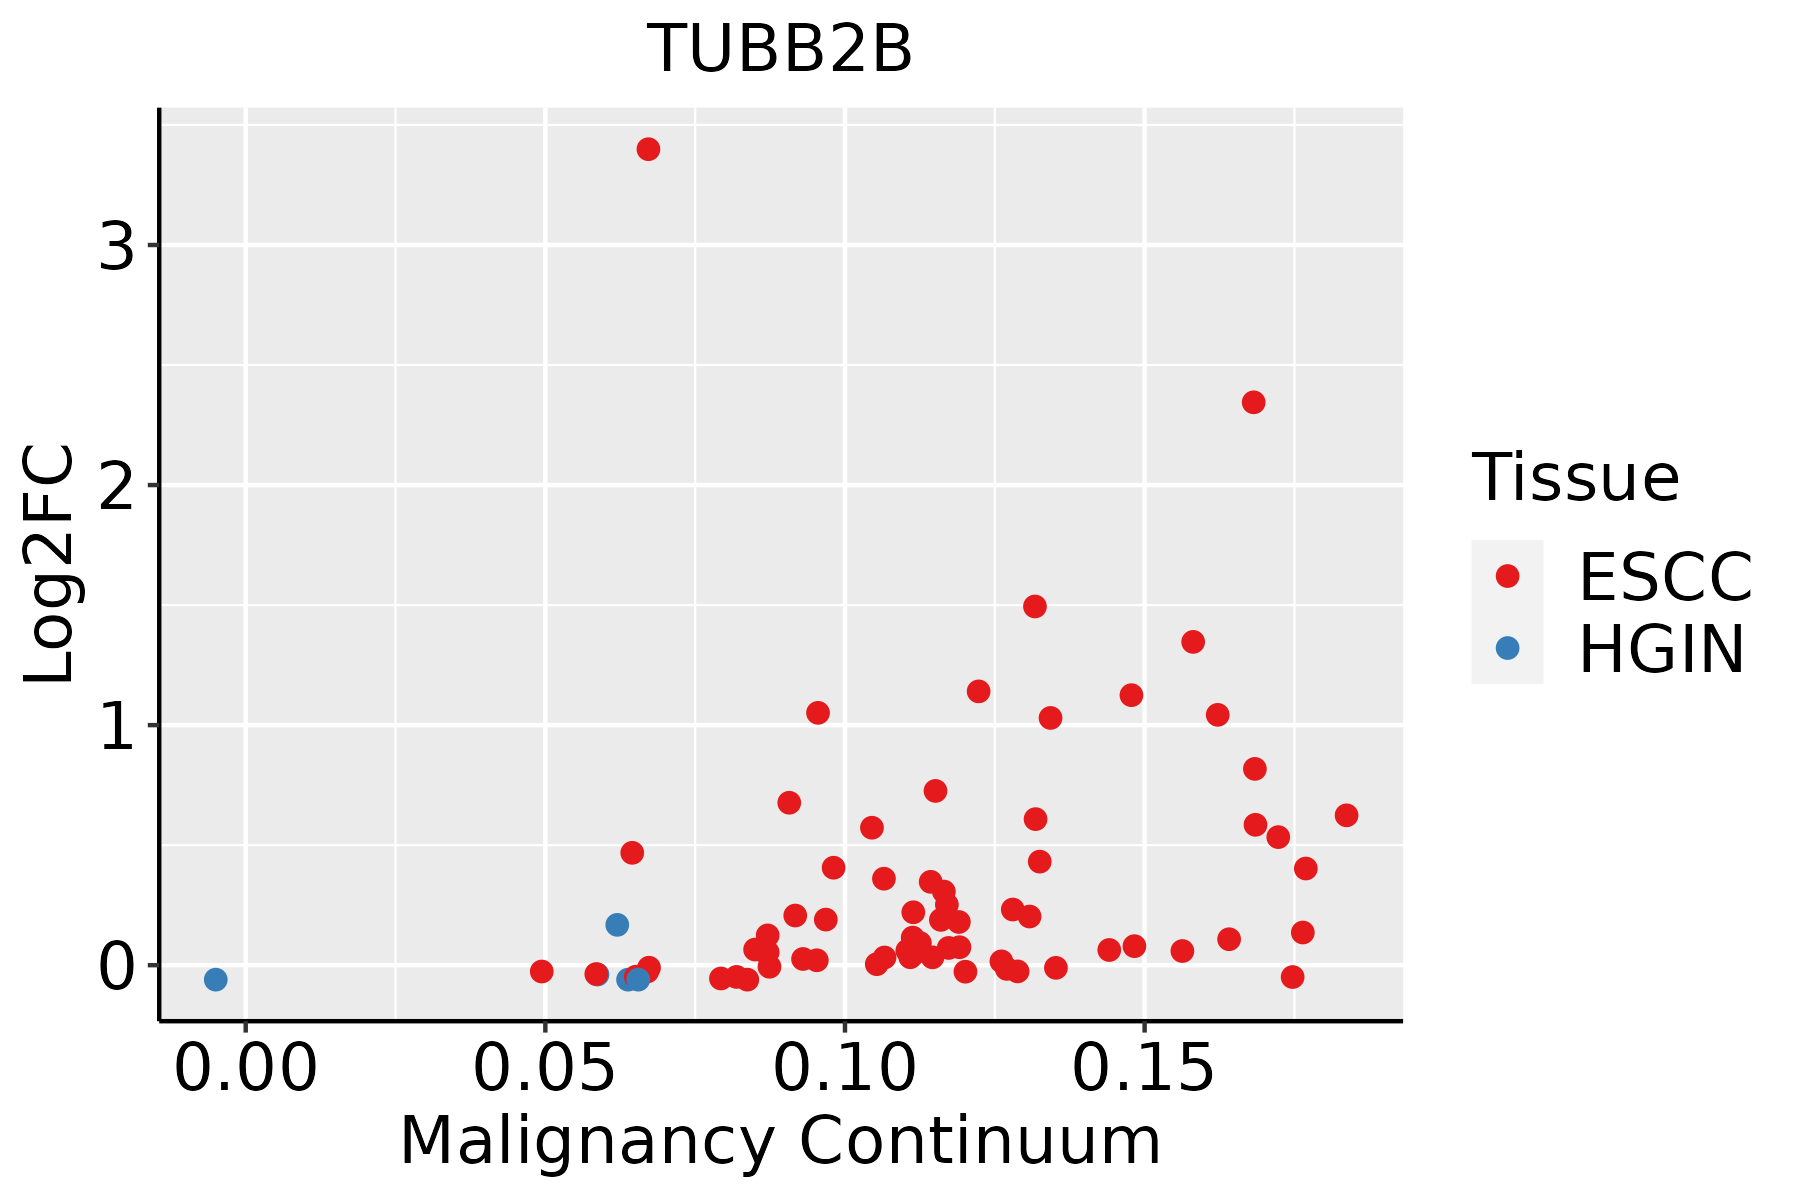 | ESCC: Esophageal squamous cell carcinoma |
| HGIN: High-grade intraepithelial neoplasias | ||
| LGIN: Low-grade intraepithelial neoplasias | ||
| Liver |  | HCC: Hepatocellular carcinoma |
| NAFLD: Non-alcoholic fatty liver disease | ||
| Oral Cavity | 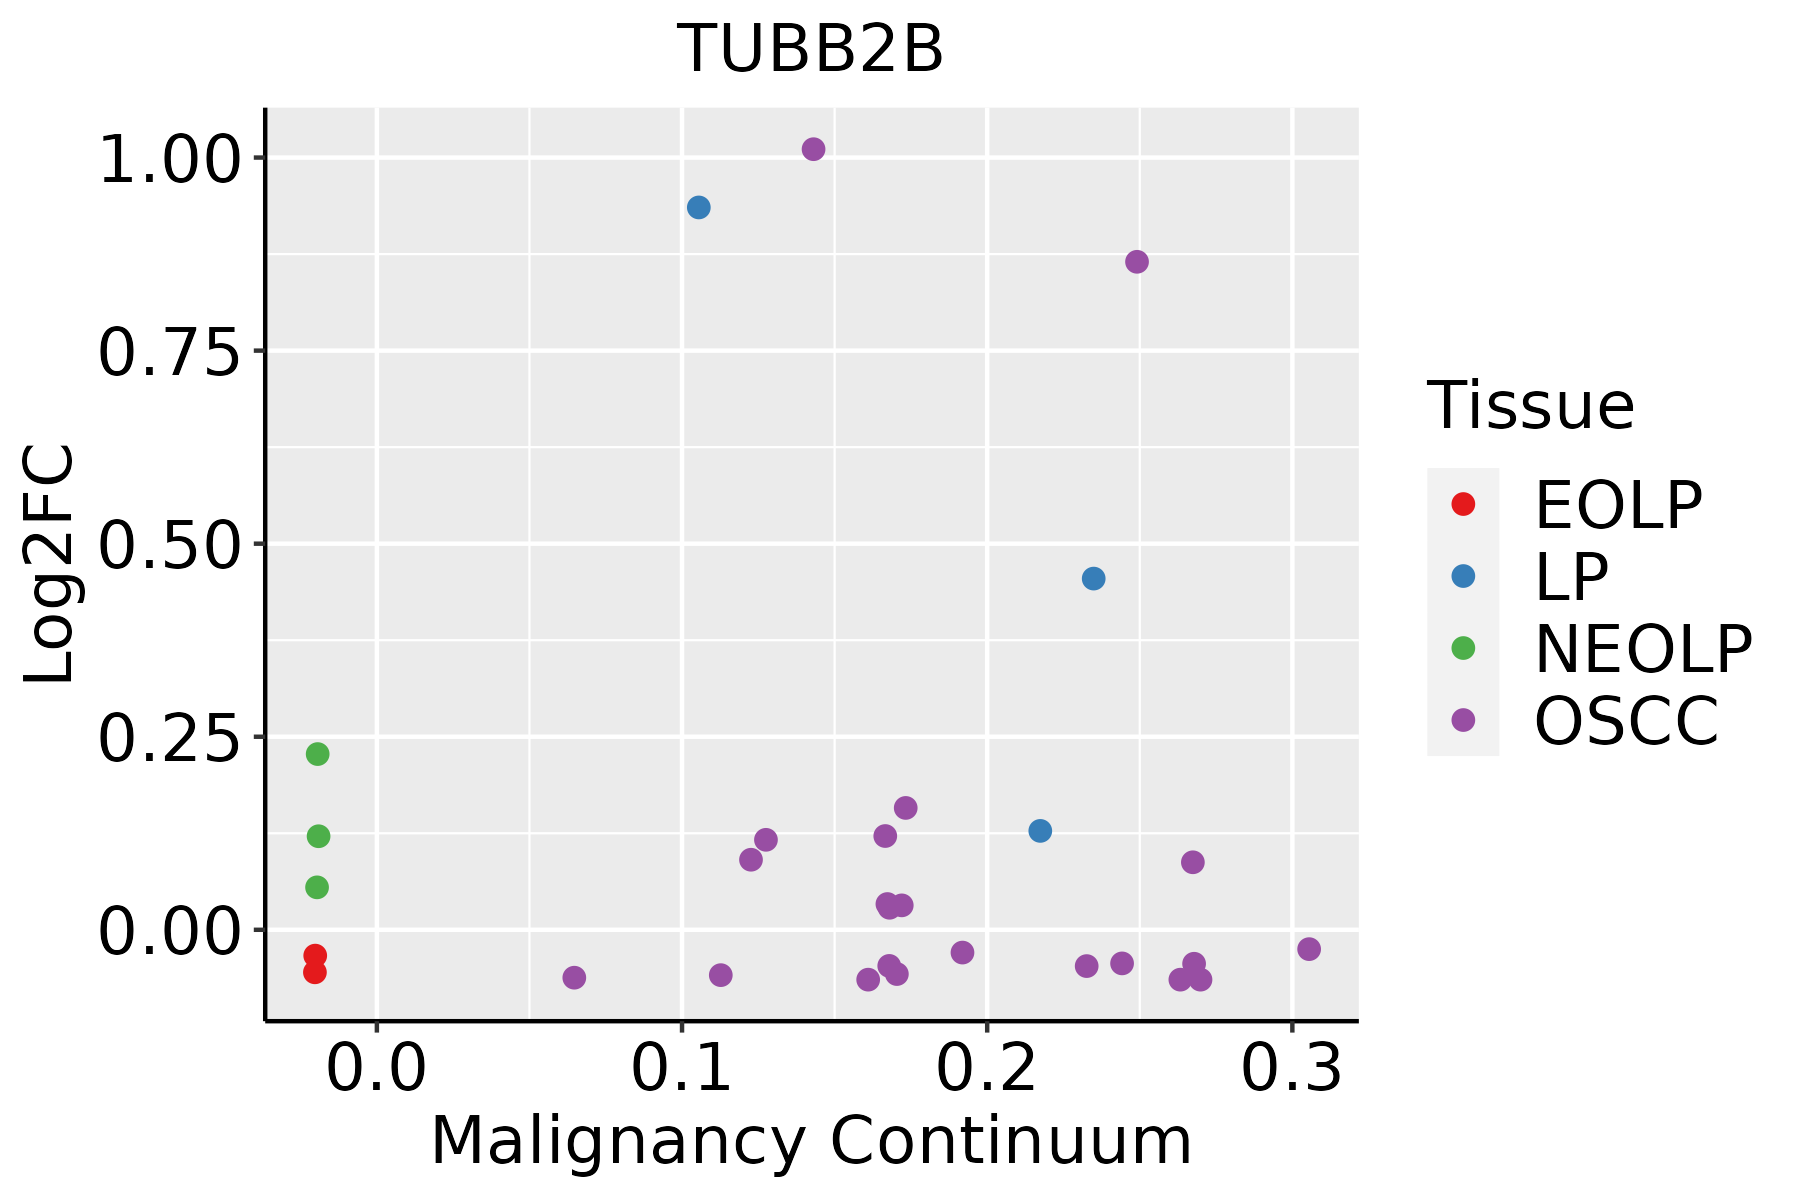 | EOLP: Erosive Oral lichen planus |
| LP: leukoplakia | ||
| NEOLP: Non-erosive oral lichen planus | ||
| OSCC: Oral squamous cell carcinoma | ||
| Thyroid | 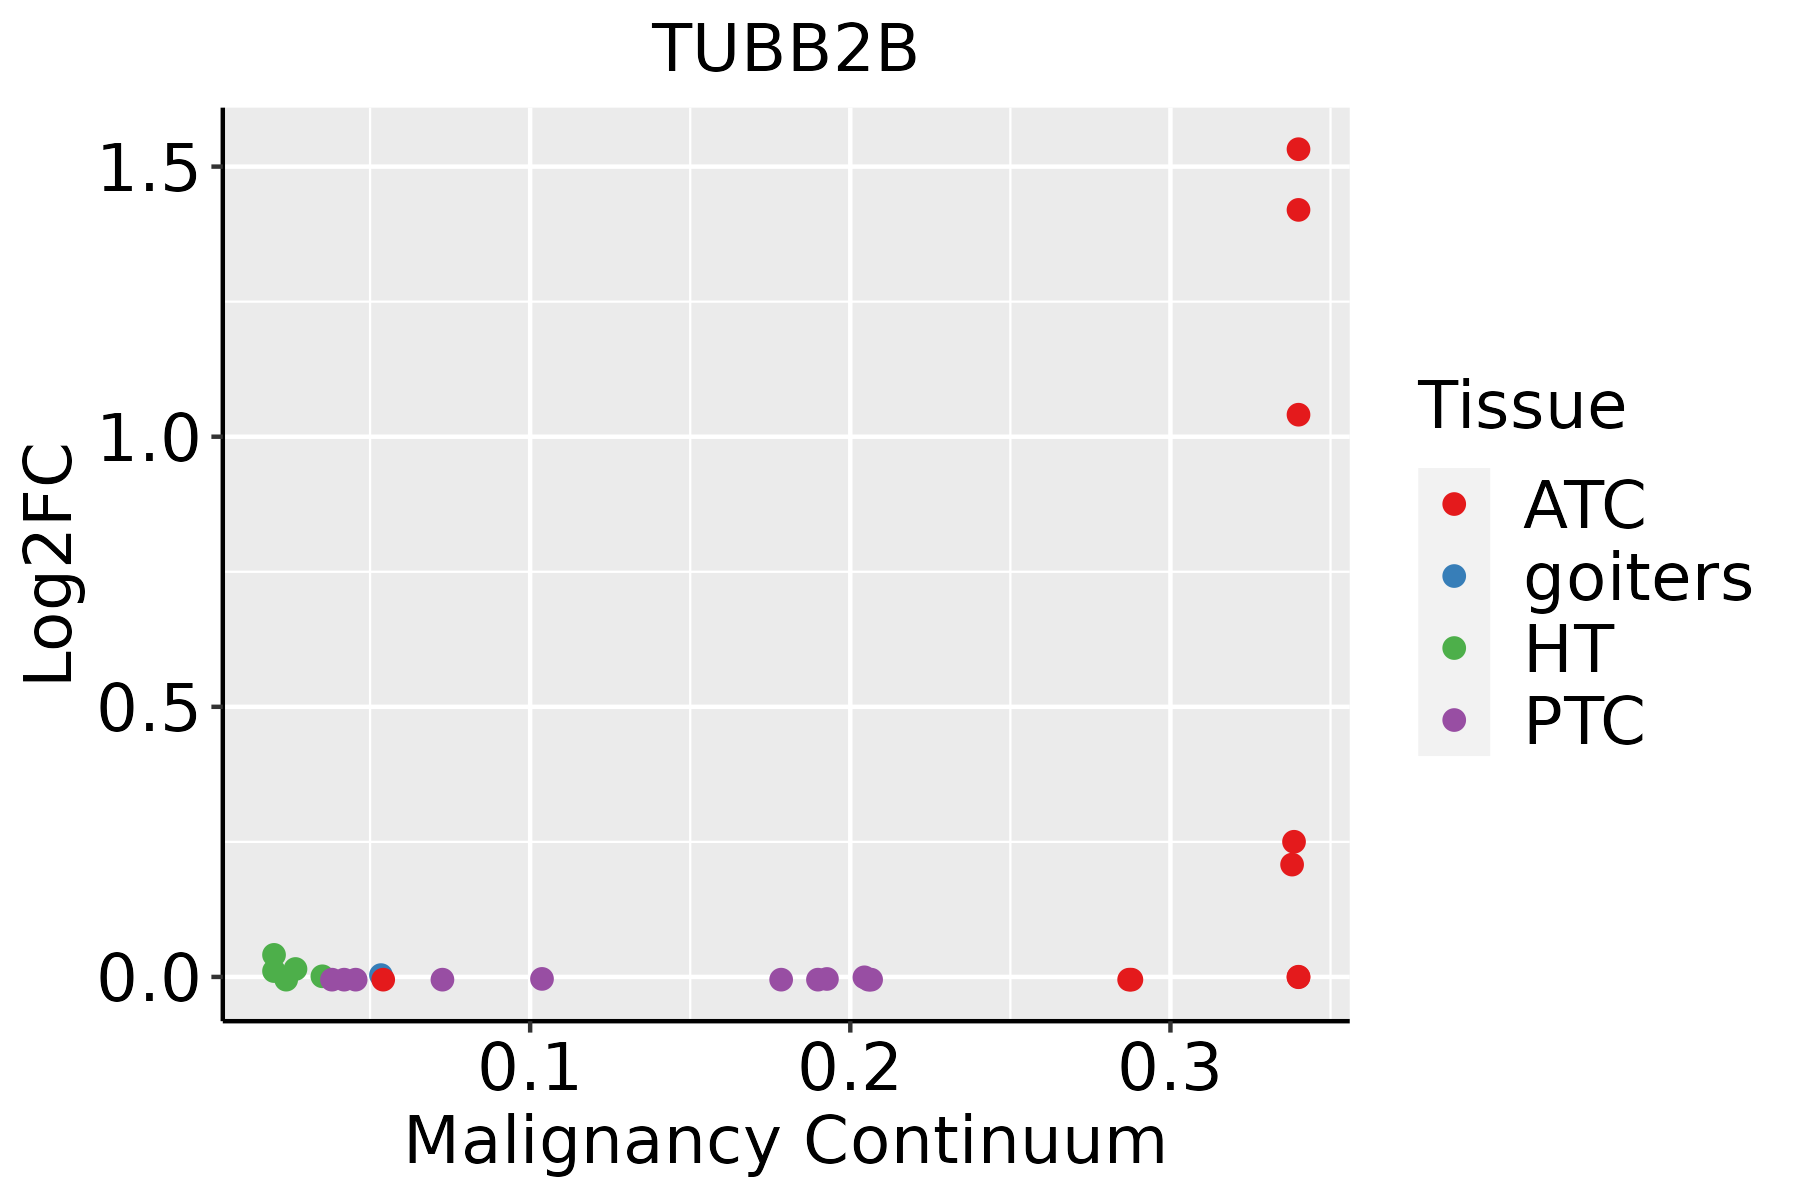 | ATC: Anaplastic thyroid cancer |
| HT: Hashimoto's thyroiditis | ||
| PTC: Papillary thyroid cancer |
| ∗log2FC in expression of this searched gene in stem-like cells from each diseased tissue sample relative to stem-like cells in normal samples in each tissue plotted against the malignancy continuum. Samples are colored based on if they are from different disease stage. |
Top |
Malignant transformation related pathway analysis |
| Find out the enriched GO biological processes and KEGG pathways involved in transition from healthy to precancer to cancer |
| Tissue | Disease Stage | Enriched GO biological Processes |
| Colorectum | AD |  |
| Colorectum | SER |  |
| Colorectum | MSS |  |
| Colorectum | MSI-H |  |
| Colorectum | FAP |  |
| ∗Top 15 enriched GO BP terms are showed in the bar plot of each disease state in each tissue. Each row represents a significant GO biological process which is colored according to the -log10(p.adjust). |
| Page: 1 2 3 4 5 6 7 8 9 |
| GO ID | Tissue | Disease Stage | Description | Gene Ratio | Bg Ratio | pvalue | p.adjust | Count |
| GO:006156415 | Esophagus | ESCC | axon development | 251/8552 | 467/18723 | 2.41e-04 | 1.49e-03 | 251 |
| GO:00485687 | Esophagus | ESCC | embryonic organ development | 228/8552 | 427/18723 | 7.28e-04 | 3.79e-03 | 228 |
| GO:000740915 | Esophagus | ESCC | axonogenesis | 219/8552 | 418/18723 | 3.14e-03 | 1.31e-02 | 219 |
| GO:00509204 | Oral cavity | OSCC | regulation of chemotaxis | 105/7305 | 223/18723 | 8.27e-03 | 3.01e-02 | 105 |
| GO:006156410 | Oral cavity | OSCC | axon development | 207/7305 | 467/18723 | 1.01e-02 | 3.51e-02 | 207 |
| GO:006156423 | Thyroid | ATC | axon development | 220/6293 | 467/18723 | 6.85e-10 | 1.80e-08 | 220 |
| GO:000740919 | Thyroid | ATC | axonogenesis | 197/6293 | 418/18723 | 5.09e-09 | 1.13e-07 | 197 |
| GO:00509206 | Thyroid | ATC | regulation of chemotaxis | 99/6293 | 223/18723 | 4.91e-04 | 2.86e-03 | 99 |
| GO:00485688 | Thyroid | ATC | embryonic organ development | 172/6293 | 427/18723 | 2.08e-03 | 9.84e-03 | 172 |
| GO:00074113 | Thyroid | ATC | axon guidance | 96/6293 | 227/18723 | 3.74e-03 | 1.63e-02 | 96 |
| GO:00974853 | Thyroid | ATC | neuron projection guidance | 96/6293 | 228/18723 | 4.36e-03 | 1.81e-02 | 96 |
| Page: 1 |
| Pathway ID | Tissue | Disease Stage | Description | Gene Ratio | Bg Ratio | pvalue | p.adjust | qvalue | Count |
| hsa05014210 | Esophagus | ESCC | Amyotrophic lateral sclerosis | 266/4205 | 364/8465 | 1.31e-20 | 2.20e-18 | 1.13e-18 | 266 |
| hsa05132211 | Esophagus | ESCC | Salmonella infection | 191/4205 | 249/8465 | 6.51e-19 | 5.45e-17 | 2.79e-17 | 191 |
| hsa05016210 | Esophagus | ESCC | Huntington disease | 226/4205 | 306/8465 | 1.38e-18 | 8.72e-17 | 4.46e-17 | 226 |
| hsa05012211 | Esophagus | ESCC | Parkinson disease | 201/4205 | 266/8465 | 1.56e-18 | 8.72e-17 | 4.46e-17 | 201 |
| hsa05022210 | Esophagus | ESCC | Pathways of neurodegeneration - multiple diseases | 318/4205 | 476/8465 | 6.10e-15 | 2.04e-13 | 1.05e-13 | 318 |
| hsa05010210 | Esophagus | ESCC | Alzheimer disease | 263/4205 | 384/8465 | 1.80e-14 | 5.47e-13 | 2.80e-13 | 263 |
| hsa05020210 | Esophagus | ESCC | Prion disease | 193/4205 | 273/8465 | 6.42e-13 | 1.34e-11 | 6.89e-12 | 193 |
| hsa05130211 | Esophagus | ESCC | Pathogenic Escherichia coli infection | 142/4205 | 197/8465 | 8.21e-11 | 1.06e-09 | 5.42e-10 | 142 |
| hsa0414530 | Esophagus | ESCC | Phagosome | 100/4205 | 152/8465 | 3.81e-05 | 1.72e-04 | 8.82e-05 | 100 |
| hsa0501438 | Esophagus | ESCC | Amyotrophic lateral sclerosis | 266/4205 | 364/8465 | 1.31e-20 | 2.20e-18 | 1.13e-18 | 266 |
| hsa05132310 | Esophagus | ESCC | Salmonella infection | 191/4205 | 249/8465 | 6.51e-19 | 5.45e-17 | 2.79e-17 | 191 |
| hsa0501638 | Esophagus | ESCC | Huntington disease | 226/4205 | 306/8465 | 1.38e-18 | 8.72e-17 | 4.46e-17 | 226 |
| hsa05012310 | Esophagus | ESCC | Parkinson disease | 201/4205 | 266/8465 | 1.56e-18 | 8.72e-17 | 4.46e-17 | 201 |
| hsa0502238 | Esophagus | ESCC | Pathways of neurodegeneration - multiple diseases | 318/4205 | 476/8465 | 6.10e-15 | 2.04e-13 | 1.05e-13 | 318 |
| hsa0501038 | Esophagus | ESCC | Alzheimer disease | 263/4205 | 384/8465 | 1.80e-14 | 5.47e-13 | 2.80e-13 | 263 |
| hsa0502038 | Esophagus | ESCC | Prion disease | 193/4205 | 273/8465 | 6.42e-13 | 1.34e-11 | 6.89e-12 | 193 |
| hsa05130310 | Esophagus | ESCC | Pathogenic Escherichia coli infection | 142/4205 | 197/8465 | 8.21e-11 | 1.06e-09 | 5.42e-10 | 142 |
| hsa04145114 | Esophagus | ESCC | Phagosome | 100/4205 | 152/8465 | 3.81e-05 | 1.72e-04 | 8.82e-05 | 100 |
| hsa0501214 | Liver | Cirrhotic | Parkinson disease | 158/2530 | 266/8465 | 3.62e-24 | 6.02e-22 | 3.71e-22 | 158 |
| hsa0501614 | Liver | Cirrhotic | Huntington disease | 172/2530 | 306/8465 | 1.65e-22 | 1.10e-20 | 6.77e-21 | 172 |
| Page: 1 2 3 4 |
Top |
Cell-cell communication analysis |
| Identification of potential cell-cell interactions between two cell types and their ligand-receptor pairs for different disease states |
| Ligand | Receptor | LRpair | Pathway | Tissue | Disease Stage |
| Page: 1 |
Top |
Single-cell gene regulatory network inference analysis |
| Find out the significant the regulons (TFs) and the target genes of each regulon across cell types for different disease states |
| TF | Cell Type | Tissue | Disease Stage | Target Gene | RSS | Regulon Activity |
| ∗The dot plots of a searched regulon are shown for all cell subpopulations in each disease state of each tissue based on the regulon specific score inferred using pySCENIC and by calculating the average expression. |
| Page: 1 |
Top |
Somatic mutation of malignant transformation related genes |
| Annotation of somatic variants for genes involved in malignant transformation |
| Hugo Symbol | Variant Class | Variant Classification | dbSNP RS | HGVSc | HGVSp | HGVSp Short | SWISSPROT | BIOTYPE | SIFT | PolyPhen | Tumor Sample Barcode | Tissue | Histology | Sex | Age | Stage | Therapy Types | Drugs | Outcome |
| TUBB2B | SNV | Missense_Mutation | c.629N>G | p.Ile210Ser | p.I210S | Q9BVA1 | protein_coding | deleterious_low_confidence(0) | probably_damaging(0.999) | TCGA-A8-A09Z-01 | Breast | breast invasive carcinoma | Female | >=65 | I/II | Unknown | Unknown | SD | |
| TUBB2B | SNV | Missense_Mutation | c.443N>A | p.Gly148Asp | p.G148D | Q9BVA1 | protein_coding | deleterious_low_confidence(0.01) | possibly_damaging(0.793) | TCGA-AN-A0AK-01 | Breast | breast invasive carcinoma | Female | >=65 | I/II | Unknown | Unknown | SD | |
| TUBB2B | insertion | Nonsense_Mutation | novel | c.1150_1151insCTGATTTGGGATGAAAT | p.Gln384ProfsTer5 | p.Q384Pfs*5 | Q9BVA1 | protein_coding | TCGA-A8-A08H-01 | Breast | breast invasive carcinoma | Female | >=65 | I/II | Unknown | Unknown | SD | ||
| TUBB2B | SNV | Missense_Mutation | novel | c.563N>T | p.Ser188Leu | p.S188L | Q9BVA1 | protein_coding | deleterious_low_confidence(0) | probably_damaging(0.949) | TCGA-AA-3864-01 | Colorectum | colon adenocarcinoma | Male | >=65 | I/II | Unknown | Unknown | SD |
| TUBB2B | SNV | Missense_Mutation | novel | c.484N>T | p.Arg162Cys | p.R162C | Q9BVA1 | protein_coding | deleterious_low_confidence(0.02) | probably_damaging(0.991) | TCGA-AA-3947-01 | Colorectum | colon adenocarcinoma | Female | <65 | I/II | Unknown | Unknown | SD |
| TUBB2B | SNV | Missense_Mutation | novel | c.638N>A | p.Arg213His | p.R213H | Q9BVA1 | protein_coding | deleterious_low_confidence(0.04) | probably_damaging(0.952) | TCGA-AA-3966-01 | Colorectum | colon adenocarcinoma | Female | >=65 | I/II | Unknown | Unknown | SD |
| TUBB2B | SNV | Missense_Mutation | c.503G>A | p.Ser168Asn | p.S168N | Q9BVA1 | protein_coding | deleterious_low_confidence(0) | benign(0.052) | TCGA-AA-A01R-01 | Colorectum | colon adenocarcinoma | Male | <65 | III/IV | Chemotherapy | 5-fluorouracil | PD | |
| TUBB2B | SNV | Missense_Mutation | rs779519065 | c.496N>T | p.Thr166Ser | p.T166S | Q9BVA1 | protein_coding | tolerated_low_confidence(0.17) | benign(0.039) | TCGA-AG-4022-01 | Colorectum | rectum adenocarcinoma | Female | <65 | I/II | Chemotherapy | 5-fluorouracil | CR |
| TUBB2B | SNV | Missense_Mutation | novel | c.784N>T | p.Arg262Cys | p.R262C | Q9BVA1 | protein_coding | deleterious_low_confidence(0.02) | probably_damaging(0.985) | TCGA-A5-A0G2-01 | Endometrium | uterine corpus endometrioid carcinoma | Female | <65 | III/IV | Unknown | Unknown | SD |
| TUBB2B | SNV | Missense_Mutation | c.442G>A | p.Gly148Ser | p.G148S | Q9BVA1 | protein_coding | deleterious_low_confidence(0) | probably_damaging(0.986) | TCGA-AP-A0LD-01 | Endometrium | uterine corpus endometrioid carcinoma | Female | <65 | I/II | Unknown | Unknown | SD |
| Page: 1 2 3 4 |
Top |
Related drugs of malignant transformation related genes |
| Identification of chemicals and drugs interact with genes involved in malignant transfromation |
| (DGIdb 4.0) |
| Entrez ID | Symbol | Category | Interaction Types | Drug Claim Name | Drug Name | PMIDs |
| 347733 | TUBB2B | DRUGGABLE GENOME | inhibitor | CHEMBL1742994 | BRENTUXIMAB VEDOTIN | |
| 347733 | TUBB2B | DRUGGABLE GENOME | PODOFILOX | PODOFILOX | 17765552,24953821,21402478 | |
| 347733 | TUBB2B | DRUGGABLE GENOME | CYCLOSTREPTIN | CYCLOSTREPTIN | 17206139 | |
| 347733 | TUBB2B | DRUGGABLE GENOME | NSC-751382 | CHEMBL1935538 | 22435708 | |
| 347733 | TUBB2B | DRUGGABLE GENOME | 4-(PHENYLCARBAMOYL)BENZYLNITRATE | CHEMBL1795737 | 21664138 | |
| 347733 | TUBB2B | DRUGGABLE GENOME | CHEMBL2304041 | SAGOPILONE | ||
| 347733 | TUBB2B | DRUGGABLE GENOME | CHEMBL492399 | VERUBULIN | ||
| 347733 | TUBB2B | DRUGGABLE GENOME | inhibitor | CHEMBL289351 | FOSBRETABULIN DISODIUM | |
| 347733 | TUBB2B | DRUGGABLE GENOME | ZAMPANOLIDE | ZAMPANOLIDE | 19877653 | |
| 347733 | TUBB2B | DRUGGABLE GENOME | ABT-751 | ABT-751 | 25468039 |
| Page: 1 2 3 4 5 |

Copyright 2023-Present -The University of Texas Health Science Center at Houston |