
|
|||||
|
 | |
| |
| |
| |
| |
| |
|
Gene: TUBB2A |
Gene summary for TUBB2A |
| Gene information | Species | Human | Gene symbol | TUBB2A | Gene ID | 7280 |
| Gene name | tubulin beta 2A class IIa | |
| Gene Alias | CDCBM5 | |
| Cytomap | 6p25.2 | |
| Gene Type | protein-coding | GO ID | GO:0000226 | UniProtAcc | Q13885 |
Top |
Malignant transformation analysis |
| Identification of the aberrant gene expression in precancerous and cancerous lesions by comparing the gene expression of stem-like cells in diseased tissues with normal stem cells |
| Entrez ID | Symbol | Replicates | Species | Organ | Tissue | Adj P-value | Log2FC | Malignancy |
| 7280 | TUBB2A | HSIL_HPV_1 | Human | Cervix | HSIL_HPV | 2.91e-02 | -1.79e-01 | 0.0116 |
| 7280 | TUBB2A | HTA11_2487_2000001011 | Human | Colorectum | SER | 1.71e-09 | 5.38e-01 | -0.1808 |
| 7280 | TUBB2A | HTA11_1938_2000001011 | Human | Colorectum | AD | 4.47e-04 | 2.22e-01 | -0.0811 |
| 7280 | TUBB2A | HTA11_411_2000001011 | Human | Colorectum | SER | 2.15e-02 | 1.01e+00 | -0.2602 |
| 7280 | TUBB2A | HTA11_2112_2000001011 | Human | Colorectum | SER | 9.82e-07 | 6.25e-01 | -0.2196 |
| 7280 | TUBB2A | HTA11_696_2000001011 | Human | Colorectum | AD | 1.50e-02 | 1.33e-01 | -0.1464 |
| 7280 | TUBB2A | HTA11_1391_2000001011 | Human | Colorectum | AD | 2.78e-07 | 2.76e-01 | -0.059 |
| 7280 | TUBB2A | LZE4T | Human | Esophagus | ESCC | 1.30e-04 | 5.41e-01 | 0.0811 |
| 7280 | TUBB2A | LZE7T | Human | Esophagus | ESCC | 1.30e-15 | 1.99e+00 | 0.0667 |
| 7280 | TUBB2A | LZE8T | Human | Esophagus | ESCC | 1.43e-07 | 5.58e-01 | 0.067 |
| 7280 | TUBB2A | LZE20T | Human | Esophagus | ESCC | 9.52e-05 | 6.25e-01 | 0.0662 |
| 7280 | TUBB2A | LZE24T | Human | Esophagus | ESCC | 3.11e-27 | 1.70e+00 | 0.0596 |
| 7280 | TUBB2A | LZE21T | Human | Esophagus | ESCC | 1.29e-07 | 1.37e+00 | 0.0655 |
| 7280 | TUBB2A | LZE6T | Human | Esophagus | ESCC | 2.19e-04 | 2.10e-01 | 0.0845 |
| 7280 | TUBB2A | P1T-E | Human | Esophagus | ESCC | 1.82e-08 | 1.17e+00 | 0.0875 |
| 7280 | TUBB2A | P2T-E | Human | Esophagus | ESCC | 4.12e-07 | 3.60e-01 | 0.1177 |
| 7280 | TUBB2A | P4T-E | Human | Esophagus | ESCC | 5.59e-37 | 1.60e+00 | 0.1323 |
| 7280 | TUBB2A | P5T-E | Human | Esophagus | ESCC | 9.18e-21 | 9.31e-01 | 0.1327 |
| 7280 | TUBB2A | P8T-E | Human | Esophagus | ESCC | 7.35e-05 | 3.59e-01 | 0.0889 |
| 7280 | TUBB2A | P9T-E | Human | Esophagus | ESCC | 6.54e-15 | 6.52e-01 | 0.1131 |
| Page: 1 2 3 4 5 6 7 |
| Tissue | Expression Dynamics | Abbreviation |
| Cervix | 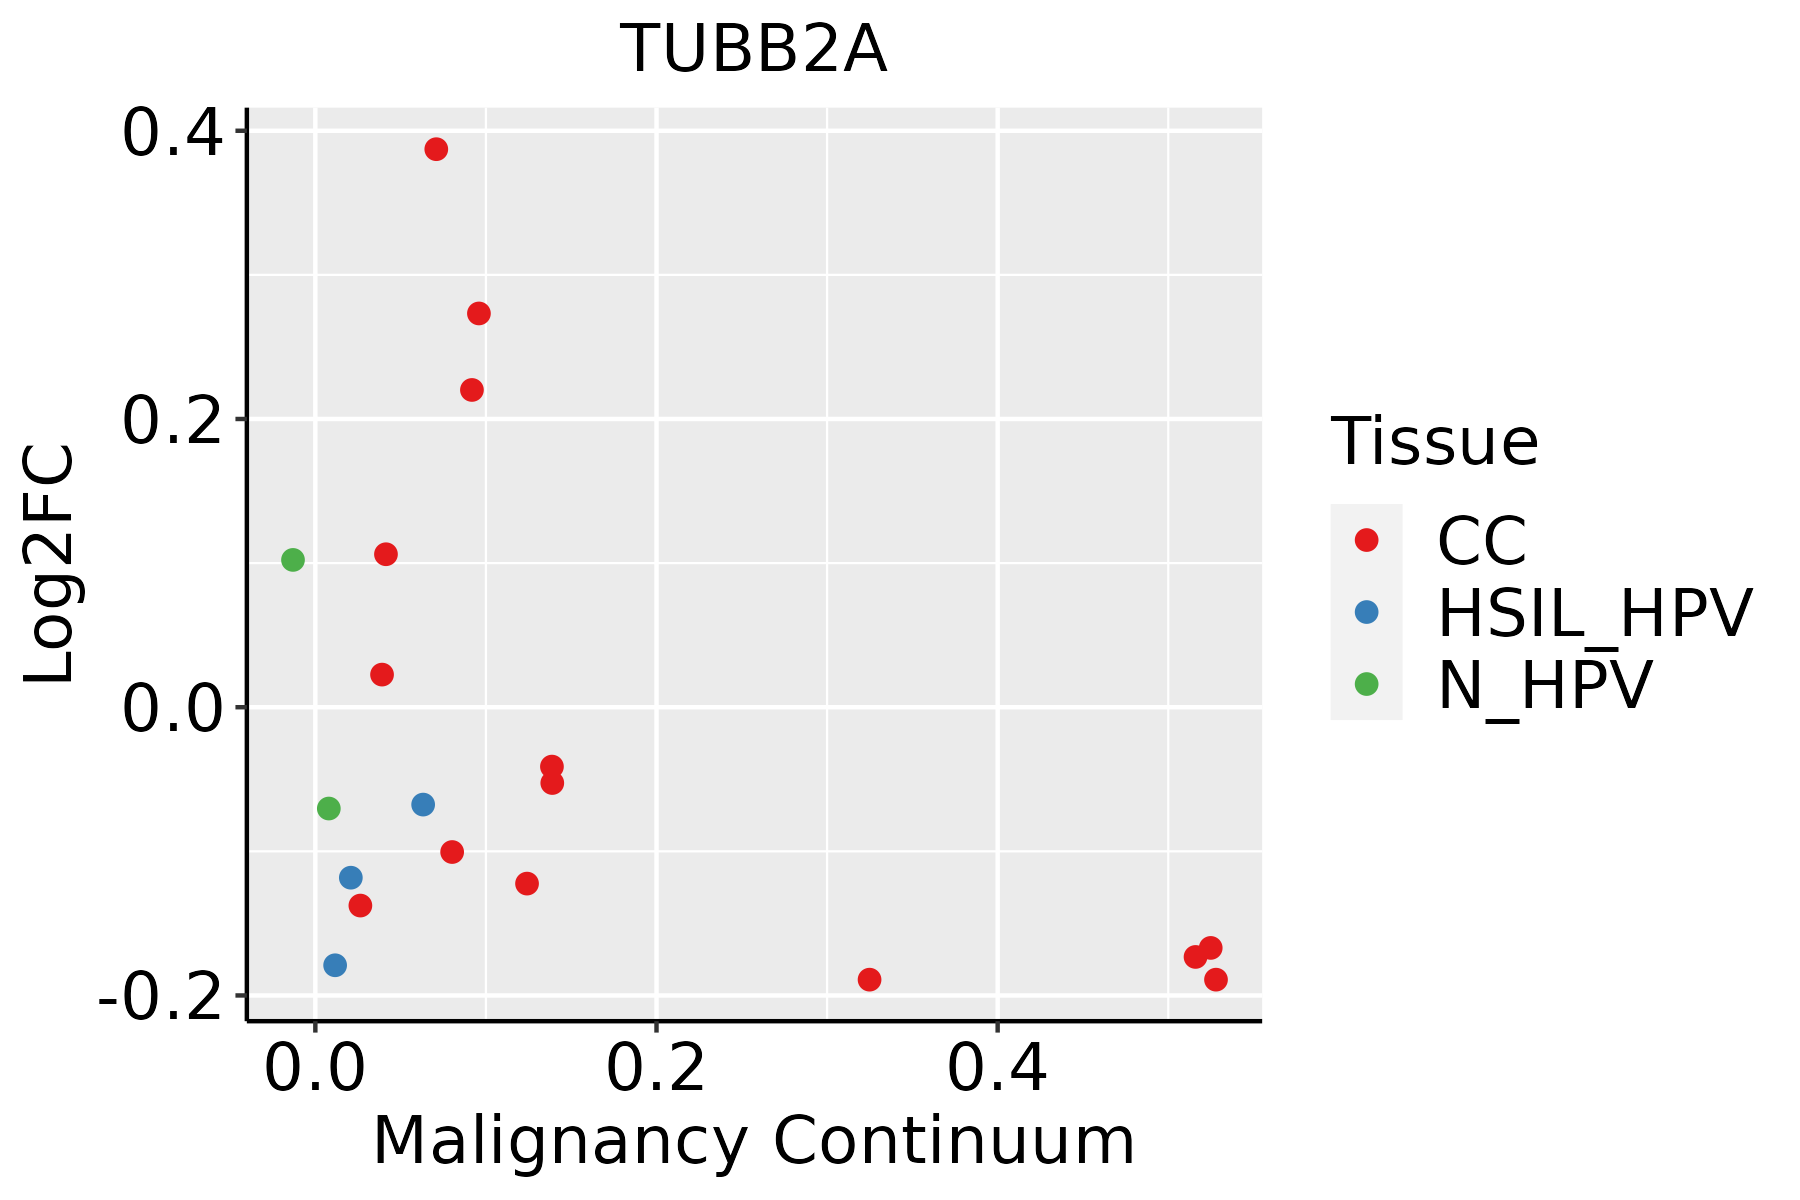 | CC: Cervix cancer |
| HSIL_HPV: HPV-infected high-grade squamous intraepithelial lesions | ||
| N_HPV: HPV-infected normal cervix | ||
| Colorectum (GSE201348) |  | FAP: Familial adenomatous polyposis |
| CRC: Colorectal cancer | ||
| Colorectum (HTA11) |  | AD: Adenomas |
| SER: Sessile serrated lesions | ||
| MSI-H: Microsatellite-high colorectal cancer | ||
| MSS: Microsatellite stable colorectal cancer | ||
| Esophagus |  | ESCC: Esophageal squamous cell carcinoma |
| HGIN: High-grade intraepithelial neoplasias | ||
| LGIN: Low-grade intraepithelial neoplasias | ||
| Liver | 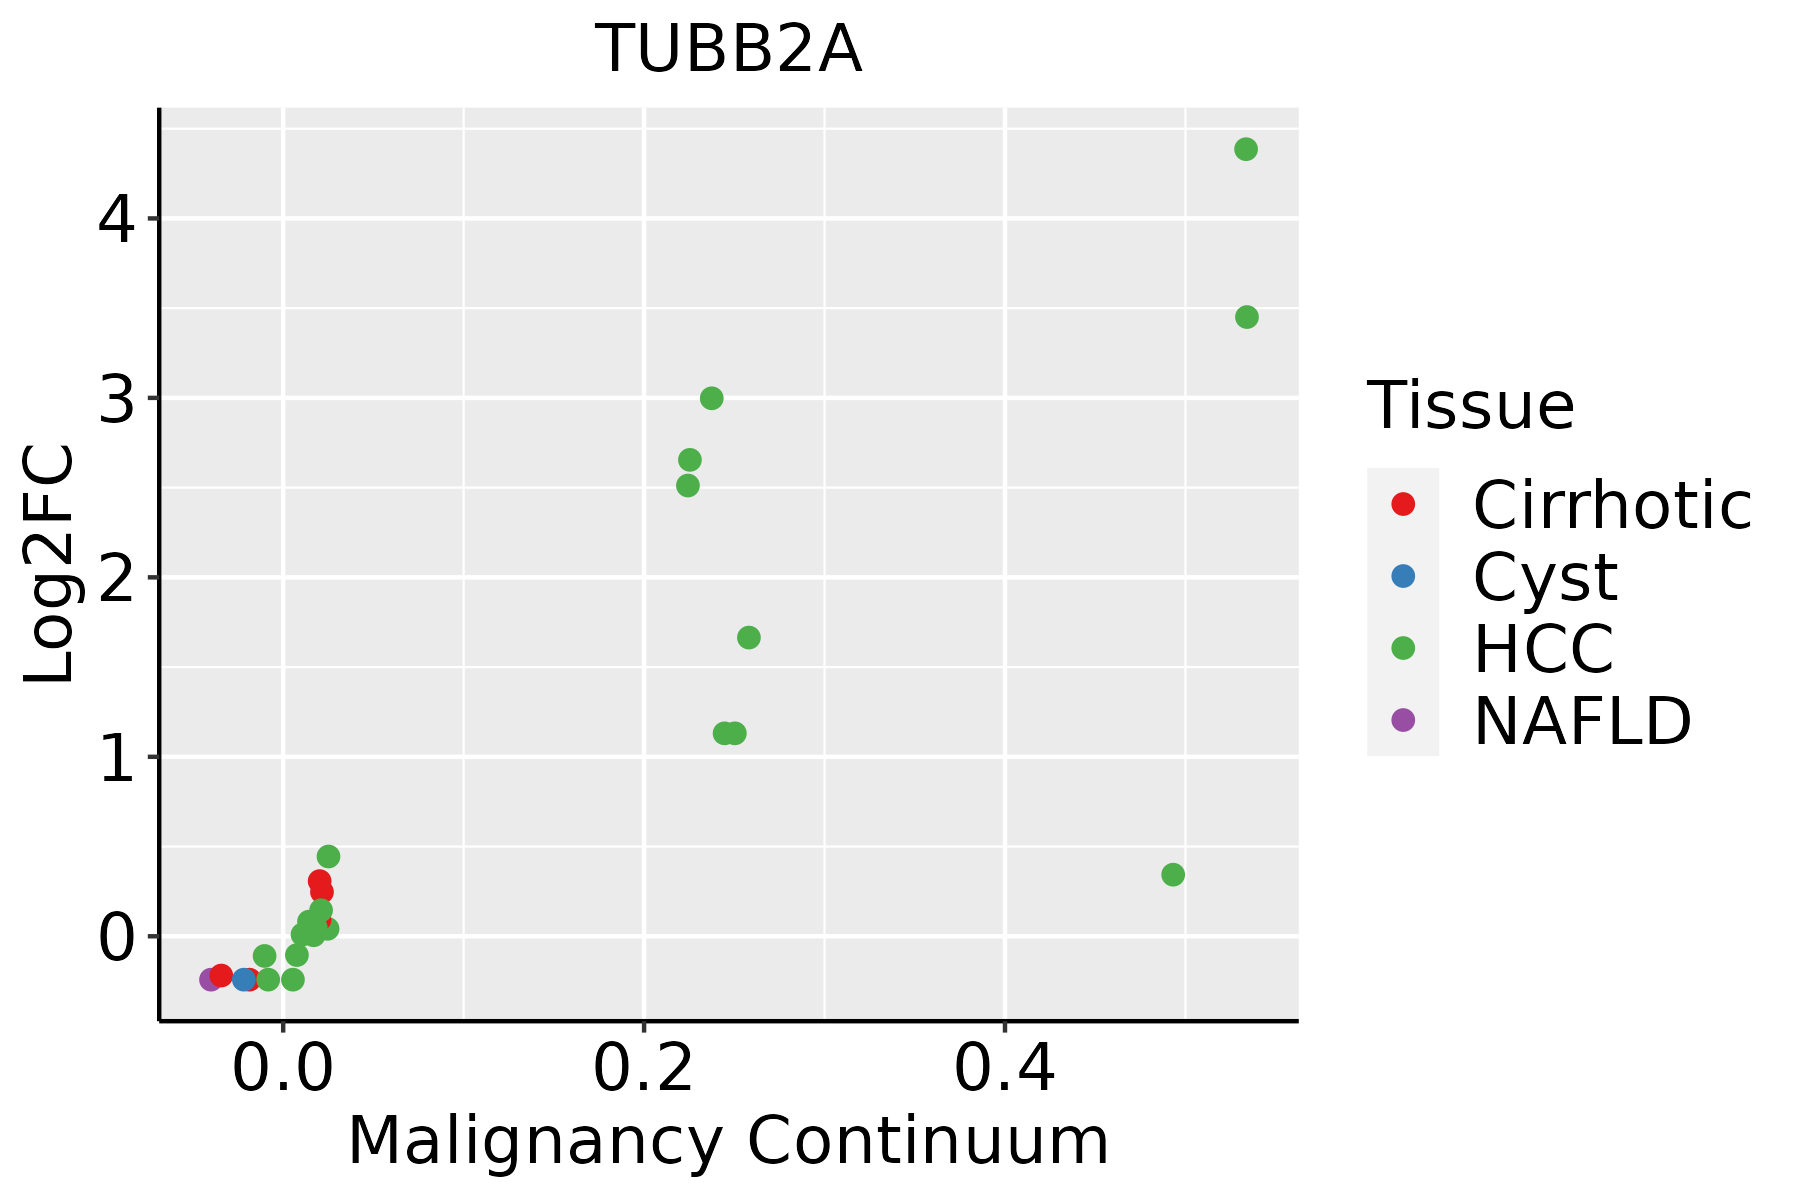 | HCC: Hepatocellular carcinoma |
| NAFLD: Non-alcoholic fatty liver disease | ||
| Oral Cavity | 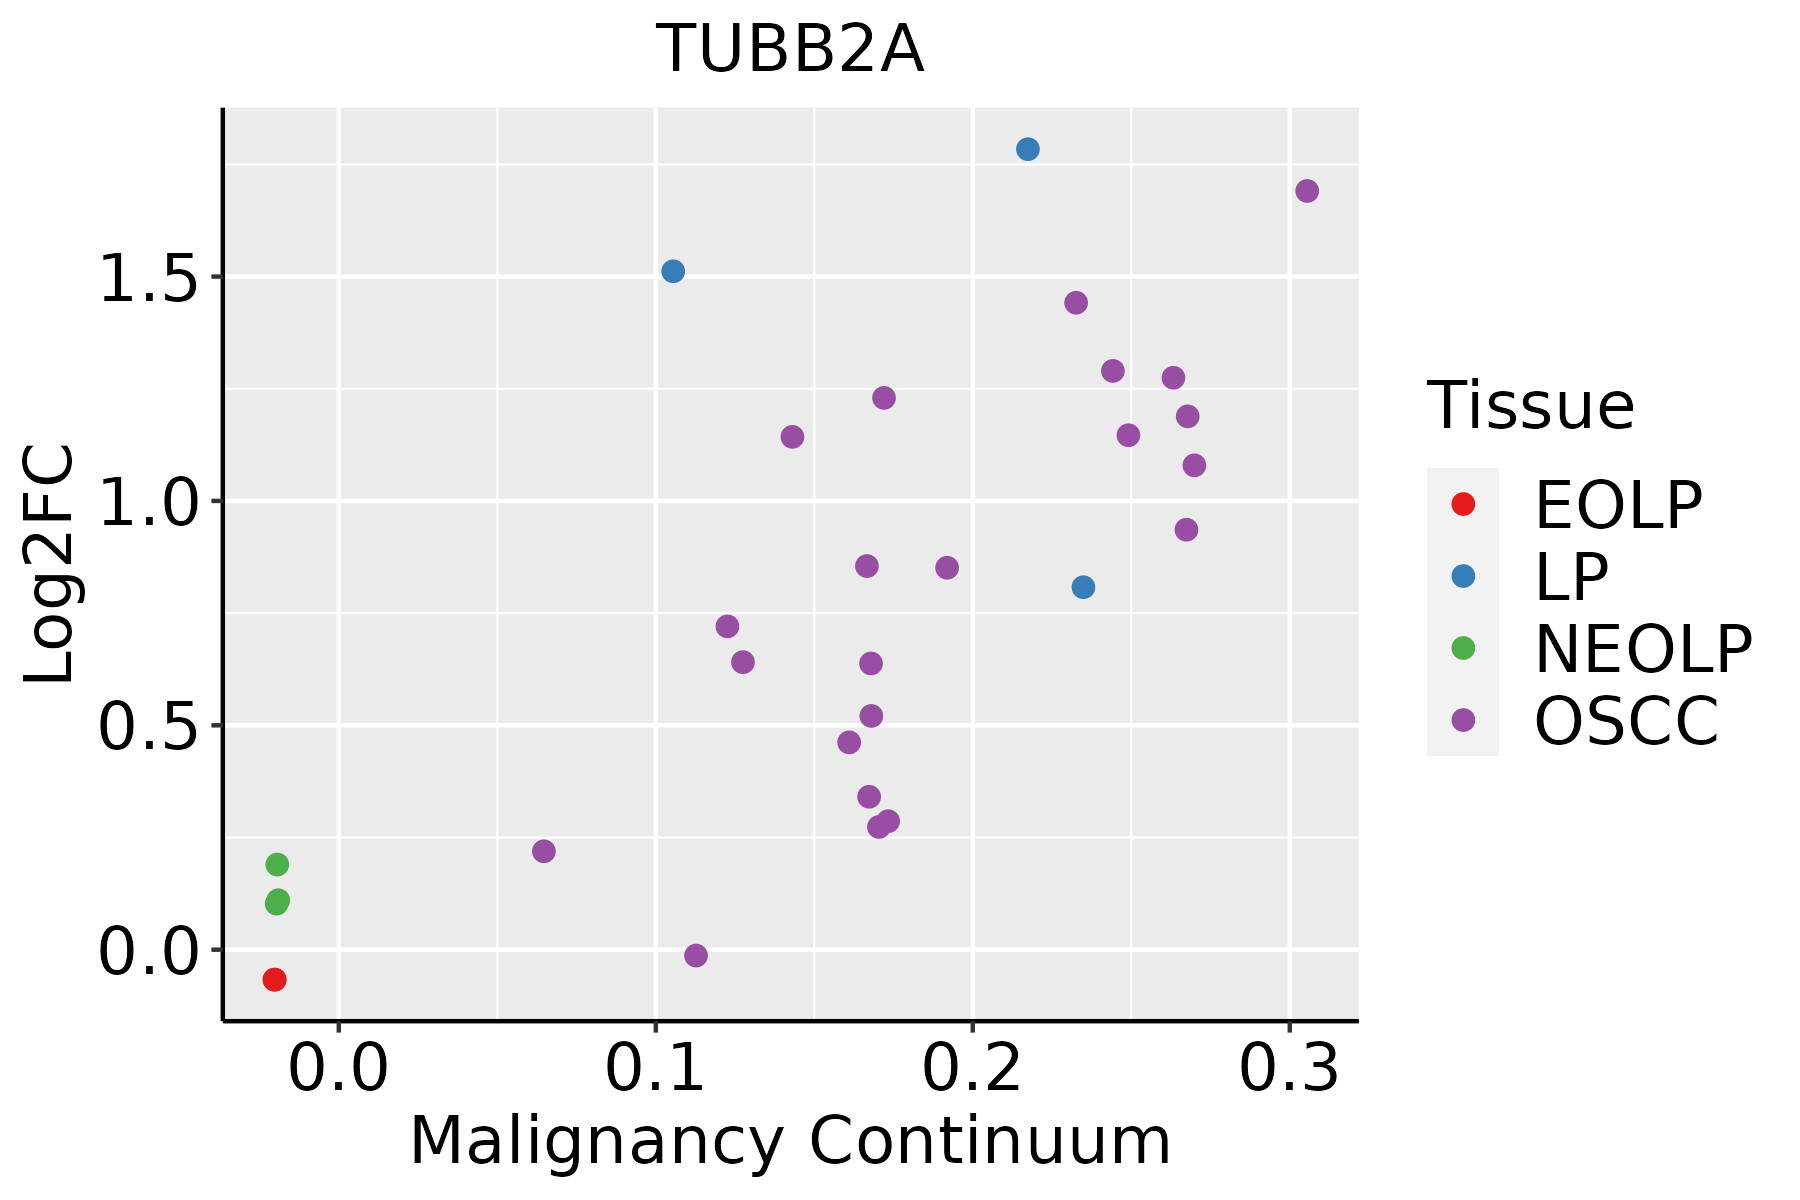 | EOLP: Erosive Oral lichen planus |
| LP: leukoplakia | ||
| NEOLP: Non-erosive oral lichen planus | ||
| OSCC: Oral squamous cell carcinoma | ||
| Prostate |  | BPH: Benign Prostatic Hyperplasia |
| Skin | 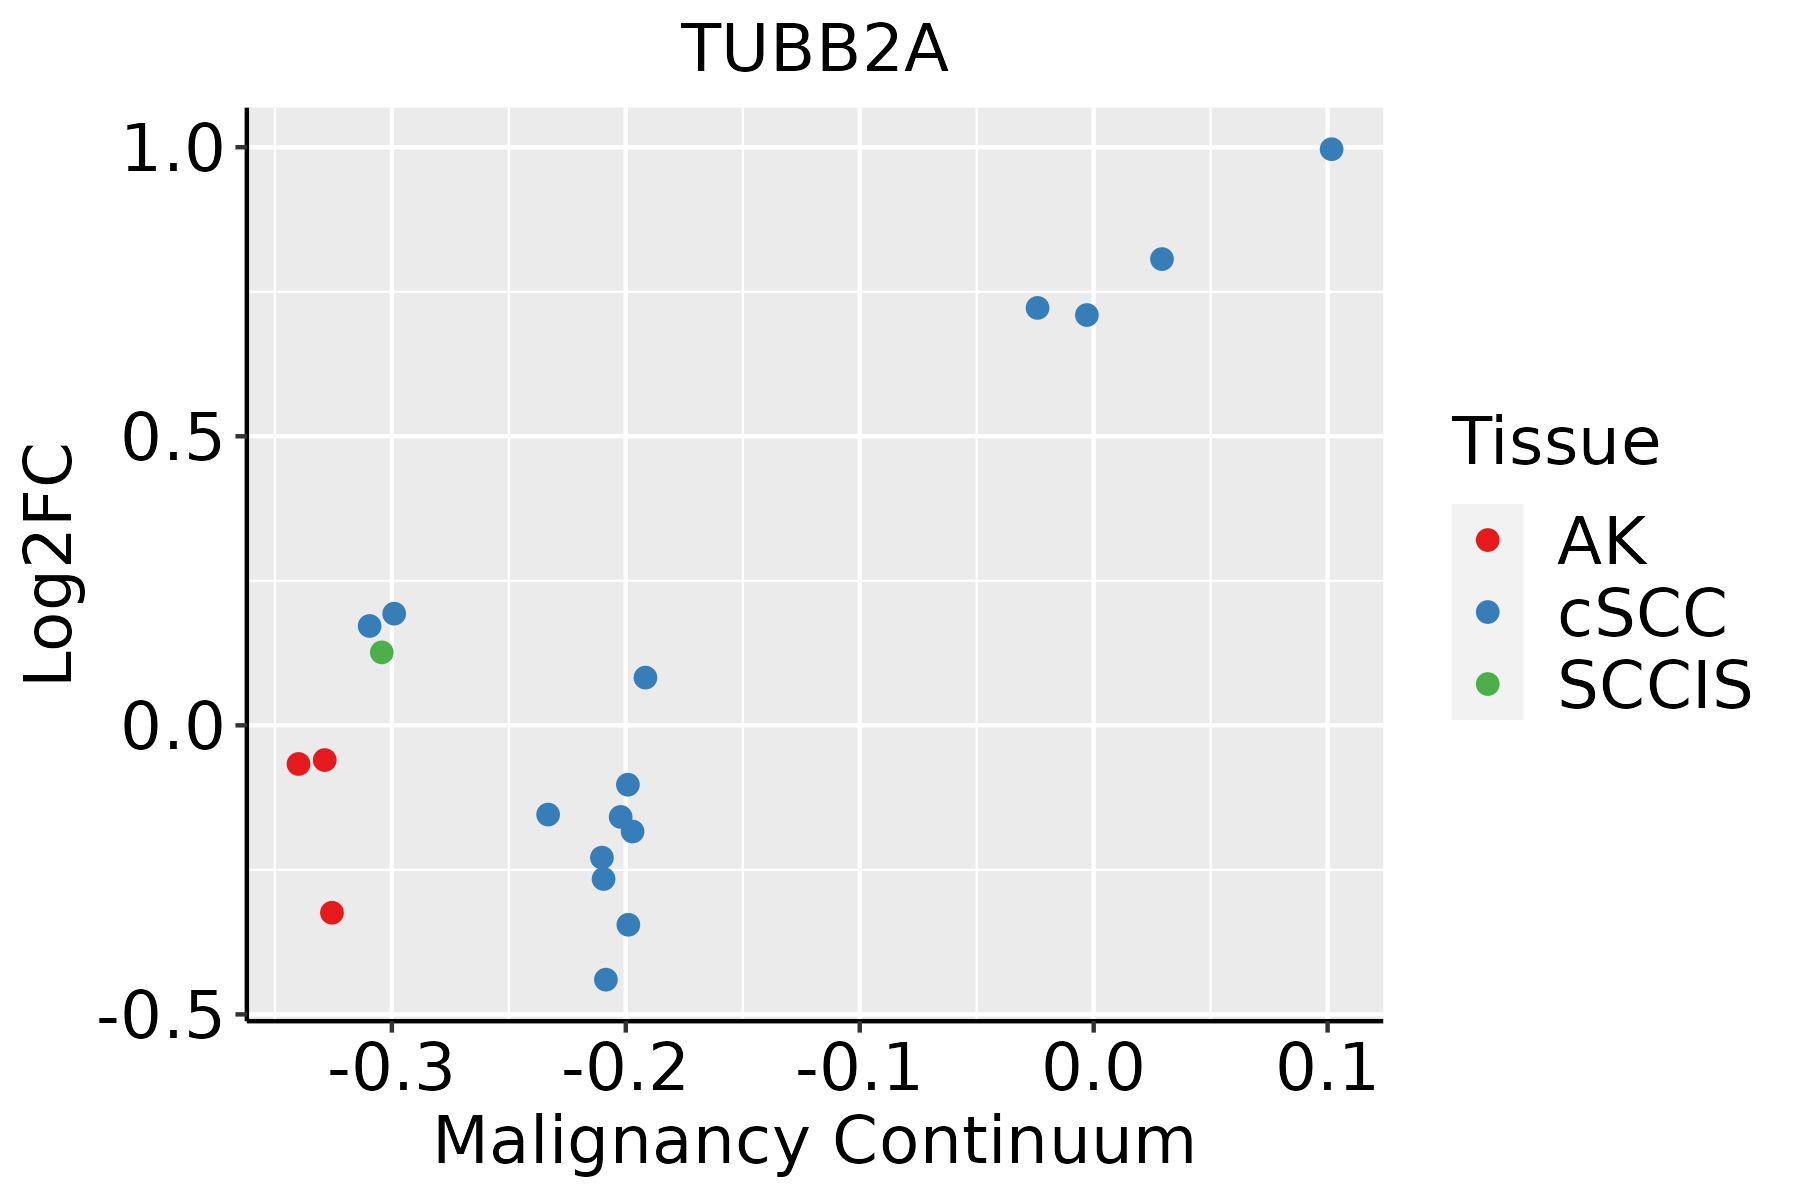 | AK: Actinic keratosis |
| cSCC: Cutaneous squamous cell carcinoma | ||
| SCCIS:squamous cell carcinoma in situ | ||
| Thyroid |  | ATC: Anaplastic thyroid cancer |
| HT: Hashimoto's thyroiditis | ||
| PTC: Papillary thyroid cancer |
| ∗log2FC in expression of this searched gene in stem-like cells from each diseased tissue sample relative to stem-like cells in normal samples in each tissue plotted against the malignancy continuum. Samples are colored based on if they are from different disease stage. |
Top |
Malignant transformation related pathway analysis |
| Find out the enriched GO biological processes and KEGG pathways involved in transition from healthy to precancer to cancer |
| Tissue | Disease Stage | Enriched GO biological Processes |
| Colorectum | AD |  |
| Colorectum | SER |  |
| Colorectum | MSS |  |
| Colorectum | MSI-H |  |
| Colorectum | FAP |  |
| ∗Top 15 enriched GO BP terms are showed in the bar plot of each disease state in each tissue. Each row represents a significant GO biological process which is colored according to the -log10(p.adjust). |
| Page: 1 2 3 4 5 6 7 8 9 |
| GO ID | Tissue | Disease Stage | Description | Gene Ratio | Bg Ratio | pvalue | p.adjust | Count |
| GO:00017644 | Skin | AK | neuron migration | 26/1910 | 156/18723 | 8.26e-03 | 4.13e-02 | 26 |
| Page: 1 |
| Pathway ID | Tissue | Disease Stage | Description | Gene Ratio | Bg Ratio | pvalue | p.adjust | qvalue | Count |
| hsa0501225 | Cervix | HSIL_HPV | Parkinson disease | 43/459 | 266/8465 | 6.69e-11 | 6.53e-09 | 5.28e-09 | 43 |
| hsa0502024 | Cervix | HSIL_HPV | Prion disease | 40/459 | 273/8465 | 6.26e-09 | 3.67e-07 | 2.97e-07 | 40 |
| hsa0414523 | Cervix | HSIL_HPV | Phagosome | 27/459 | 152/8465 | 3.58e-08 | 1.50e-06 | 1.21e-06 | 27 |
| hsa0513225 | Cervix | HSIL_HPV | Salmonella infection | 34/459 | 249/8465 | 5.03e-07 | 1.13e-05 | 9.17e-06 | 34 |
| hsa0501624 | Cervix | HSIL_HPV | Huntington disease | 38/459 | 306/8465 | 1.21e-06 | 2.54e-05 | 2.05e-05 | 38 |
| hsa0513025 | Cervix | HSIL_HPV | Pathogenic Escherichia coli infection | 28/459 | 197/8465 | 2.36e-06 | 4.61e-05 | 3.73e-05 | 28 |
| hsa0502224 | Cervix | HSIL_HPV | Pathways of neurodegeneration - multiple diseases | 46/459 | 476/8465 | 8.10e-05 | 1.08e-03 | 8.72e-04 | 46 |
| hsa0501024 | Cervix | HSIL_HPV | Alzheimer disease | 38/459 | 384/8465 | 2.13e-04 | 2.31e-03 | 1.86e-03 | 38 |
| hsa0501424 | Cervix | HSIL_HPV | Amyotrophic lateral sclerosis | 35/459 | 364/8465 | 6.43e-04 | 5.23e-03 | 4.23e-03 | 35 |
| hsa0501235 | Cervix | HSIL_HPV | Parkinson disease | 43/459 | 266/8465 | 6.69e-11 | 6.53e-09 | 5.28e-09 | 43 |
| hsa0502034 | Cervix | HSIL_HPV | Prion disease | 40/459 | 273/8465 | 6.26e-09 | 3.67e-07 | 2.97e-07 | 40 |
| hsa0414533 | Cervix | HSIL_HPV | Phagosome | 27/459 | 152/8465 | 3.58e-08 | 1.50e-06 | 1.21e-06 | 27 |
| hsa0513235 | Cervix | HSIL_HPV | Salmonella infection | 34/459 | 249/8465 | 5.03e-07 | 1.13e-05 | 9.17e-06 | 34 |
| hsa0501634 | Cervix | HSIL_HPV | Huntington disease | 38/459 | 306/8465 | 1.21e-06 | 2.54e-05 | 2.05e-05 | 38 |
| hsa0513035 | Cervix | HSIL_HPV | Pathogenic Escherichia coli infection | 28/459 | 197/8465 | 2.36e-06 | 4.61e-05 | 3.73e-05 | 28 |
| hsa0502234 | Cervix | HSIL_HPV | Pathways of neurodegeneration - multiple diseases | 46/459 | 476/8465 | 8.10e-05 | 1.08e-03 | 8.72e-04 | 46 |
| hsa0501034 | Cervix | HSIL_HPV | Alzheimer disease | 38/459 | 384/8465 | 2.13e-04 | 2.31e-03 | 1.86e-03 | 38 |
| hsa0501434 | Cervix | HSIL_HPV | Amyotrophic lateral sclerosis | 35/459 | 364/8465 | 6.43e-04 | 5.23e-03 | 4.23e-03 | 35 |
| hsa05012 | Colorectum | AD | Parkinson disease | 147/2092 | 266/8465 | 2.53e-27 | 8.48e-25 | 5.41e-25 | 147 |
| hsa05010 | Colorectum | AD | Alzheimer disease | 174/2092 | 384/8465 | 1.82e-19 | 9.26e-18 | 5.91e-18 | 174 |
| Page: 1 2 3 4 5 6 7 8 9 |
Top |
Cell-cell communication analysis |
| Identification of potential cell-cell interactions between two cell types and their ligand-receptor pairs for different disease states |
| Ligand | Receptor | LRpair | Pathway | Tissue | Disease Stage |
| Page: 1 |
Top |
Single-cell gene regulatory network inference analysis |
| Find out the significant the regulons (TFs) and the target genes of each regulon across cell types for different disease states |
| TF | Cell Type | Tissue | Disease Stage | Target Gene | RSS | Regulon Activity |
| ∗The dot plots of a searched regulon are shown for all cell subpopulations in each disease state of each tissue based on the regulon specific score inferred using pySCENIC and by calculating the average expression. |
| Page: 1 |
Top |
Somatic mutation of malignant transformation related genes |
| Annotation of somatic variants for genes involved in malignant transformation |
| Hugo Symbol | Variant Class | Variant Classification | dbSNP RS | HGVSc | HGVSp | HGVSp Short | SWISSPROT | BIOTYPE | SIFT | PolyPhen | Tumor Sample Barcode | Tissue | Histology | Sex | Age | Stage | Therapy Types | Drugs | Outcome |
| TUBB2A | SNV | Missense_Mutation | novel | c.1183N>A | p.Leu395Met | p.L395M | Q13885 | protein_coding | deleterious_low_confidence(0) | probably_damaging(1) | TCGA-A2-A25A-01 | Breast | breast invasive carcinoma | Female | <65 | I/II | Unspecific | Cytoxan | SD |
| TUBB2A | SNV | Missense_Mutation | c.1332N>T | p.Glu444Asp | p.E444D | Q13885 | protein_coding | tolerated_low_confidence(0.15) | benign(0.217) | TCGA-AN-A0AK-01 | Breast | breast invasive carcinoma | Female | >=65 | I/II | Unknown | Unknown | SD | |
| TUBB2A | SNV | Missense_Mutation | novel | c.1209N>C | p.Met403Ile | p.M403I | Q13885 | protein_coding | deleterious_low_confidence(0.01) | probably_damaging(0.986) | TCGA-UU-A93S-01 | Breast | breast invasive carcinoma | Female | <65 | III/IV | Unknown | Unknown | PD |
| TUBB2A | SNV | Missense_Mutation | novel | c.1126N>A | p.Glu376Lys | p.E376K | Q13885 | protein_coding | deleterious_low_confidence(0) | possibly_damaging(0.632) | TCGA-C5-A8XK-01 | Cervix | cervical & endocervical cancer | Female | <65 | I/II | Chemotherapy | cisplatin | SD |
| TUBB2A | SNV | Missense_Mutation | novel | c.1201N>A | p.Glu401Lys | p.E401K | Q13885 | protein_coding | deleterious_low_confidence(0) | probably_damaging(0.998) | TCGA-MY-A913-01 | Cervix | cervical & endocervical cancer | Female | <65 | I/II | Chemotherapy | cisplatin | CR |
| TUBB2A | SNV | Missense_Mutation | novel | c.674T>C | p.Leu225Pro | p.L225P | Q13885 | protein_coding | deleterious_low_confidence(0) | probably_damaging(1) | TCGA-5M-AATE-01 | Colorectum | colon adenocarcinoma | Male | >=65 | I/II | Unknown | Unknown | PD |
| TUBB2A | SNV | Missense_Mutation | c.1282N>A | p.Ala428Thr | p.A428T | Q13885 | protein_coding | deleterious_low_confidence(0.02) | benign(0.093) | TCGA-AA-3845-01 | Colorectum | colon adenocarcinoma | Female | >=65 | I/II | Unknown | Unknown | PD | |
| TUBB2A | SNV | Missense_Mutation | novel | c.751C>T | p.Arg251Cys | p.R251C | Q13885 | protein_coding | deleterious_low_confidence(0) | probably_damaging(0.967) | TCGA-AZ-4615-01 | Colorectum | colon adenocarcinoma | Male | >=65 | III/IV | Chemotherapy | xeloda | PD |
| TUBB2A | SNV | Missense_Mutation | c.619N>A | p.Leu207Met | p.L207M | Q13885 | protein_coding | deleterious_low_confidence(0) | probably_damaging(0.984) | TCGA-D5-6927-01 | Colorectum | colon adenocarcinoma | Male | <65 | I/II | Unknown | Unknown | SD | |
| TUBB2A | SNV | Missense_Mutation | c.1282N>A | p.Ala428Thr | p.A428T | Q13885 | protein_coding | deleterious_low_confidence(0.02) | benign(0.093) | TCGA-G4-6298-01 | Colorectum | colon adenocarcinoma | Male | >=65 | III/IV | Chemotherapy | irinotecan | PD |
| Page: 1 2 3 4 |
Top |
Related drugs of malignant transformation related genes |
| Identification of chemicals and drugs interact with genes involved in malignant transfromation |
| (DGIdb 4.0) |
| Entrez ID | Symbol | Category | Interaction Types | Drug Claim Name | Drug Name | PMIDs |
| 7280 | TUBB2A | DRUGGABLE GENOME | VINORELBINE BASE | VINORELBINE | 25768699 | |
| 7280 | TUBB2A | DRUGGABLE GENOME | ZAMPANOLIDE | ZAMPANOLIDE | 19877653 | |
| 7280 | TUBB2A | DRUGGABLE GENOME | VINBLASTINE | VINBLASTINE | ||
| 7280 | TUBB2A | DRUGGABLE GENOME | ANHYDROVINBLASTIN | |||
| 7280 | TUBB2A | DRUGGABLE GENOME | inhibitor | CHEMBL378544 | VINBLASTINE SULFATE | |
| 7280 | TUBB2A | DRUGGABLE GENOME | VINORELBINE | VINORELBINE | ||
| 7280 | TUBB2A | DRUGGABLE GENOME | 10,11-DIHYDROEPOTHILONE D | CHEMBL453818 | 12141877 | |
| 7280 | TUBB2A | DRUGGABLE GENOME | inhibitor | CHEMBL1683544 | ERIBULIN MESYLATE | |
| 7280 | TUBB2A | DRUGGABLE GENOME | COLCHICINE | COLCHICINE | 23750455,25805446,24502232,25061803,25937236,24773591,25938266 | |
| 7280 | TUBB2A | DRUGGABLE GENOME | inhibitor | CHEMBL2103852 | CROLIBULIN |
| Page: 1 2 3 4 5 6 |

Copyright 2023-Present -The University of Texas Health Science Center at Houston |