
|
|||||
|
 | |
| |
| |
| |
| |
| |
|
Gene: TUBB |
Gene summary for TUBB |
| Gene information | Species | Human | Gene symbol | TUBB | Gene ID | 203068 |
| Gene name | tubulin beta class I | |
| Gene Alias | CDCBM6 | |
| Cytomap | 6p21.33 | |
| Gene Type | protein-coding | GO ID | GO:0000226 | UniProtAcc | B4DY90 |
Top |
Malignant transformation analysis |
| Identification of the aberrant gene expression in precancerous and cancerous lesions by comparing the gene expression of stem-like cells in diseased tissues with normal stem cells |
| Entrez ID | Symbol | Replicates | Species | Organ | Tissue | Adj P-value | Log2FC | Malignancy |
| 203068 | TUBB | GSM4909280 | Human | Breast | Precancer | 2.77e-06 | -8.10e-01 | 0.0305 |
| 203068 | TUBB | GSM4909281 | Human | Breast | IDC | 1.38e-10 | 3.70e-01 | 0.21 |
| 203068 | TUBB | GSM4909282 | Human | Breast | IDC | 1.57e-51 | 6.84e-01 | -0.0288 |
| 203068 | TUBB | GSM4909285 | Human | Breast | IDC | 2.06e-23 | 4.93e-01 | 0.21 |
| 203068 | TUBB | GSM4909286 | Human | Breast | IDC | 2.19e-07 | -1.41e-01 | 0.1081 |
| 203068 | TUBB | GSM4909288 | Human | Breast | IDC | 2.38e-03 | 1.60e-01 | 0.0988 |
| 203068 | TUBB | GSM4909294 | Human | Breast | IDC | 8.37e-09 | -2.97e-01 | 0.2022 |
| 203068 | TUBB | GSM4909296 | Human | Breast | IDC | 5.78e-11 | -3.15e-01 | 0.1524 |
| 203068 | TUBB | GSM4909297 | Human | Breast | IDC | 8.47e-18 | -3.07e-01 | 0.1517 |
| 203068 | TUBB | GSM4909298 | Human | Breast | IDC | 6.59e-07 | -2.57e-01 | 0.1551 |
| 203068 | TUBB | GSM4909299 | Human | Breast | IDC | 2.17e-13 | -4.36e-01 | 0.035 |
| 203068 | TUBB | GSM4909300 | Human | Breast | IDC | 7.80e-04 | -4.09e-01 | 0.0334 |
| 203068 | TUBB | GSM4909301 | Human | Breast | IDC | 1.98e-15 | -5.73e-01 | 0.1577 |
| 203068 | TUBB | GSM4909302 | Human | Breast | IDC | 1.30e-25 | -7.20e-01 | 0.1545 |
| 203068 | TUBB | GSM4909309 | Human | Breast | IDC | 1.38e-08 | -4.60e-01 | 0.0483 |
| 203068 | TUBB | GSM4909311 | Human | Breast | IDC | 3.15e-43 | -5.36e-01 | 0.1534 |
| 203068 | TUBB | GSM4909312 | Human | Breast | IDC | 1.05e-13 | 1.57e-01 | 0.1552 |
| 203068 | TUBB | GSM4909313 | Human | Breast | IDC | 2.94e-06 | -4.17e-01 | 0.0391 |
| 203068 | TUBB | GSM4909317 | Human | Breast | IDC | 2.56e-07 | -3.12e-01 | 0.1355 |
| 203068 | TUBB | GSM4909319 | Human | Breast | IDC | 5.17e-56 | -4.26e-01 | 0.1563 |
| Page: 1 2 3 4 5 6 7 8 9 10 11 12 13 14 15 |
| Tissue | Expression Dynamics | Abbreviation |
| Breast | 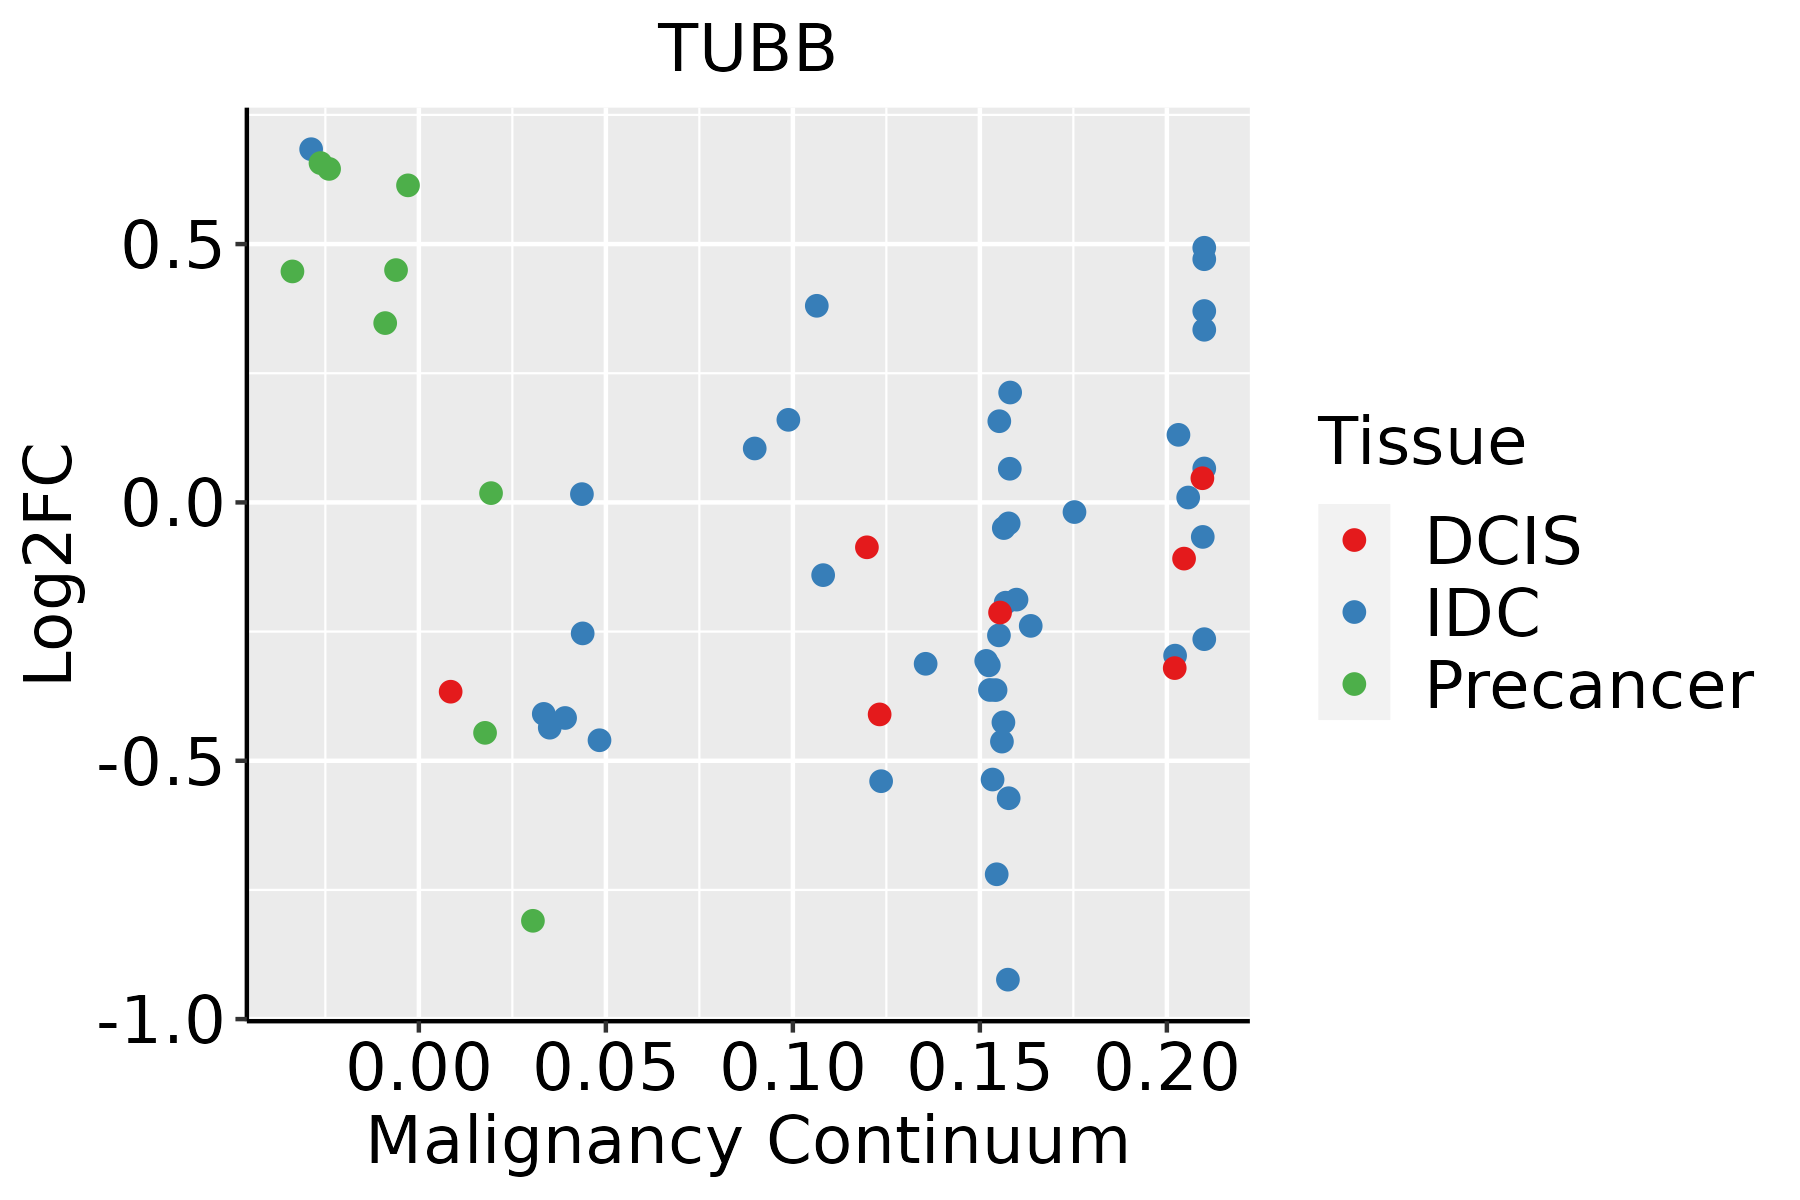 | IDC: Invasive ductal carcinoma |
| DCIS: Ductal carcinoma in situ | ||
| Precancer(BRCA1-mut): Precancerous lesion from BRCA1 mutation carriers | ||
| Cervix | 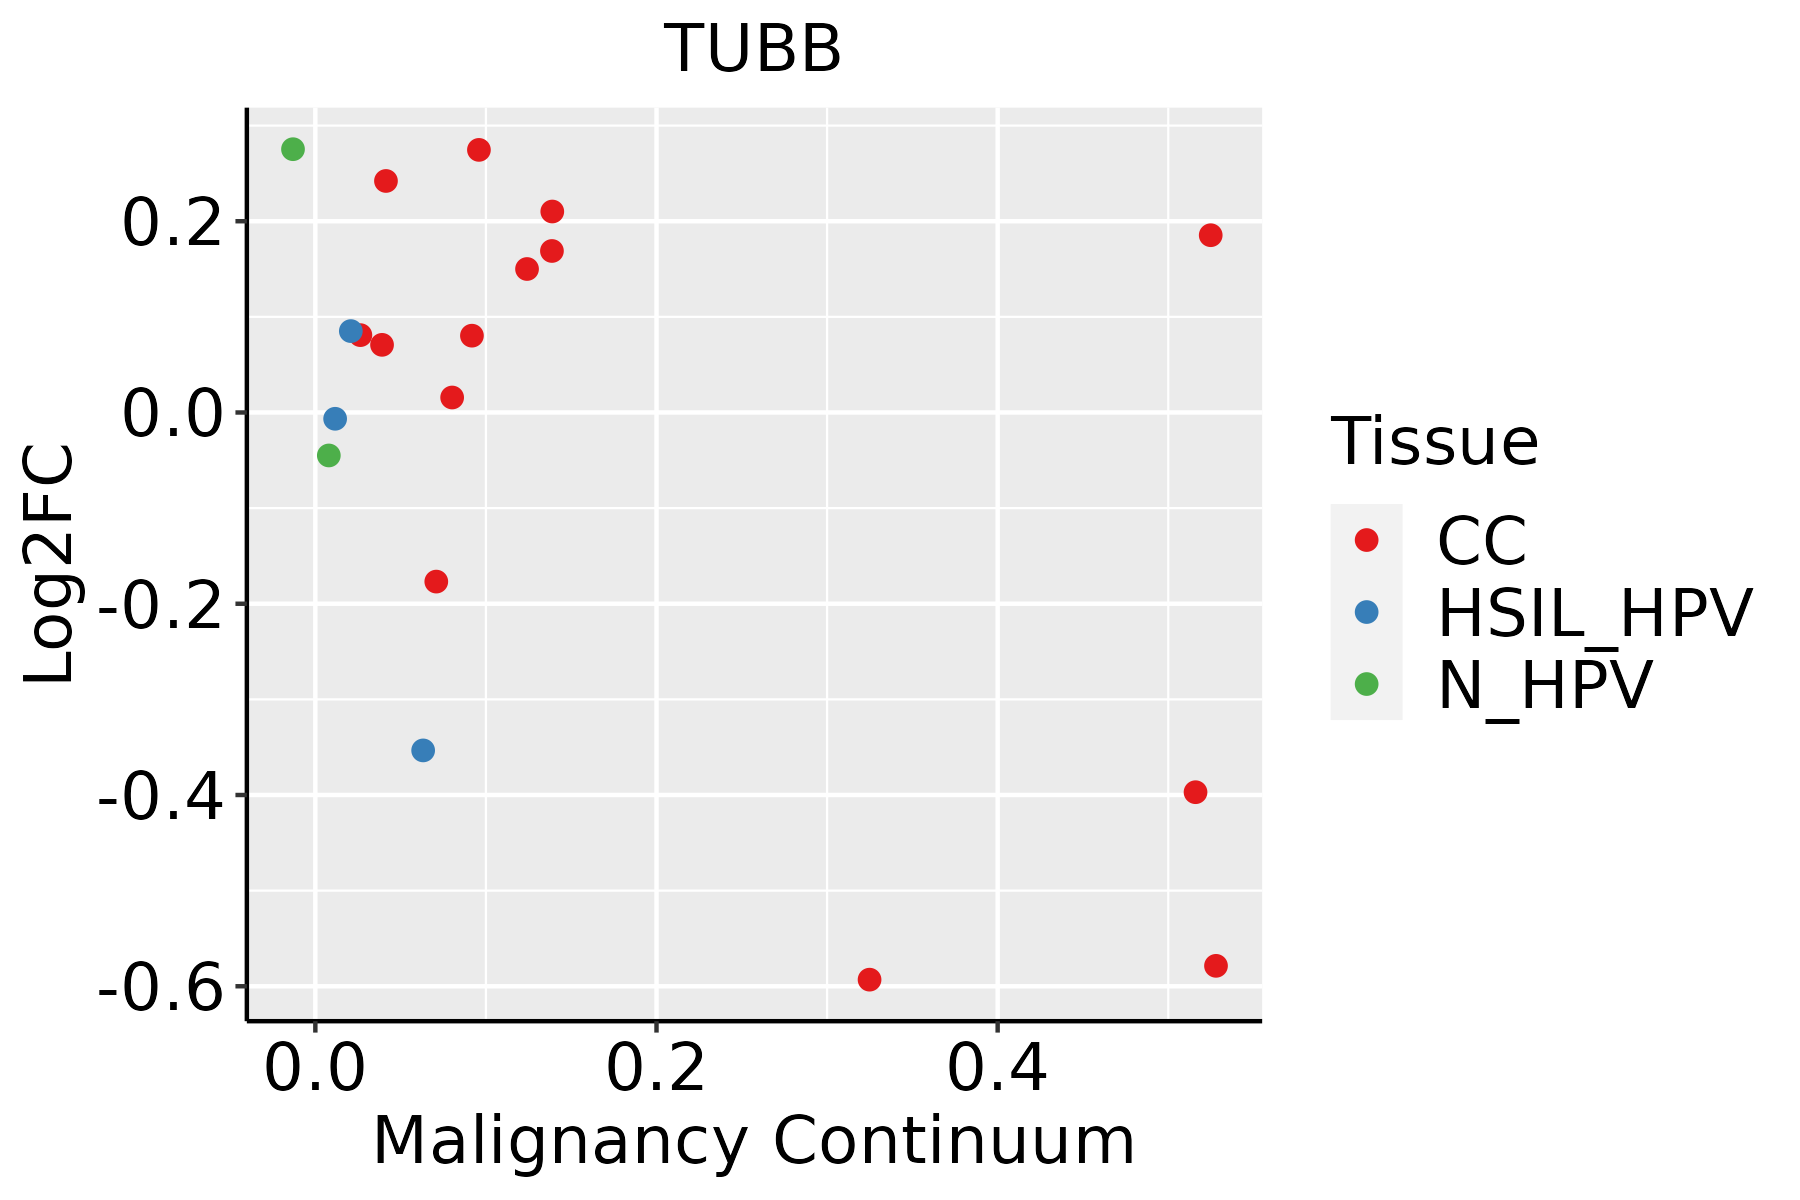 | CC: Cervix cancer |
| HSIL_HPV: HPV-infected high-grade squamous intraepithelial lesions | ||
| N_HPV: HPV-infected normal cervix | ||
| Colorectum (GSE201348) |  | FAP: Familial adenomatous polyposis |
| CRC: Colorectal cancer | ||
| Colorectum (HTA11) |  | AD: Adenomas |
| SER: Sessile serrated lesions | ||
| MSI-H: Microsatellite-high colorectal cancer | ||
| MSS: Microsatellite stable colorectal cancer | ||
| Endometrium | 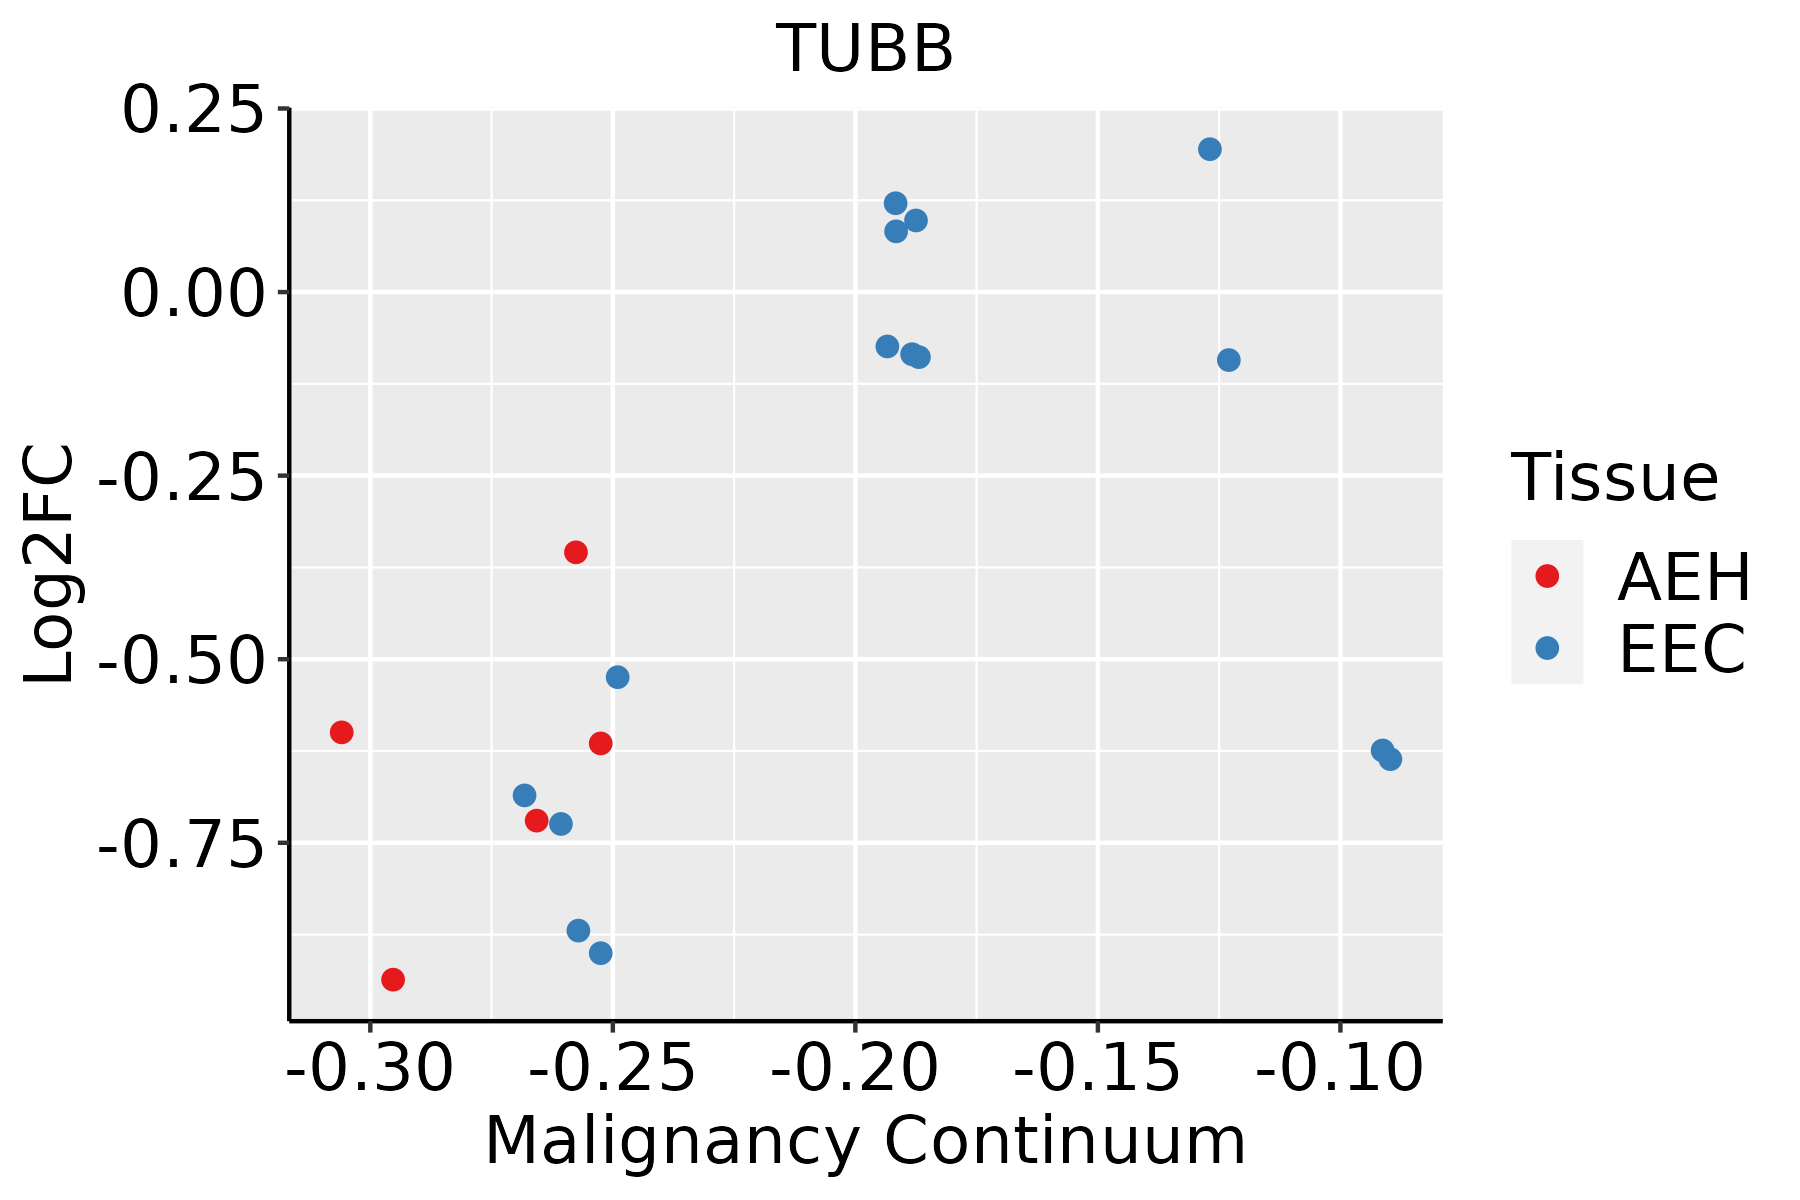 | AEH: Atypical endometrial hyperplasia |
| EEC: Endometrioid Cancer | ||
| Esophagus | 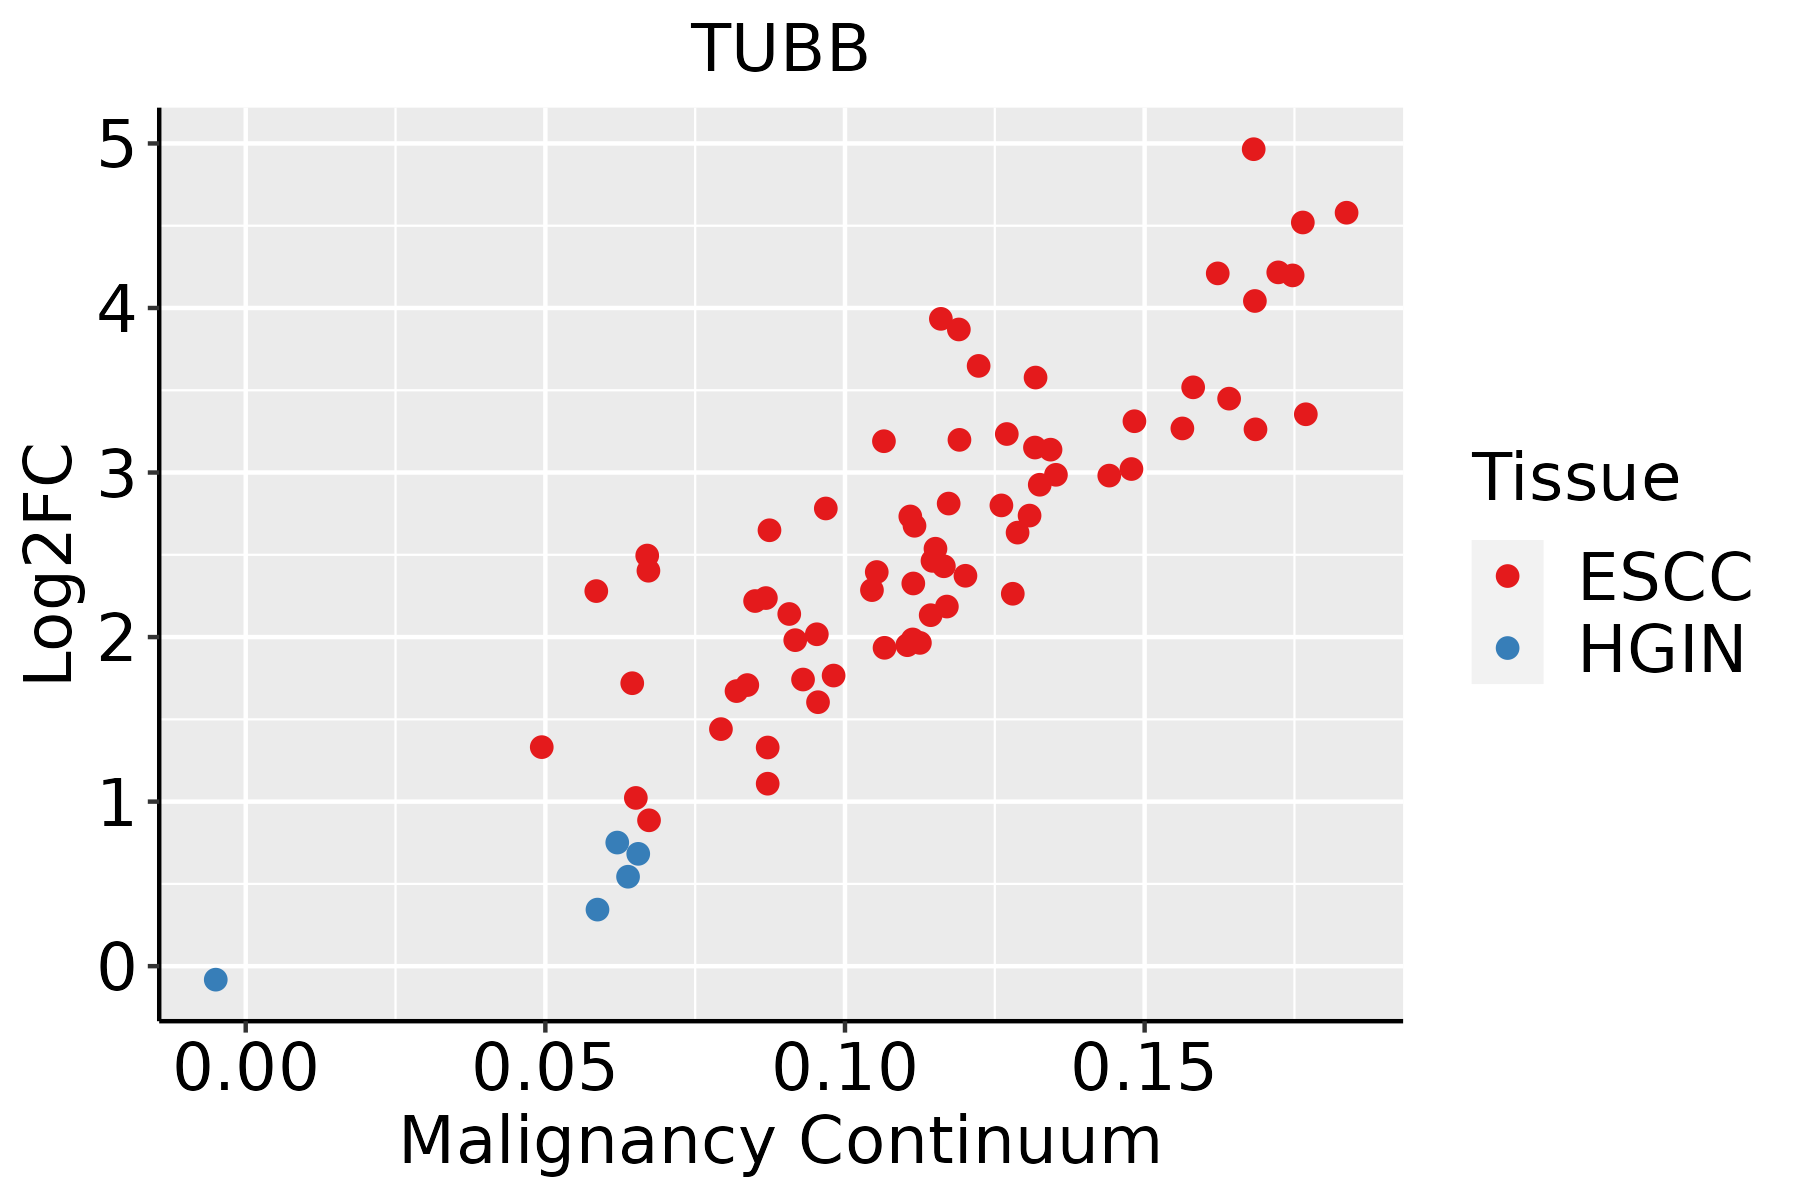 | ESCC: Esophageal squamous cell carcinoma |
| HGIN: High-grade intraepithelial neoplasias | ||
| LGIN: Low-grade intraepithelial neoplasias | ||
| GC | 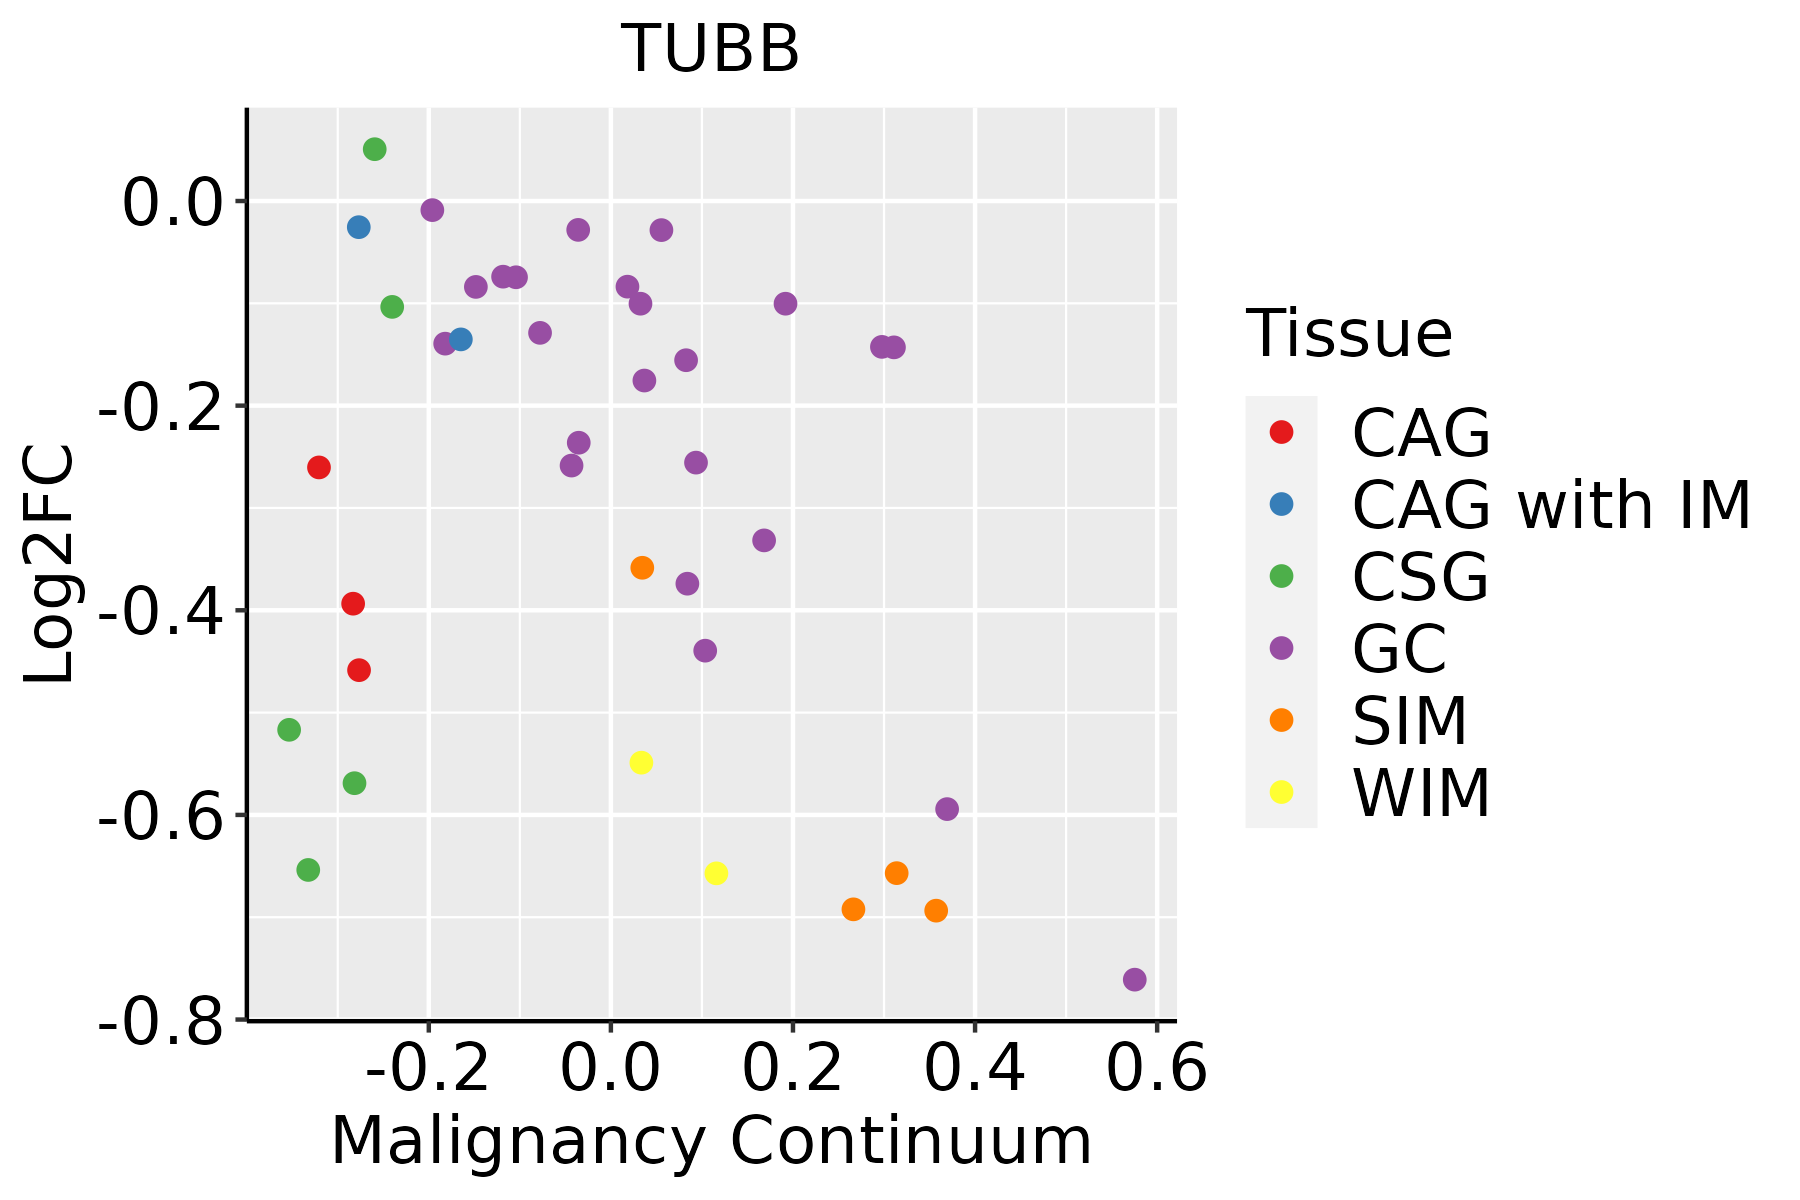 | CAG: Chronic atrophic gastritis |
| CAG with IM: Chronic atrophic gastritis with intestinal metaplasia | ||
| CSG: Chronic superficial gastritis | ||
| GC: Gastric cancer | ||
| SIM: Severe intestinal metaplasia | ||
| WIM: Wild intestinal metaplasia | ||
| Liver |  | HCC: Hepatocellular carcinoma |
| NAFLD: Non-alcoholic fatty liver disease | ||
| Oral Cavity |  | EOLP: Erosive Oral lichen planus |
| LP: leukoplakia | ||
| NEOLP: Non-erosive oral lichen planus | ||
| OSCC: Oral squamous cell carcinoma | ||
| Prostate | 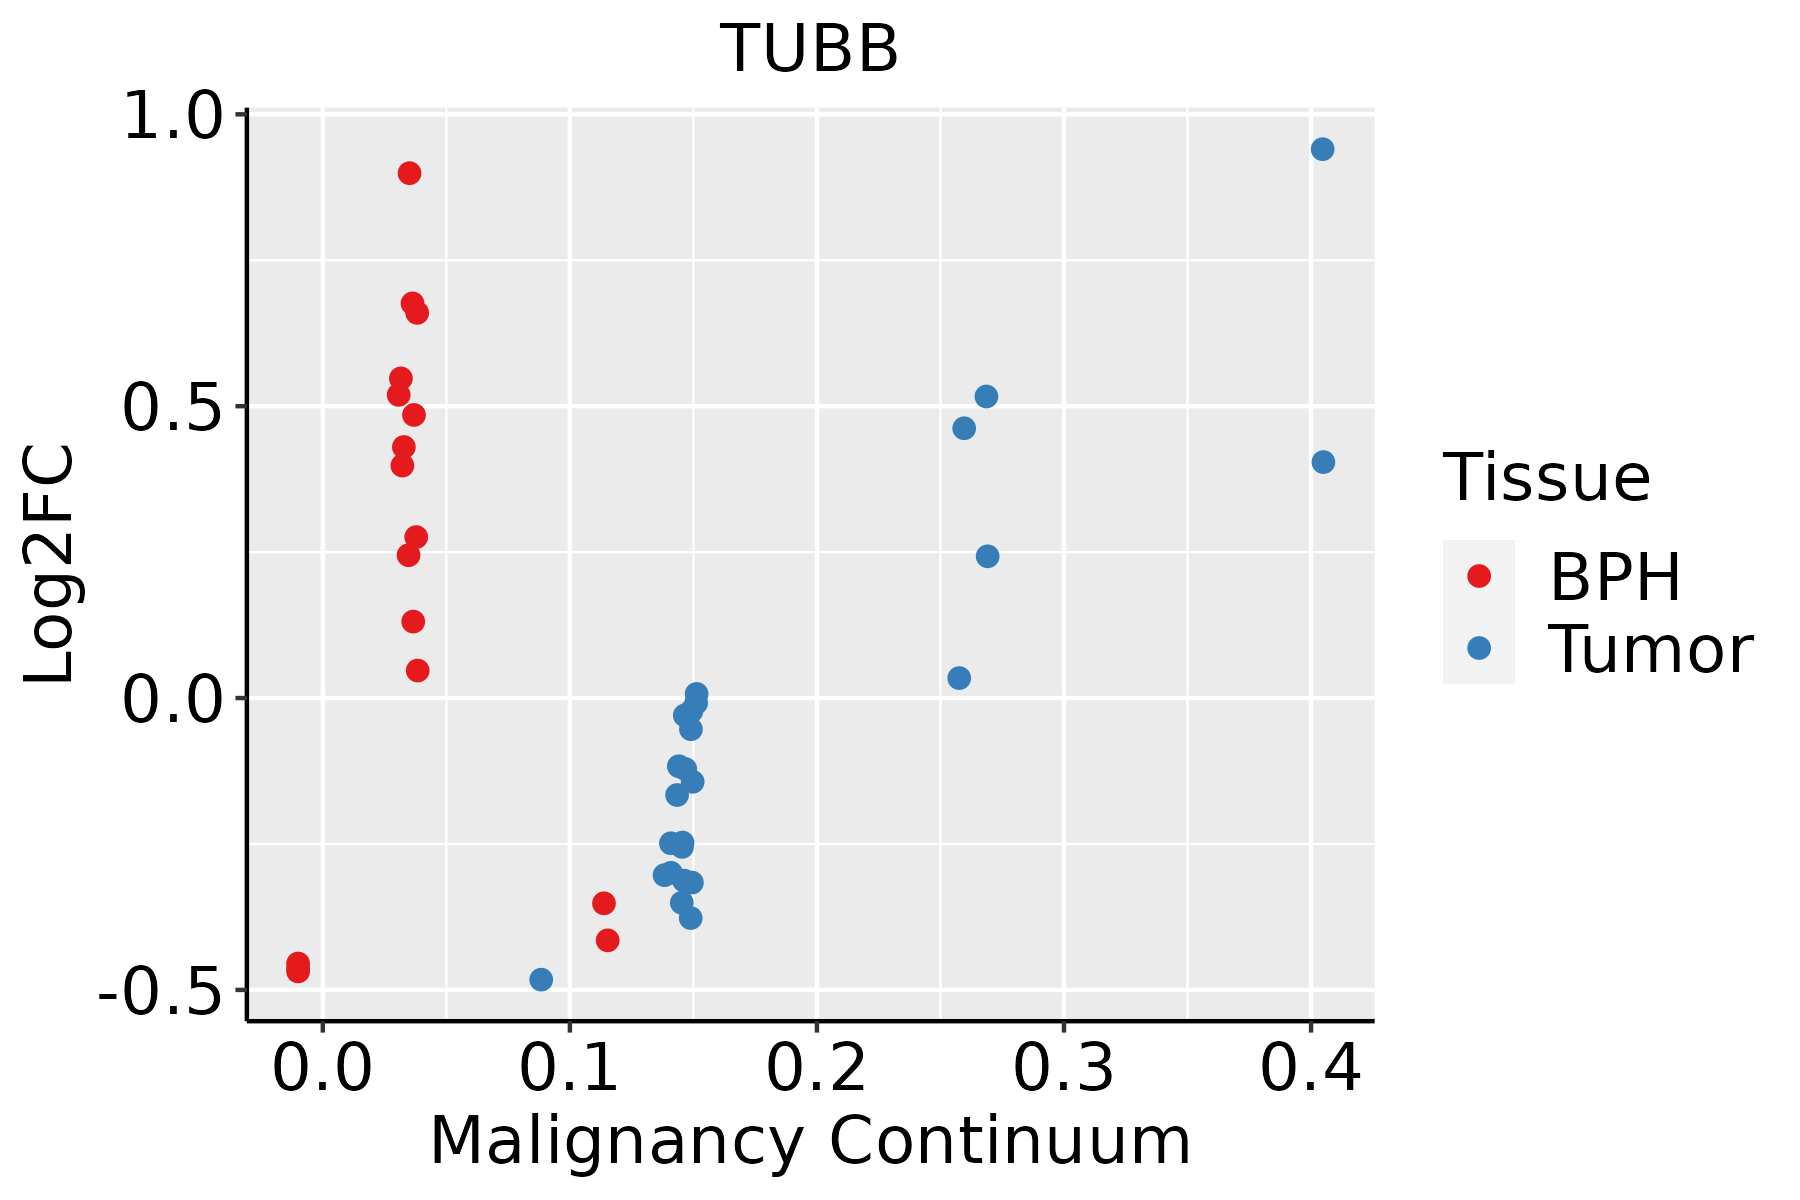 | BPH: Benign Prostatic Hyperplasia |
| Skin |  | AK: Actinic keratosis |
| cSCC: Cutaneous squamous cell carcinoma | ||
| SCCIS:squamous cell carcinoma in situ | ||
| Thyroid | 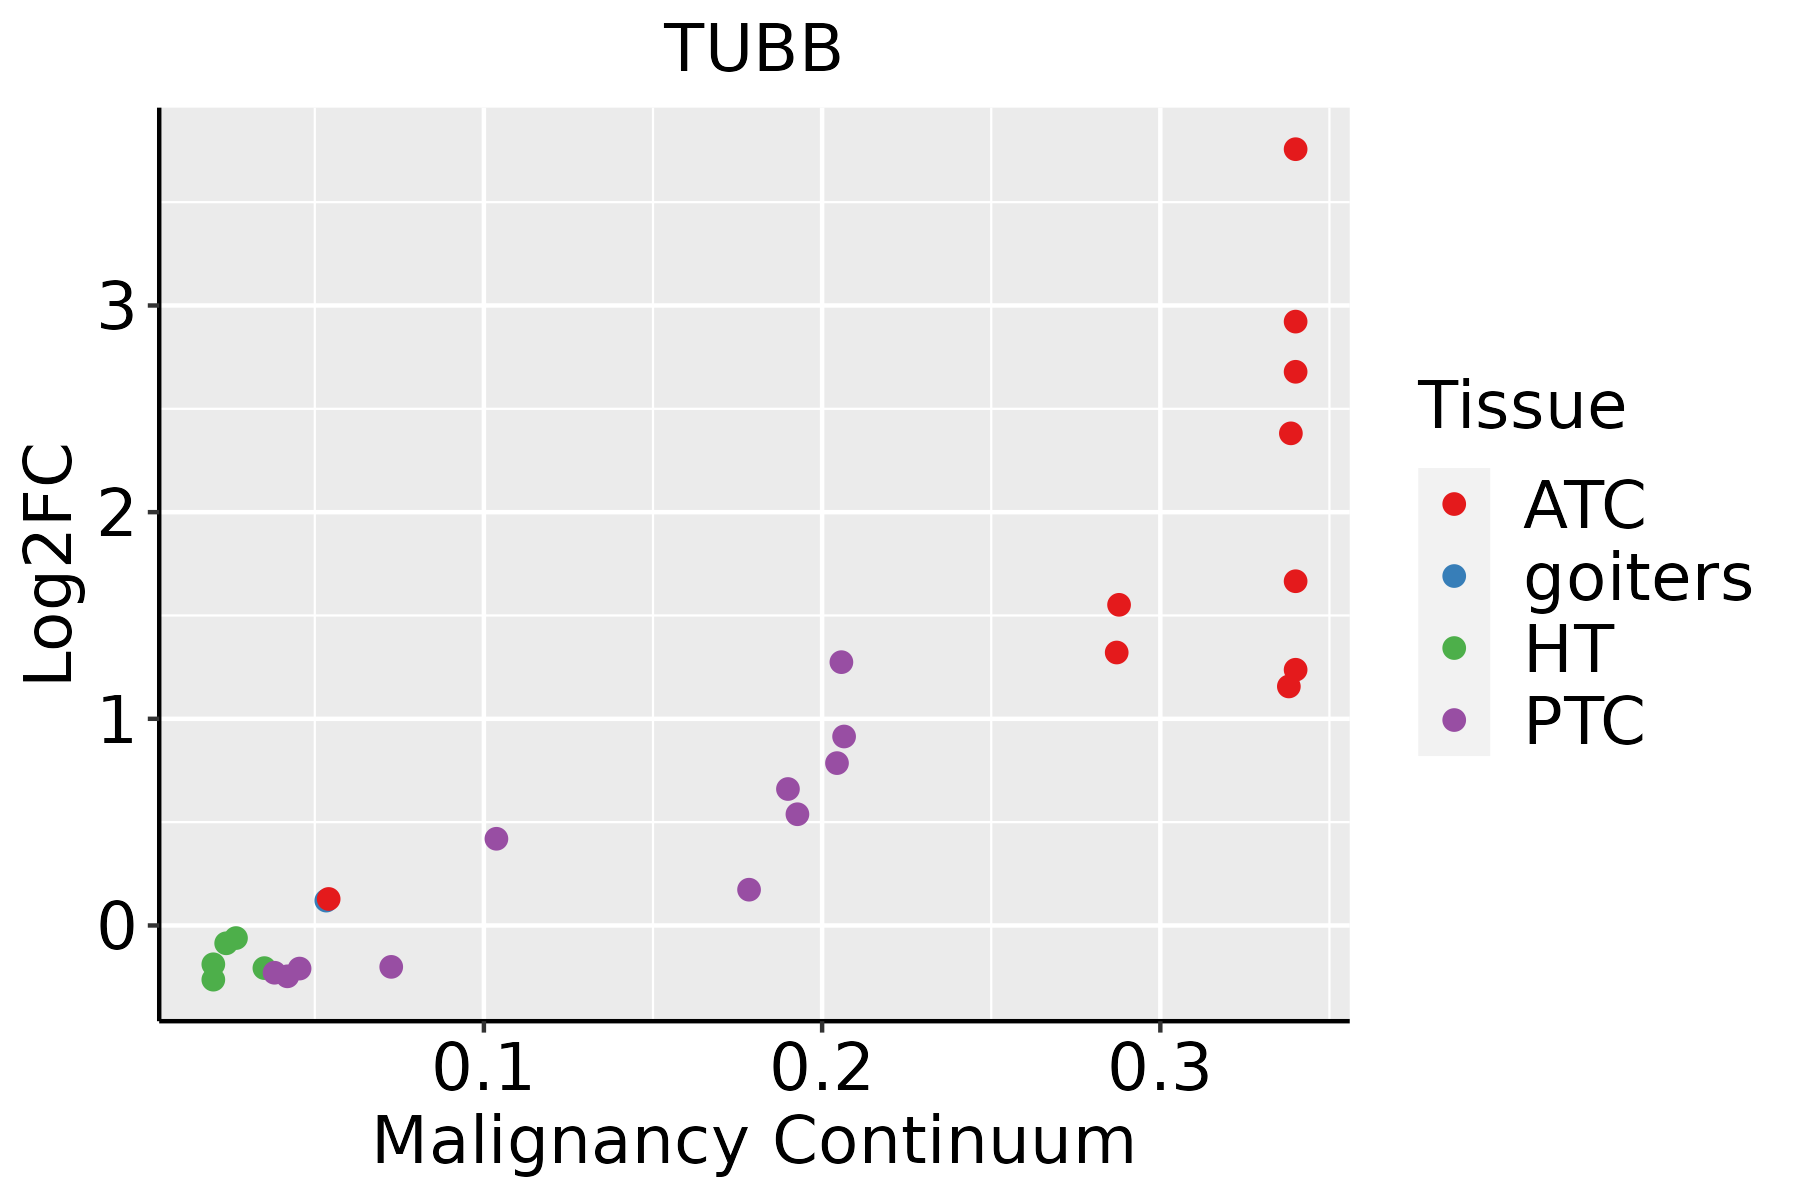 | ATC: Anaplastic thyroid cancer |
| HT: Hashimoto's thyroiditis | ||
| PTC: Papillary thyroid cancer |
| ∗log2FC in expression of this searched gene in stem-like cells from each diseased tissue sample relative to stem-like cells in normal samples in each tissue plotted against the malignancy continuum. Samples are colored based on if they are from different disease stage. |
Top |
Malignant transformation related pathway analysis |
| Find out the enriched GO biological processes and KEGG pathways involved in transition from healthy to precancer to cancer |
| Tissue | Disease Stage | Enriched GO biological Processes |
| Colorectum | AD |  |
| Colorectum | SER |  |
| Colorectum | MSS |  |
| Colorectum | MSI-H |  |
| Colorectum | FAP |  |
| ∗Top 15 enriched GO BP terms are showed in the bar plot of each disease state in each tissue. Each row represents a significant GO biological process which is colored according to the -log10(p.adjust). |
| Page: 1 2 3 4 5 6 7 8 9 |
| GO ID | Tissue | Disease Stage | Description | Gene Ratio | Bg Ratio | pvalue | p.adjust | Count |
| GO:00307057 | Cervix | CC | cytoskeleton-dependent intracellular transport | 40/2311 | 195/18723 | 7.92e-04 | 6.99e-03 | 40 |
| GO:00019067 | Cervix | CC | cell killing | 37/2311 | 188/18723 | 2.61e-03 | 1.80e-02 | 37 |
| GO:0002443 | Cervix | CC | leukocyte mediated immunity | 73/2311 | 440/18723 | 5.01e-03 | 2.98e-02 | 73 |
| GO:00024431 | Cervix | HSIL_HPV | leukocyte mediated immunity | 41/737 | 440/18723 | 3.14e-07 | 1.76e-05 | 41 |
| GO:00024493 | Cervix | HSIL_HPV | lymphocyte mediated immunity | 35/737 | 350/18723 | 4.45e-07 | 2.36e-05 | 35 |
| GO:000190611 | Cervix | HSIL_HPV | cell killing | 23/737 | 188/18723 | 1.45e-06 | 6.47e-05 | 23 |
| GO:00019093 | Cervix | HSIL_HPV | leukocyte mediated cytotoxicity | 12/737 | 124/18723 | 3.60e-03 | 3.22e-02 | 12 |
| GO:00024432 | Cervix | N_HPV | leukocyte mediated immunity | 39/534 | 440/18723 | 3.94e-10 | 2.24e-07 | 39 |
| GO:000244911 | Cervix | N_HPV | lymphocyte mediated immunity | 32/534 | 350/18723 | 7.29e-09 | 1.58e-06 | 32 |
| GO:000190621 | Cervix | N_HPV | cell killing | 22/534 | 188/18723 | 2.20e-08 | 3.03e-06 | 22 |
| GO:000190911 | Cervix | N_HPV | leukocyte mediated cytotoxicity | 13/534 | 124/18723 | 5.46e-05 | 1.22e-03 | 13 |
| GO:003070513 | Cervix | N_HPV | cytoskeleton-dependent intracellular transport | 13/534 | 195/18723 | 4.03e-03 | 3.16e-02 | 13 |
| GO:0007051 | Colorectum | AD | spindle organization | 58/3918 | 184/18723 | 4.71e-04 | 5.20e-03 | 58 |
| GO:0030705 | Colorectum | AD | cytoskeleton-dependent intracellular transport | 60/3918 | 195/18723 | 7.56e-04 | 7.59e-03 | 60 |
| GO:0050808 | Colorectum | AD | synapse organization | 112/3918 | 426/18723 | 4.25e-03 | 2.92e-02 | 112 |
| GO:0051225 | Colorectum | AD | spindle assembly | 37/3918 | 117/18723 | 4.32e-03 | 2.96e-02 | 37 |
| GO:0050807 | Colorectum | AD | regulation of synapse organization | 60/3918 | 211/18723 | 5.67e-03 | 3.64e-02 | 60 |
| GO:00307051 | Colorectum | SER | cytoskeleton-dependent intracellular transport | 44/2897 | 195/18723 | 5.53e-03 | 4.09e-02 | 44 |
| GO:00508081 | Colorectum | SER | synapse organization | 85/2897 | 426/18723 | 7.17e-03 | 4.99e-02 | 85 |
| GO:00070511 | Colorectum | MSS | spindle organization | 53/3467 | 184/18723 | 4.23e-04 | 5.19e-03 | 53 |
| Page: 1 2 3 4 5 6 |
| Pathway ID | Tissue | Disease Stage | Description | Gene Ratio | Bg Ratio | pvalue | p.adjust | qvalue | Count |
| hsa0501218 | Breast | Precancer | Parkinson disease | 99/684 | 266/8465 | 3.58e-42 | 5.65e-40 | 4.33e-40 | 99 |
| hsa0502016 | Breast | Precancer | Prion disease | 95/684 | 273/8465 | 1.39e-37 | 1.46e-35 | 1.12e-35 | 95 |
| hsa0501616 | Breast | Precancer | Huntington disease | 98/684 | 306/8465 | 2.85e-35 | 2.25e-33 | 1.72e-33 | 98 |
| hsa0501016 | Breast | Precancer | Alzheimer disease | 103/684 | 384/8465 | 1.03e-29 | 4.66e-28 | 3.57e-28 | 103 |
| hsa0501416 | Breast | Precancer | Amyotrophic lateral sclerosis | 98/684 | 364/8465 | 2.13e-28 | 8.41e-27 | 6.44e-27 | 98 |
| hsa0502216 | Breast | Precancer | Pathways of neurodegeneration - multiple diseases | 112/684 | 476/8465 | 6.96e-27 | 2.44e-25 | 1.87e-25 | 112 |
| hsa0513218 | Breast | Precancer | Salmonella infection | 49/684 | 249/8465 | 2.92e-09 | 6.15e-08 | 4.71e-08 | 49 |
| hsa0513018 | Breast | Precancer | Pathogenic Escherichia coli infection | 38/684 | 197/8465 | 3.12e-07 | 5.81e-06 | 4.45e-06 | 38 |
| hsa0414518 | Breast | Precancer | Phagosome | 27/684 | 152/8465 | 7.37e-05 | 6.85e-04 | 5.25e-04 | 27 |
| hsa0501219 | Breast | Precancer | Parkinson disease | 99/684 | 266/8465 | 3.58e-42 | 5.65e-40 | 4.33e-40 | 99 |
| hsa0502017 | Breast | Precancer | Prion disease | 95/684 | 273/8465 | 1.39e-37 | 1.46e-35 | 1.12e-35 | 95 |
| hsa0501617 | Breast | Precancer | Huntington disease | 98/684 | 306/8465 | 2.85e-35 | 2.25e-33 | 1.72e-33 | 98 |
| hsa0501017 | Breast | Precancer | Alzheimer disease | 103/684 | 384/8465 | 1.03e-29 | 4.66e-28 | 3.57e-28 | 103 |
| hsa0501417 | Breast | Precancer | Amyotrophic lateral sclerosis | 98/684 | 364/8465 | 2.13e-28 | 8.41e-27 | 6.44e-27 | 98 |
| hsa0502217 | Breast | Precancer | Pathways of neurodegeneration - multiple diseases | 112/684 | 476/8465 | 6.96e-27 | 2.44e-25 | 1.87e-25 | 112 |
| hsa0513219 | Breast | Precancer | Salmonella infection | 49/684 | 249/8465 | 2.92e-09 | 6.15e-08 | 4.71e-08 | 49 |
| hsa0513019 | Breast | Precancer | Pathogenic Escherichia coli infection | 38/684 | 197/8465 | 3.12e-07 | 5.81e-06 | 4.45e-06 | 38 |
| hsa0414519 | Breast | Precancer | Phagosome | 27/684 | 152/8465 | 7.37e-05 | 6.85e-04 | 5.25e-04 | 27 |
| hsa0501224 | Breast | IDC | Parkinson disease | 107/867 | 266/8465 | 2.57e-39 | 8.36e-37 | 6.26e-37 | 107 |
| hsa0502023 | Breast | IDC | Prion disease | 102/867 | 273/8465 | 3.70e-34 | 4.01e-32 | 3.00e-32 | 102 |
| Page: 1 2 3 4 5 6 7 8 9 10 11 12 13 14 15 16 17 18 19 20 21 22 23 24 25 26 27 |
Top |
Cell-cell communication analysis |
| Identification of potential cell-cell interactions between two cell types and their ligand-receptor pairs for different disease states |
| Ligand | Receptor | LRpair | Pathway | Tissue | Disease Stage |
| Page: 1 |
Top |
Single-cell gene regulatory network inference analysis |
| Find out the significant the regulons (TFs) and the target genes of each regulon across cell types for different disease states |
| TF | Cell Type | Tissue | Disease Stage | Target Gene | RSS | Regulon Activity |
| ∗The dot plots of a searched regulon are shown for all cell subpopulations in each disease state of each tissue based on the regulon specific score inferred using pySCENIC and by calculating the average expression. |
| Page: 1 |
Top |
Somatic mutation of malignant transformation related genes |
| Annotation of somatic variants for genes involved in malignant transformation |
| Hugo Symbol | Variant Class | Variant Classification | dbSNP RS | HGVSc | HGVSp | HGVSp Short | SWISSPROT | BIOTYPE | SIFT | PolyPhen | Tumor Sample Barcode | Tissue | Histology | Sex | Age | Stage | Therapy Types | Drugs | Outcome |
| TUBB | SNV | Missense_Mutation | novel | c.442N>T | p.Gly148Cys | p.G148C | P07437 | protein_coding | deleterious_low_confidence(0) | probably_damaging(1) | TCGA-A7-A0DB-01 | Breast | breast invasive carcinoma | Female | <65 | I/II | Hormone Therapy | arimidex | SD |
| TUBB | SNV | Missense_Mutation | c.355G>A | p.Val119Met | p.V119M | P07437 | protein_coding | deleterious_low_confidence(0.03) | possibly_damaging(0.829) | TCGA-A7-A13D-01 | Breast | breast invasive carcinoma | Female | <65 | I/II | Chemotherapy | cytoxan | SD | |
| TUBB | SNV | Missense_Mutation | c.1327G>C | p.Glu443Gln | p.E443Q | P07437 | protein_coding | deleterious_low_confidence(0.04) | benign(0.403) | TCGA-D8-A1JA-01 | Breast | breast invasive carcinoma | Female | <65 | III/IV | Chemotherapy | adriamycin | PD | |
| TUBB | insertion | Nonsense_Mutation | novel | c.263_264insGTGATTG | p.Asp88GlufsTer2 | p.D88Efs*2 | P07437 | protein_coding | TCGA-A8-A094-01 | Breast | breast invasive carcinoma | Female | >=65 | I/II | Unknown | Unknown | SD | ||
| TUBB | insertion | Frame_Shift_Ins | novel | c.600_601insCATTTCCAGTATATCTATAAACCTTCCCTTC | p.Cys201HisfsTer13 | p.C201Hfs*13 | P07437 | protein_coding | TCGA-A8-A0A1-01 | Breast | breast invasive carcinoma | Female | >=65 | I/II | Hormone Therapy | tamoxiphen | SD | ||
| TUBB | SNV | Missense_Mutation | novel | c.830G>A | p.Gly277Glu | p.G277E | P07437 | protein_coding | deleterious_low_confidence(0.01) | possibly_damaging(0.796) | TCGA-C5-A7CJ-01 | Cervix | cervical & endocervical cancer | Female | <65 | I/II | Chemotherapy | cisplatin | SD |
| TUBB | SNV | Missense_Mutation | c.580N>C | p.Glu194Gln | p.E194Q | P07437 | protein_coding | deleterious_low_confidence(0.02) | probably_damaging(1) | TCGA-JW-A5VL-01 | Cervix | cervical & endocervical cancer | Female | <65 | I/II | Unknown | Unknown | SD | |
| TUBB | insertion | In_Frame_Ins | novel | c.369_370insGCAGAGGTT | p.Glu125_Ser126insValAlaGlu | p.E125_S126insVAE | P07437 | protein_coding | TCGA-DS-A1OB-01 | Cervix | cervical & endocervical cancer | Female | <65 | I/II | Chemotherapy | carboplatin | PD | ||
| TUBB | SNV | Missense_Mutation | c.8N>G | p.Glu3Gly | p.E3G | P07437 | protein_coding | deleterious_low_confidence(0) | probably_damaging(1) | TCGA-AA-3710-01 | Colorectum | colon adenocarcinoma | Female | >=65 | I/II | Unknown | Unknown | SD | |
| TUBB | SNV | Missense_Mutation | novel | c.951C>A | p.Phe317Leu | p.F317L | P07437 | protein_coding | deleterious_low_confidence(0.01) | probably_damaging(0.999) | TCGA-AA-A02E-01 | Colorectum | colon adenocarcinoma | Female | >=65 | III/IV | Unknown | Unknown | PD |
| Page: 1 2 3 |
Top |
Related drugs of malignant transformation related genes |
| Identification of chemicals and drugs interact with genes involved in malignant transfromation |
| (DGIdb 4.0) |
| Entrez ID | Symbol | Category | Interaction Types | Drug Claim Name | Drug Name | PMIDs |
| 203068 | TUBB | DRUGGABLE GENOME | inhibitor | 135652721 | PACLITAXEL | |
| 203068 | TUBB | DRUGGABLE GENOME | Simotaxel | SIMOTAXEL | ||
| 203068 | TUBB | DRUGGABLE GENOME | Tasidotin hydrochloride | |||
| 203068 | TUBB | DRUGGABLE GENOME | ALB-109564(a) | |||
| 203068 | TUBB | DRUGGABLE GENOME | NOCODAZOLE | NOCODAZOLE | 21194809,25815147,25369367,25262051,23313639 | |
| 203068 | TUBB | DRUGGABLE GENOME | Sphingosome Encapsulated Vinorelbine | |||
| 203068 | TUBB | DRUGGABLE GENOME | inhibitor | CHEMBL1201748 | CABAZITAXEL | |
| 203068 | TUBB | DRUGGABLE GENOME | inhibitor | 178103457 | VINBLASTINE | |
| 203068 | TUBB | DRUGGABLE GENOME | inhibitor | CHEMBL49642 | INDIBULIN | |
| 203068 | TUBB | DRUGGABLE GENOME | ZD-6126 | ZD-6126 |
| Page: 1 2 3 4 5 6 7 8 |

Copyright 2023-Present -The University of Texas Health Science Center at Houston |