
|
|||||
|
 | |
| |
| |
| |
| |
| |
|
Gene: TUBA4A |
Gene summary for TUBA4A |
| Gene information | Species | Human | Gene symbol | TUBA4A | Gene ID | 7277 |
| Gene name | tubulin alpha 4a | |
| Gene Alias | ALS22 | |
| Cytomap | 2q35 | |
| Gene Type | protein-coding | GO ID | GO:0000226 | UniProtAcc | P68366 |
Top |
Malignant transformation analysis |
| Identification of the aberrant gene expression in precancerous and cancerous lesions by comparing the gene expression of stem-like cells in diseased tissues with normal stem cells |
| Entrez ID | Symbol | Replicates | Species | Organ | Tissue | Adj P-value | Log2FC | Malignancy |
| 7277 | TUBA4A | GSM4909282 | Human | Breast | IDC | 2.97e-03 | 2.76e-01 | -0.0288 |
| 7277 | TUBA4A | GSM4909286 | Human | Breast | IDC | 9.60e-05 | -2.81e-01 | 0.1081 |
| 7277 | TUBA4A | GSM4909294 | Human | Breast | IDC | 3.00e-11 | -3.04e-01 | 0.2022 |
| 7277 | TUBA4A | GSM4909297 | Human | Breast | IDC | 3.85e-05 | -2.48e-01 | 0.1517 |
| 7277 | TUBA4A | GSM4909298 | Human | Breast | IDC | 5.85e-04 | -2.64e-01 | 0.1551 |
| 7277 | TUBA4A | GSM4909308 | Human | Breast | IDC | 7.82e-07 | -3.22e-01 | 0.158 |
| 7277 | TUBA4A | GSM4909311 | Human | Breast | IDC | 2.12e-10 | -2.58e-01 | 0.1534 |
| 7277 | TUBA4A | GSM4909312 | Human | Breast | IDC | 6.97e-07 | -2.55e-01 | 0.1552 |
| 7277 | TUBA4A | GSM4909319 | Human | Breast | IDC | 1.37e-13 | -2.59e-01 | 0.1563 |
| 7277 | TUBA4A | GSM4909320 | Human | Breast | IDC | 4.34e-02 | -2.87e-01 | 0.1575 |
| 7277 | TUBA4A | GSM4909321 | Human | Breast | IDC | 6.24e-11 | -3.15e-01 | 0.1559 |
| 7277 | TUBA4A | brca1 | Human | Breast | Precancer | 1.18e-29 | 6.64e-01 | -0.0338 |
| 7277 | TUBA4A | brca2 | Human | Breast | Precancer | 1.06e-19 | 5.10e-01 | -0.024 |
| 7277 | TUBA4A | brca3 | Human | Breast | Precancer | 7.48e-06 | 3.04e-01 | -0.0263 |
| 7277 | TUBA4A | NCCBC14 | Human | Breast | DCIS | 8.84e-04 | -2.41e-01 | 0.2021 |
| 7277 | TUBA4A | NCCBC3 | Human | Breast | DCIS | 1.96e-02 | -2.44e-01 | 0.1198 |
| 7277 | TUBA4A | NCCBC5 | Human | Breast | DCIS | 1.77e-06 | -2.63e-01 | 0.2046 |
| 7277 | TUBA4A | P1 | Human | Breast | IDC | 7.69e-08 | -1.24e-01 | 0.1527 |
| 7277 | TUBA4A | DCIS2 | Human | Breast | DCIS | 2.95e-39 | 1.21e-01 | 0.0085 |
| 7277 | TUBA4A | CA_HPV_1 | Human | Cervix | CC | 6.81e-04 | -1.66e-01 | 0.0264 |
| Page: 1 2 3 4 5 6 7 8 |
| Tissue | Expression Dynamics | Abbreviation |
| Breast |  | IDC: Invasive ductal carcinoma |
| DCIS: Ductal carcinoma in situ | ||
| Precancer(BRCA1-mut): Precancerous lesion from BRCA1 mutation carriers | ||
| Cervix | 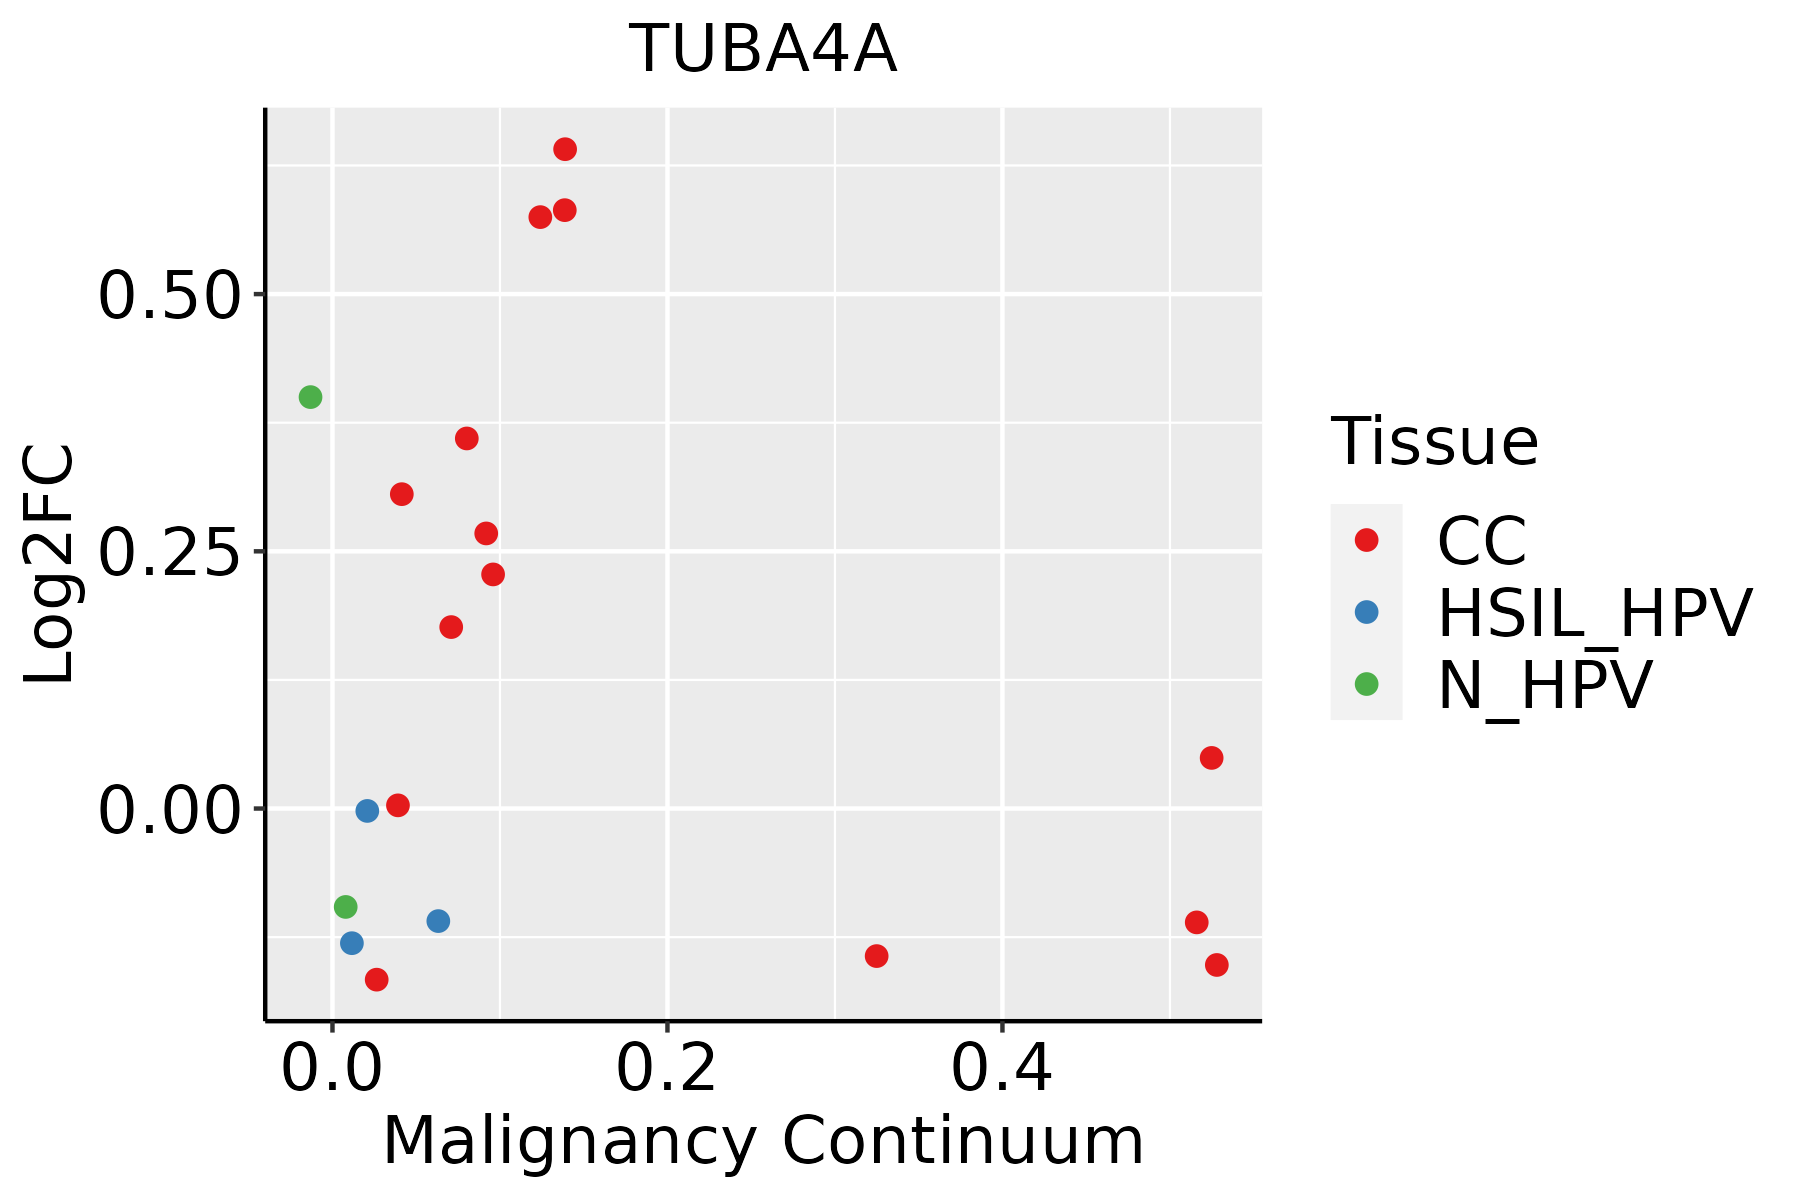 | CC: Cervix cancer |
| HSIL_HPV: HPV-infected high-grade squamous intraepithelial lesions | ||
| N_HPV: HPV-infected normal cervix | ||
| Esophagus | 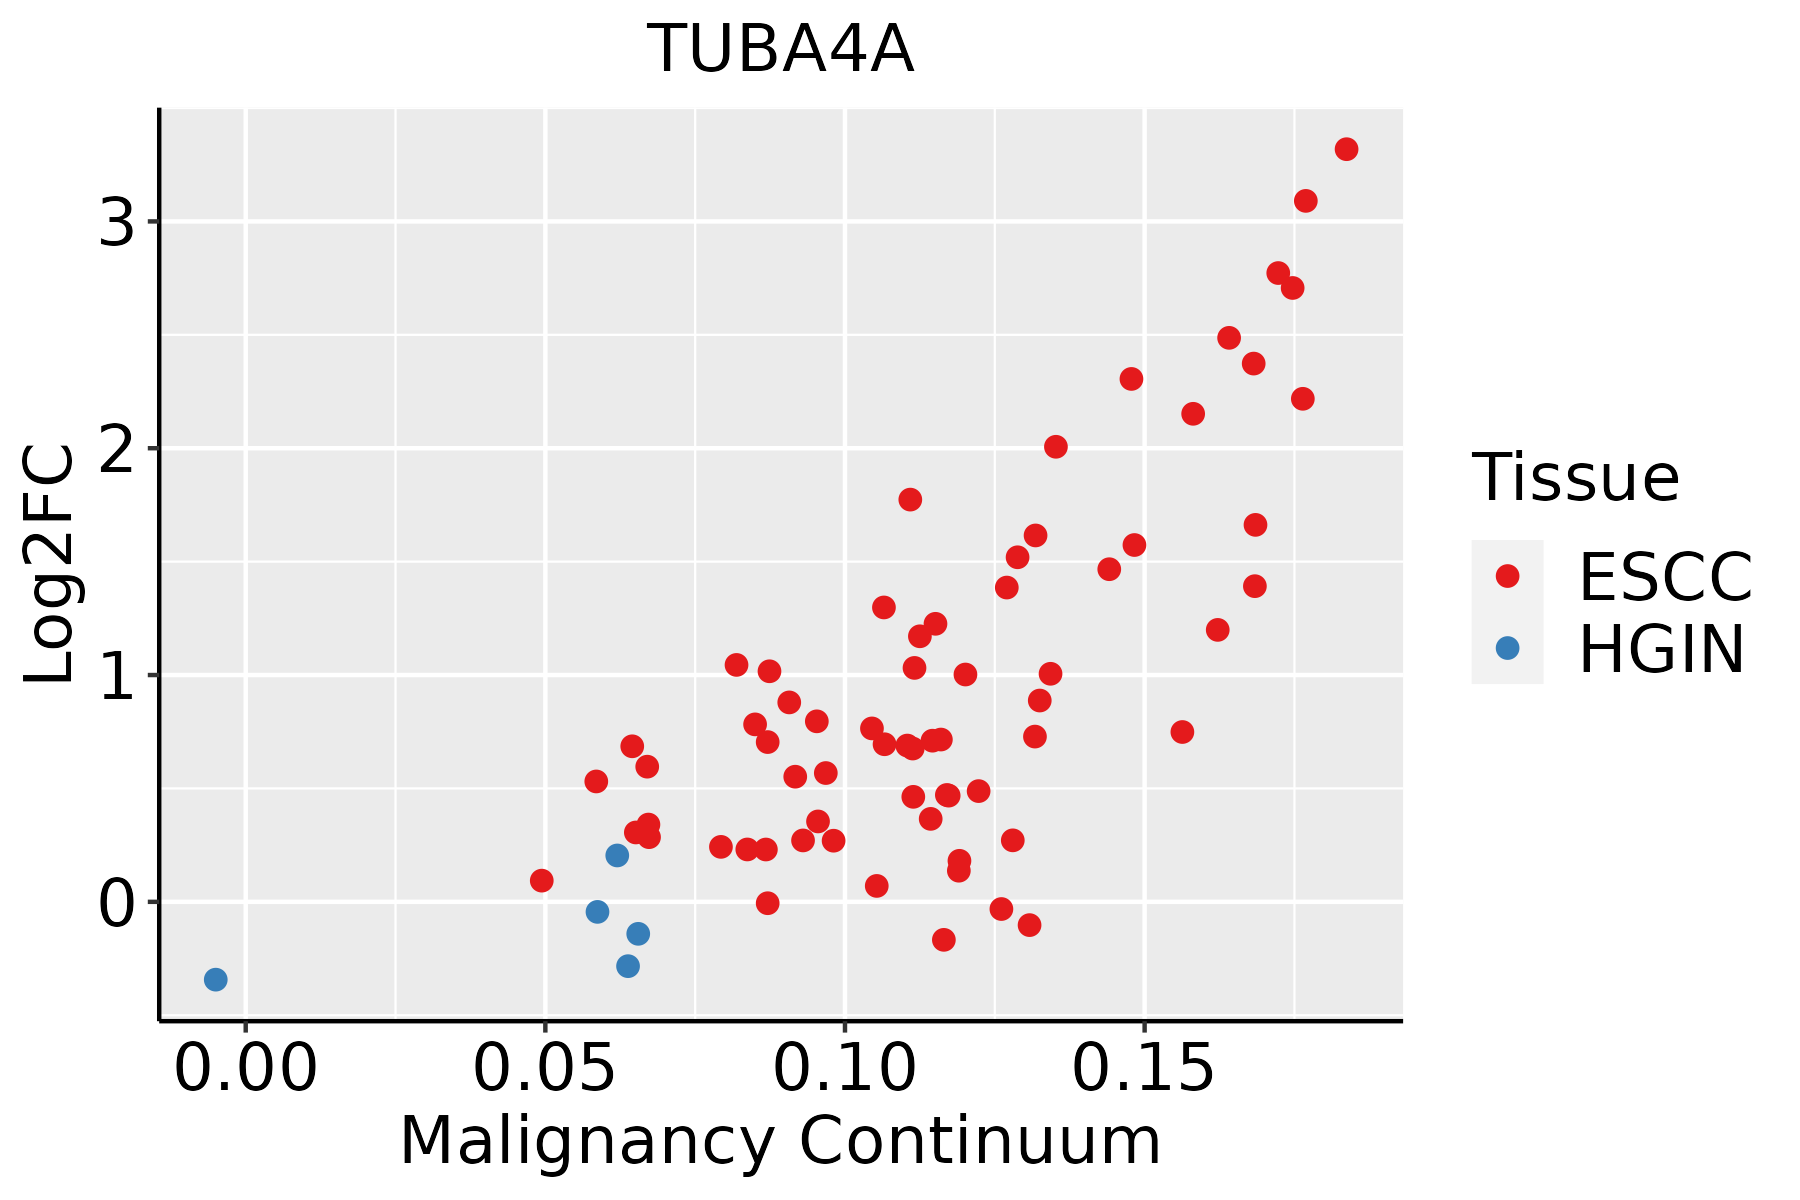 | ESCC: Esophageal squamous cell carcinoma |
| HGIN: High-grade intraepithelial neoplasias | ||
| LGIN: Low-grade intraepithelial neoplasias | ||
| Liver | 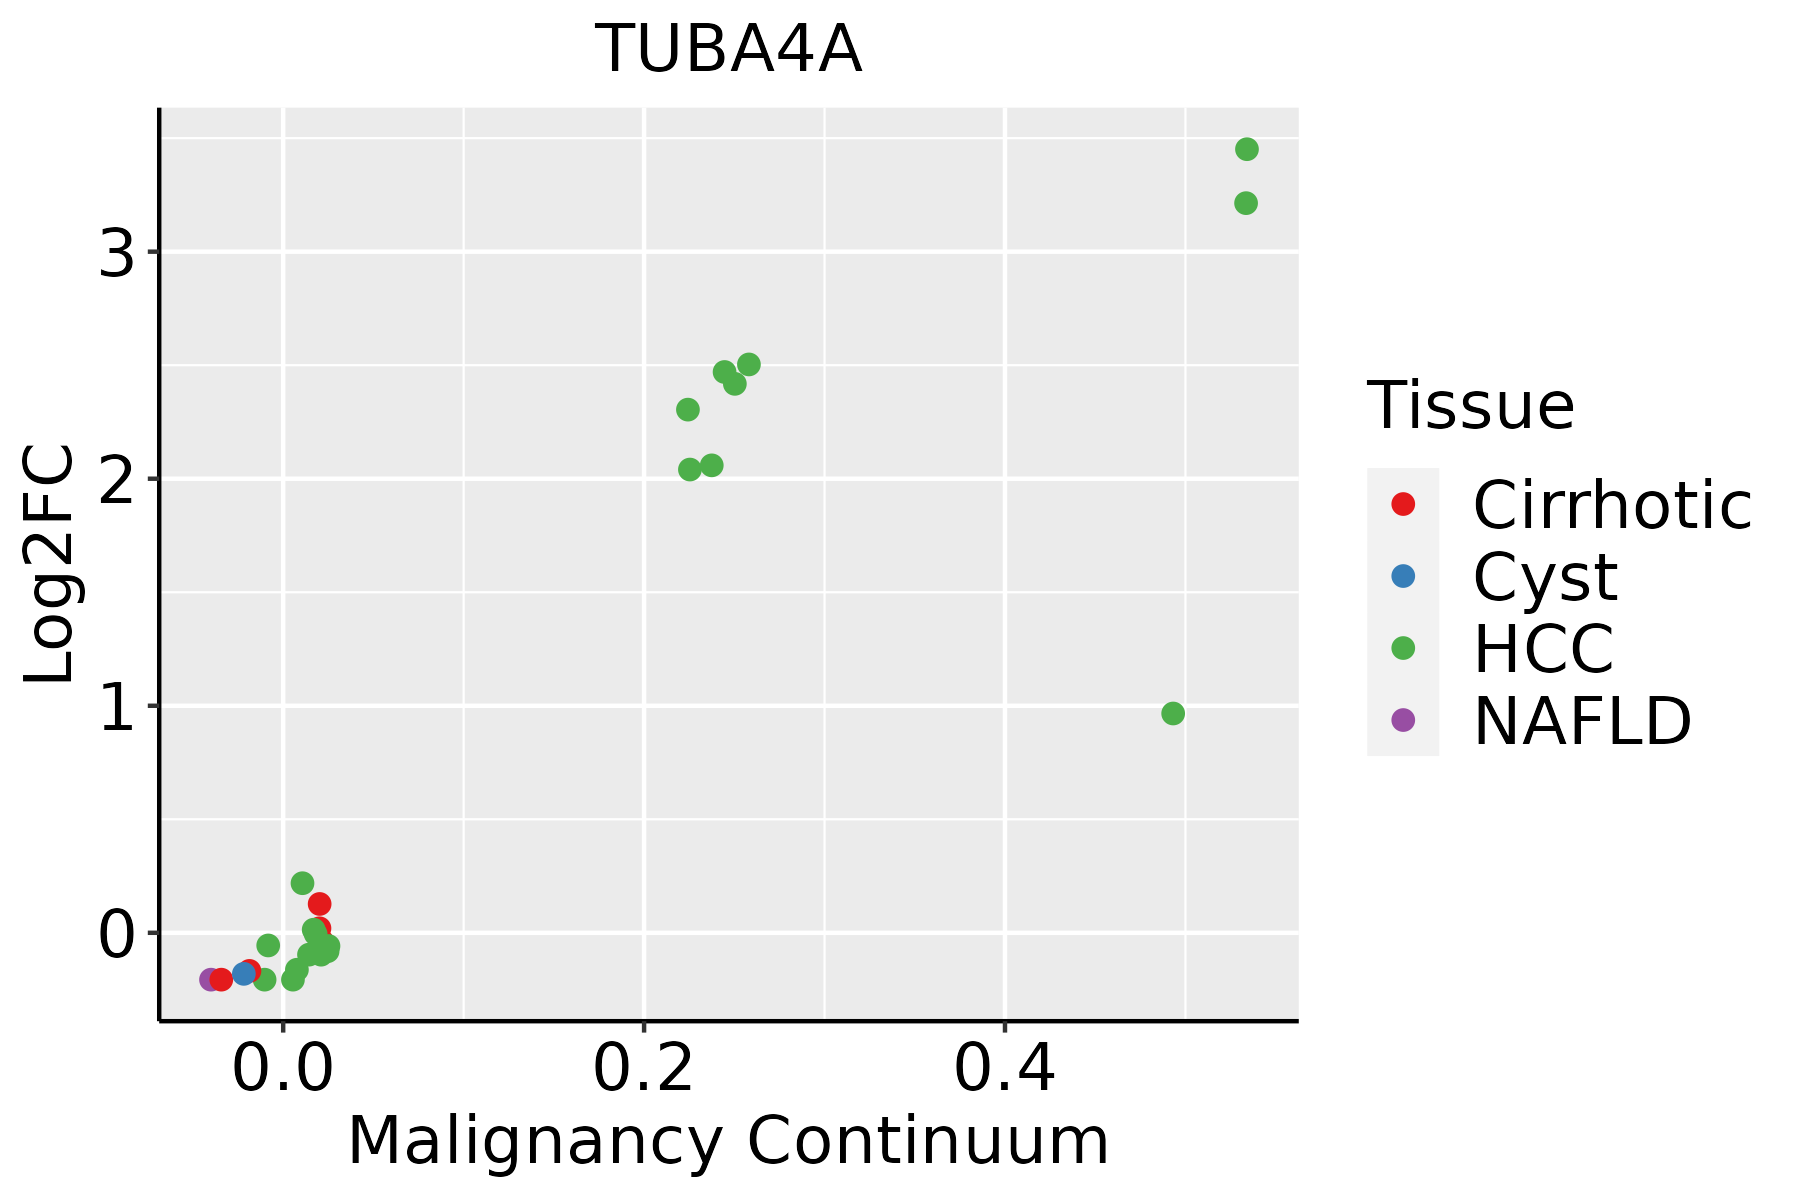 | HCC: Hepatocellular carcinoma |
| NAFLD: Non-alcoholic fatty liver disease | ||
| Oral Cavity | 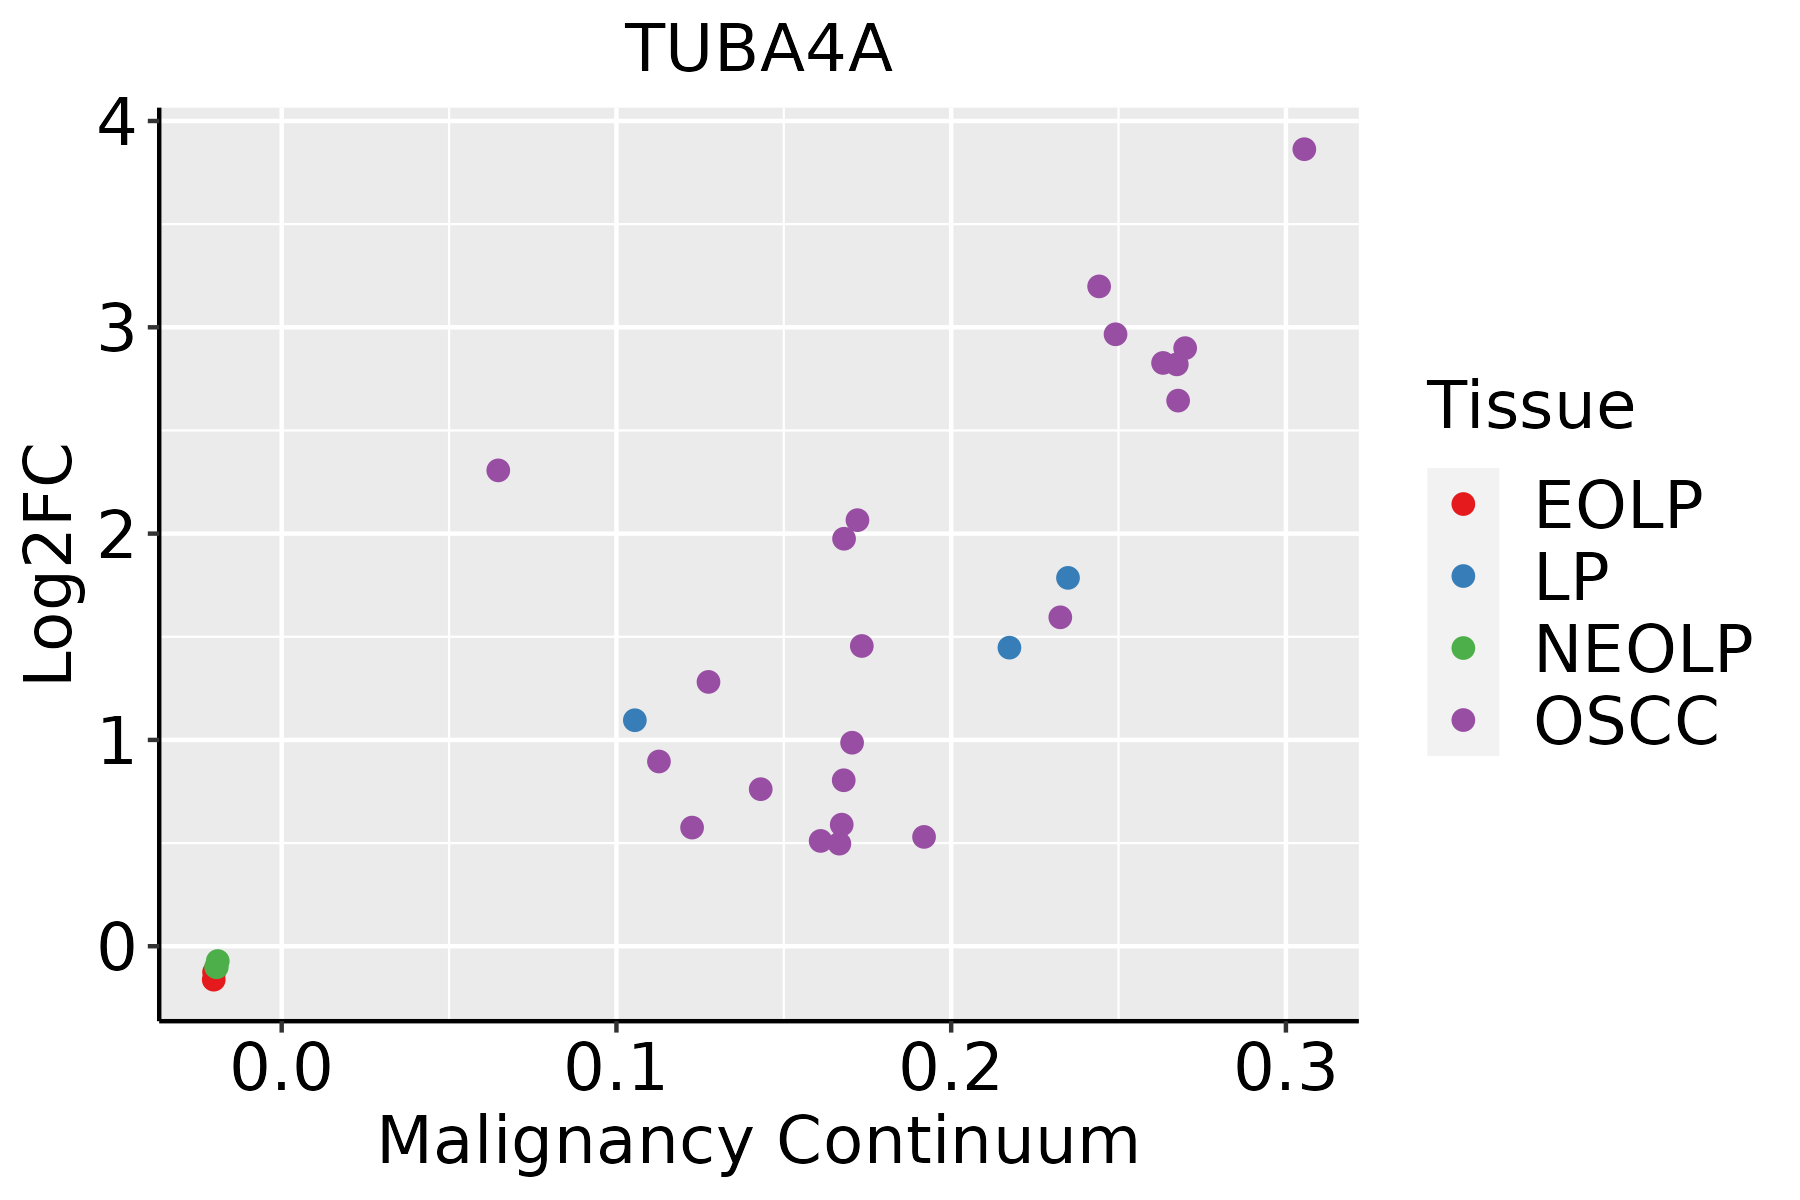 | EOLP: Erosive Oral lichen planus |
| LP: leukoplakia | ||
| NEOLP: Non-erosive oral lichen planus | ||
| OSCC: Oral squamous cell carcinoma | ||
| Prostate | 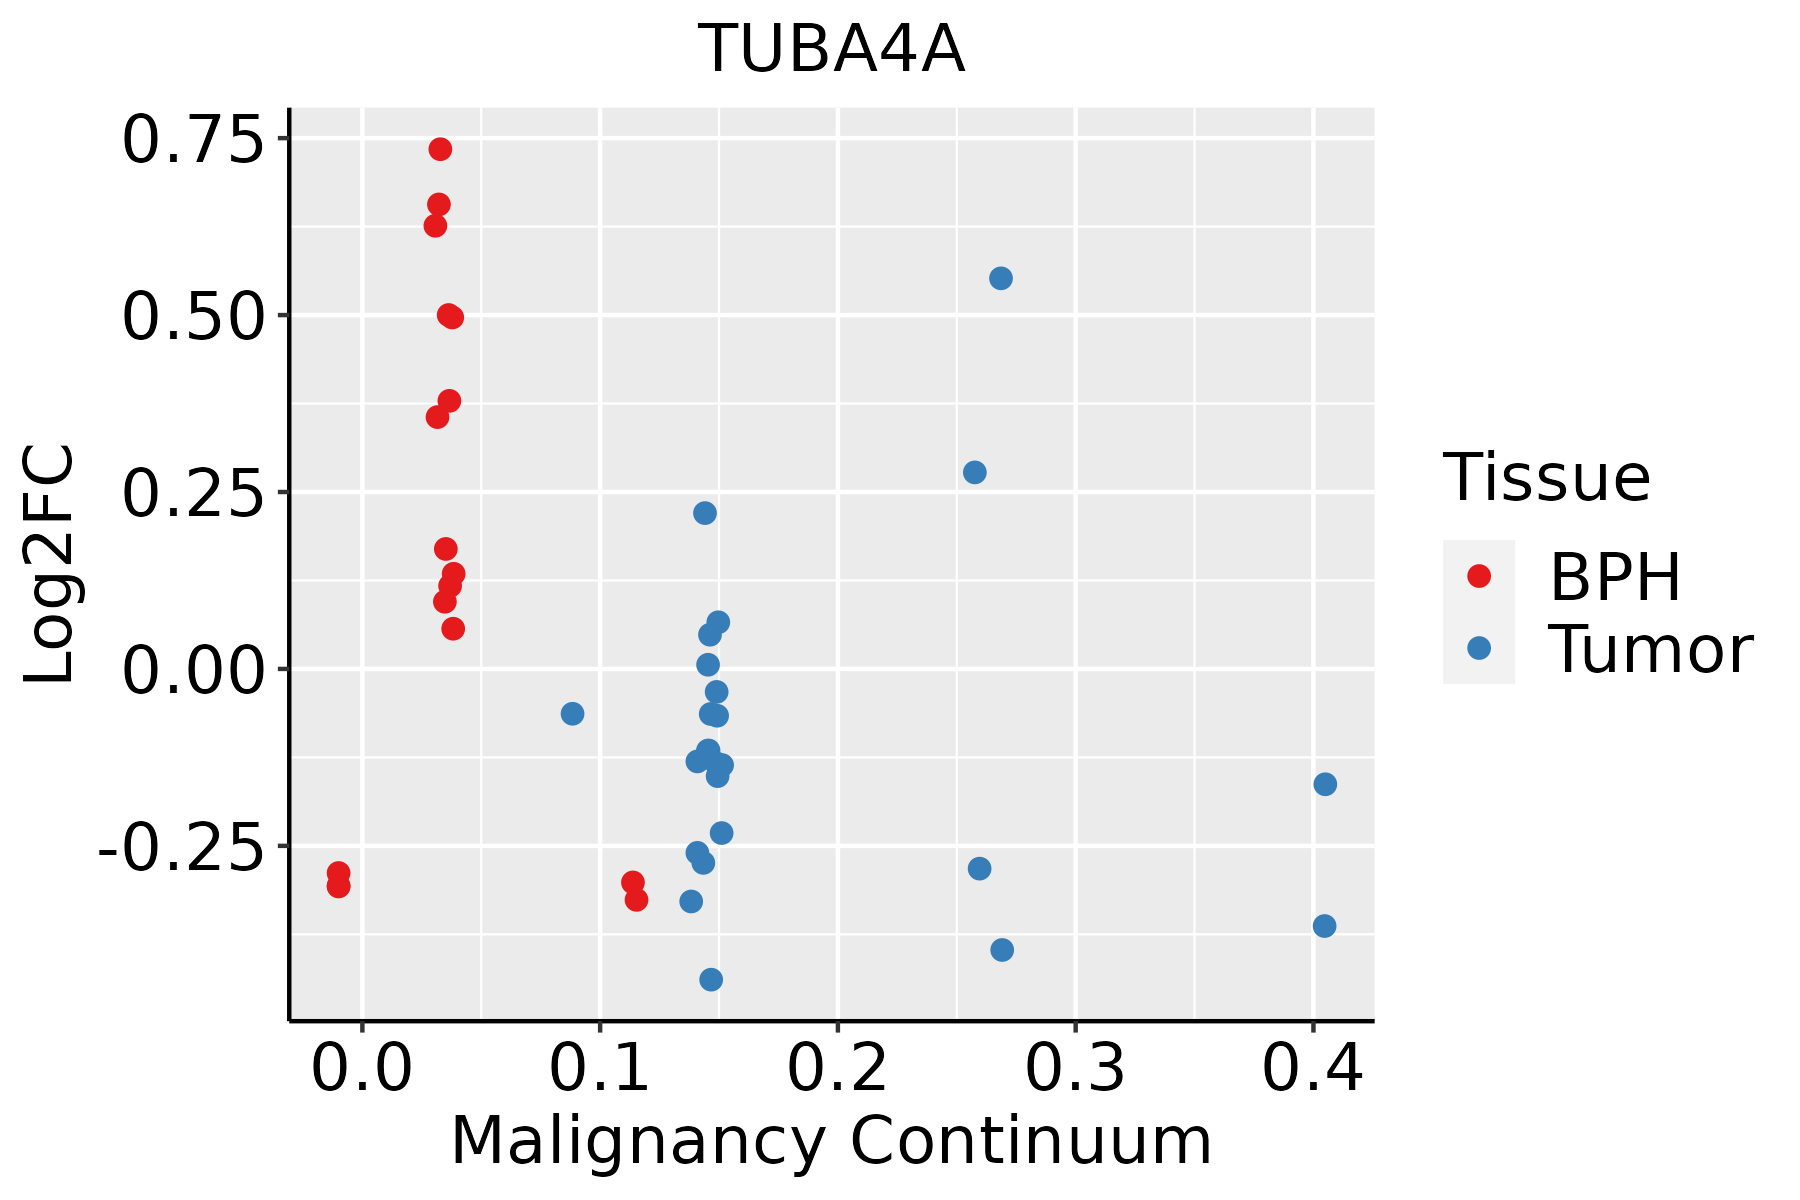 | BPH: Benign Prostatic Hyperplasia |
| Skin | 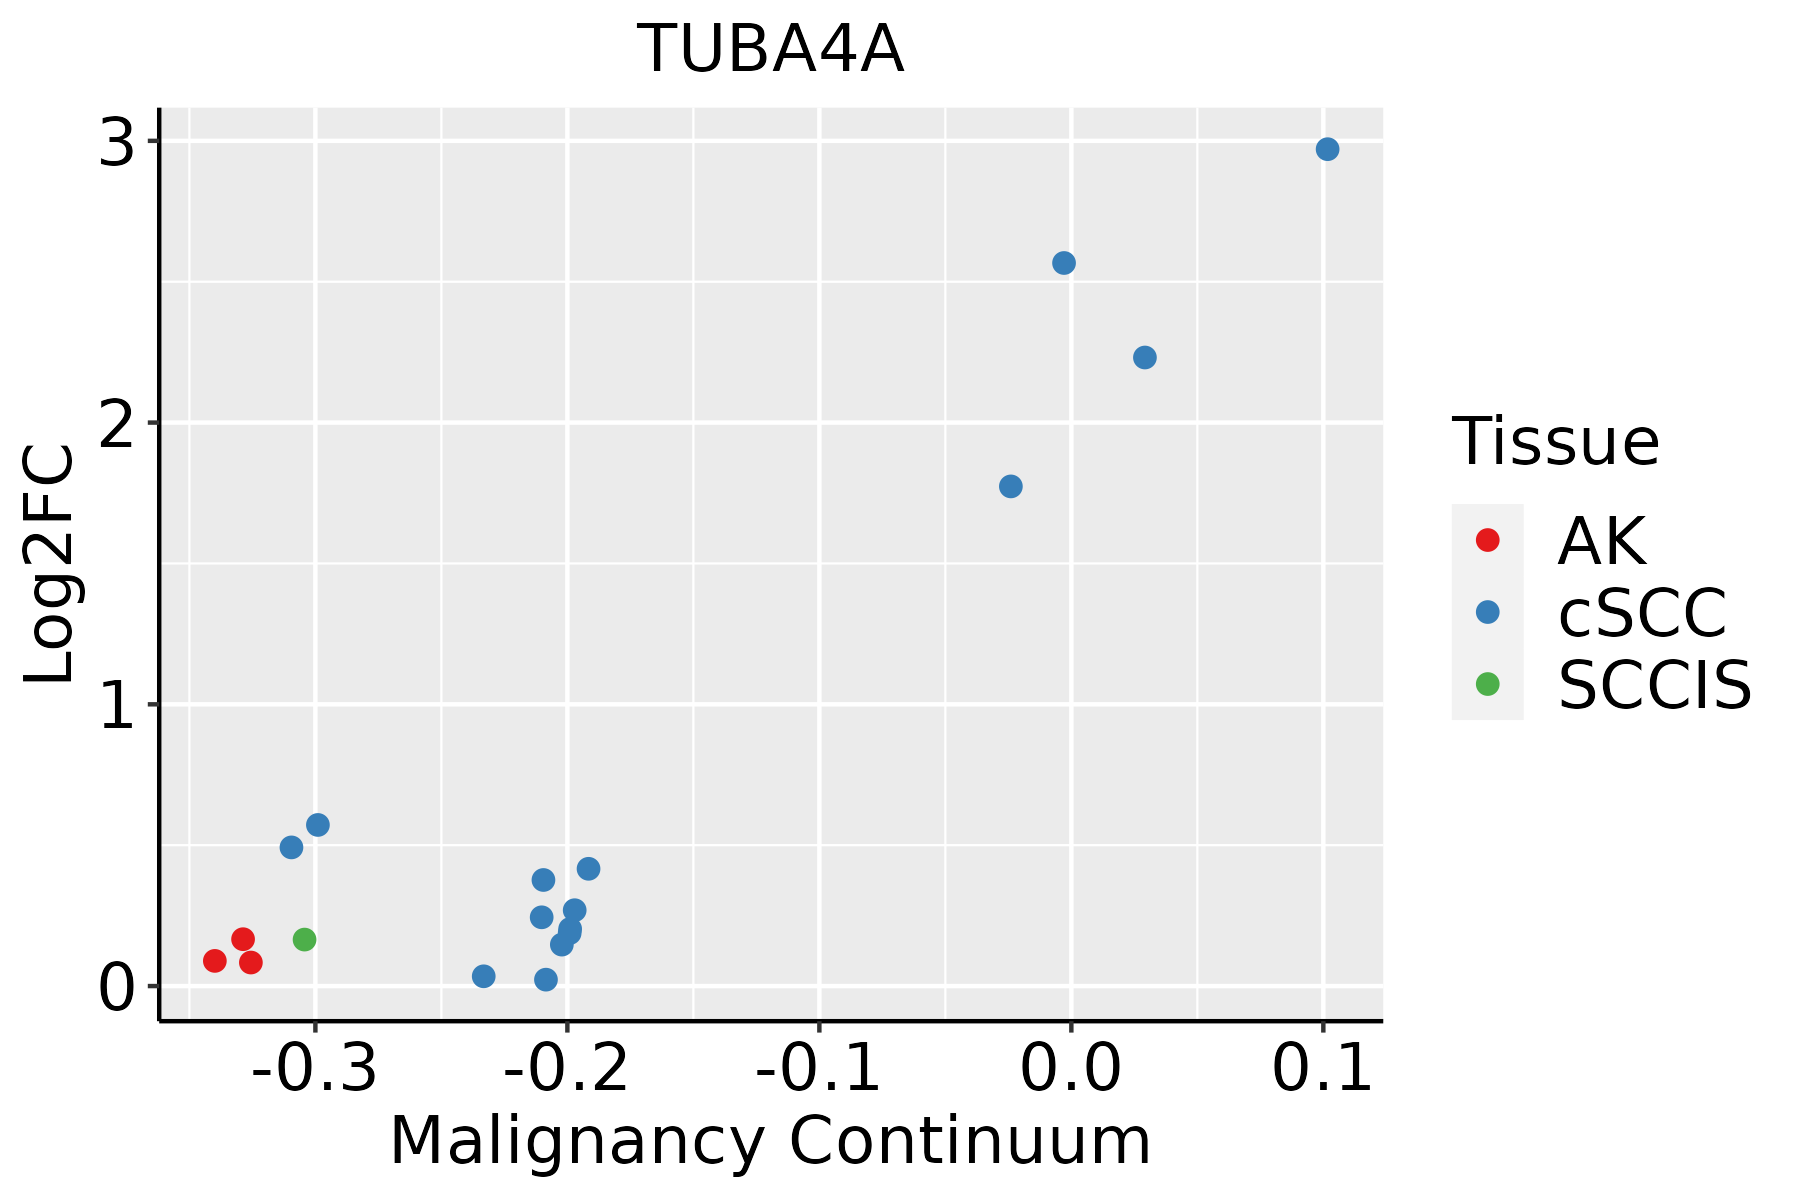 | AK: Actinic keratosis |
| cSCC: Cutaneous squamous cell carcinoma | ||
| SCCIS:squamous cell carcinoma in situ |
| ∗log2FC in expression of this searched gene in stem-like cells from each diseased tissue sample relative to stem-like cells in normal samples in each tissue plotted against the malignancy continuum. Samples are colored based on if they are from different disease stage. |
Top |
Malignant transformation related pathway analysis |
| Find out the enriched GO biological processes and KEGG pathways involved in transition from healthy to precancer to cancer |
| Tissue | Disease Stage | Enriched GO biological Processes |
| Colorectum | AD |  |
| Colorectum | SER |  |
| Colorectum | MSS |  |
| Colorectum | MSI-H |  |
| Colorectum | FAP |  |
| ∗Top 15 enriched GO BP terms are showed in the bar plot of each disease state in each tissue. Each row represents a significant GO biological process which is colored according to the -log10(p.adjust). |
| Page: 1 2 3 4 5 6 7 8 9 |
| GO ID | Tissue | Disease Stage | Description | Gene Ratio | Bg Ratio | pvalue | p.adjust | Count |
| Page: 1 |
| Pathway ID | Tissue | Disease Stage | Description | Gene Ratio | Bg Ratio | pvalue | p.adjust | qvalue | Count |
| hsa0501218 | Breast | Precancer | Parkinson disease | 99/684 | 266/8465 | 3.58e-42 | 5.65e-40 | 4.33e-40 | 99 |
| hsa0502016 | Breast | Precancer | Prion disease | 95/684 | 273/8465 | 1.39e-37 | 1.46e-35 | 1.12e-35 | 95 |
| hsa0501616 | Breast | Precancer | Huntington disease | 98/684 | 306/8465 | 2.85e-35 | 2.25e-33 | 1.72e-33 | 98 |
| hsa0501016 | Breast | Precancer | Alzheimer disease | 103/684 | 384/8465 | 1.03e-29 | 4.66e-28 | 3.57e-28 | 103 |
| hsa0501416 | Breast | Precancer | Amyotrophic lateral sclerosis | 98/684 | 364/8465 | 2.13e-28 | 8.41e-27 | 6.44e-27 | 98 |
| hsa0502216 | Breast | Precancer | Pathways of neurodegeneration - multiple diseases | 112/684 | 476/8465 | 6.96e-27 | 2.44e-25 | 1.87e-25 | 112 |
| hsa0513218 | Breast | Precancer | Salmonella infection | 49/684 | 249/8465 | 2.92e-09 | 6.15e-08 | 4.71e-08 | 49 |
| hsa0513018 | Breast | Precancer | Pathogenic Escherichia coli infection | 38/684 | 197/8465 | 3.12e-07 | 5.81e-06 | 4.45e-06 | 38 |
| hsa0453018 | Breast | Precancer | Tight junction | 31/684 | 169/8465 | 1.13e-05 | 1.26e-04 | 9.64e-05 | 31 |
| hsa0414518 | Breast | Precancer | Phagosome | 27/684 | 152/8465 | 7.37e-05 | 6.85e-04 | 5.25e-04 | 27 |
| hsa042108 | Breast | Precancer | Apoptosis | 25/684 | 136/8465 | 7.61e-05 | 6.87e-04 | 5.26e-04 | 25 |
| hsa0501219 | Breast | Precancer | Parkinson disease | 99/684 | 266/8465 | 3.58e-42 | 5.65e-40 | 4.33e-40 | 99 |
| hsa0502017 | Breast | Precancer | Prion disease | 95/684 | 273/8465 | 1.39e-37 | 1.46e-35 | 1.12e-35 | 95 |
| hsa0501617 | Breast | Precancer | Huntington disease | 98/684 | 306/8465 | 2.85e-35 | 2.25e-33 | 1.72e-33 | 98 |
| hsa0501017 | Breast | Precancer | Alzheimer disease | 103/684 | 384/8465 | 1.03e-29 | 4.66e-28 | 3.57e-28 | 103 |
| hsa0501417 | Breast | Precancer | Amyotrophic lateral sclerosis | 98/684 | 364/8465 | 2.13e-28 | 8.41e-27 | 6.44e-27 | 98 |
| hsa0502217 | Breast | Precancer | Pathways of neurodegeneration - multiple diseases | 112/684 | 476/8465 | 6.96e-27 | 2.44e-25 | 1.87e-25 | 112 |
| hsa0513219 | Breast | Precancer | Salmonella infection | 49/684 | 249/8465 | 2.92e-09 | 6.15e-08 | 4.71e-08 | 49 |
| hsa0513019 | Breast | Precancer | Pathogenic Escherichia coli infection | 38/684 | 197/8465 | 3.12e-07 | 5.81e-06 | 4.45e-06 | 38 |
| hsa0453019 | Breast | Precancer | Tight junction | 31/684 | 169/8465 | 1.13e-05 | 1.26e-04 | 9.64e-05 | 31 |
| Page: 1 2 3 4 5 6 7 8 9 10 11 12 13 14 |
Top |
Cell-cell communication analysis |
| Identification of potential cell-cell interactions between two cell types and their ligand-receptor pairs for different disease states |
| Ligand | Receptor | LRpair | Pathway | Tissue | Disease Stage |
| Page: 1 |
Top |
Single-cell gene regulatory network inference analysis |
| Find out the significant the regulons (TFs) and the target genes of each regulon across cell types for different disease states |
| TF | Cell Type | Tissue | Disease Stage | Target Gene | RSS | Regulon Activity |
| ∗The dot plots of a searched regulon are shown for all cell subpopulations in each disease state of each tissue based on the regulon specific score inferred using pySCENIC and by calculating the average expression. |
| Page: 1 |
Top |
Somatic mutation of malignant transformation related genes |
| Annotation of somatic variants for genes involved in malignant transformation |
| Hugo Symbol | Variant Class | Variant Classification | dbSNP RS | HGVSc | HGVSp | HGVSp Short | SWISSPROT | BIOTYPE | SIFT | PolyPhen | Tumor Sample Barcode | Tissue | Histology | Sex | Age | Stage | Therapy Types | Drugs | Outcome |
| TUBA4A | SNV | Missense_Mutation | c.473C>G | p.Ser158Cys | p.S158C | P68366 | protein_coding | deleterious_low_confidence(0.01) | probably_damaging(0.999) | TCGA-EW-A1J5-01 | Breast | breast invasive carcinoma | Female | <65 | I/II | Chemotherapy | adriamycin | SD | |
| TUBA4A | insertion | Frame_Shift_Ins | novel | c.301_302insC | p.Asn101ThrfsTer16 | p.N101Tfs*16 | P68366 | protein_coding | TCGA-AN-A04C-01 | Breast | breast invasive carcinoma | Female | <65 | I/II | Unknown | Unknown | SD | ||
| TUBA4A | insertion | Frame_Shift_Ins | novel | c.300_301insCTGGAGAAGGATTATGAGGAGGTGGGCATCG | p.Asn101LeufsTer26 | p.N101Lfs*26 | P68366 | protein_coding | TCGA-AN-A04C-01 | Breast | breast invasive carcinoma | Female | <65 | I/II | Unknown | Unknown | SD | ||
| TUBA4A | SNV | Missense_Mutation | novel | c.1153N>A | p.Ala385Thr | p.A385T | P68366 | protein_coding | tolerated_low_confidence(0.05) | benign(0.074) | TCGA-JW-AAVH-01 | Cervix | cervical & endocervical cancer | Female | <65 | I/II | Unknown | Unknown | SD |
| TUBA4A | SNV | Missense_Mutation | novel | c.889G>C | p.Glu297Gln | p.E297Q | P68366 | protein_coding | deleterious_low_confidence(0.02) | probably_damaging(0.911) | TCGA-VS-A8QA-01 | Cervix | cervical & endocervical cancer | Female | <65 | I/II | Unknown | Unknown | SD |
| TUBA4A | deletion | Frame_Shift_Del | novel | c.1097delN | p.Gly366ValfsTer13 | p.G366Vfs*13 | P68366 | protein_coding | TCGA-EA-A410-01 | Cervix | cervical & endocervical cancer | Female | <65 | I/II | Unknown | Unknown | SD | ||
| TUBA4A | SNV | Missense_Mutation | novel | c.977N>G | p.Lys326Arg | p.K326R | P68366 | protein_coding | tolerated_low_confidence(0.06) | benign(0.285) | TCGA-AA-3811-01 | Colorectum | colon adenocarcinoma | Female | >=65 | III/IV | Unknown | Unknown | PD |
| TUBA4A | SNV | Missense_Mutation | c.236G>A | p.Arg79Gln | p.R79Q | P68366 | protein_coding | deleterious_low_confidence(0.02) | benign(0.079) | TCGA-AA-3977-01 | Colorectum | colon adenocarcinoma | Male | >=65 | I/II | Unknown | Unknown | SD | |
| TUBA4A | SNV | Missense_Mutation | c.236G>A | p.Arg79Gln | p.R79Q | P68366 | protein_coding | deleterious_low_confidence(0.02) | benign(0.079) | TCGA-AA-A00N-01 | Colorectum | colon adenocarcinoma | Male | >=65 | I/II | Unknown | Unknown | PD | |
| TUBA4A | SNV | Missense_Mutation | c.629A>G | p.Tyr210Cys | p.Y210C | P68366 | protein_coding | deleterious_low_confidence(0.01) | probably_damaging(0.997) | TCGA-CK-5916-01 | Colorectum | colon adenocarcinoma | Female | >=65 | I/II | Unknown | Unknown | PD |
| Page: 1 2 3 4 5 6 |
Top |
Related drugs of malignant transformation related genes |
| Identification of chemicals and drugs interact with genes involved in malignant transfromation |
| (DGIdb 4.0) |
| Entrez ID | Symbol | Category | Interaction Types | Drug Claim Name | Drug Name | PMIDs |
| 7277 | TUBA4A | DRUGGABLE GENOME | MAYTANSINOL | MAYTANSINOL | 563462 | |
| 7277 | TUBA4A | DRUGGABLE GENOME | inhibitor | CHEMBL49642 | INDIBULIN | |
| 7277 | TUBA4A | DRUGGABLE GENOME | CHEMBL2304041 | SAGOPILONE | ||
| 7277 | TUBA4A | DRUGGABLE GENOME | 4-(PHENYLCARBAMOYL)BENZYLNITRATE | CHEMBL1795737 | 21664138 | |
| 7277 | TUBA4A | DRUGGABLE GENOME | NSC-753582 | CHEMBL2036124 | 22543234 | |
| 7277 | TUBA4A | DRUGGABLE GENOME | inhibitor | CHEMBL538943 | VINORELBINE TARTRATE | |
| 7277 | TUBA4A | DRUGGABLE GENOME | inhibitor | CHEMBL1742994 | BRENTUXIMAB VEDOTIN | |
| 7277 | TUBA4A | DRUGGABLE GENOME | inhibitor | CHEMBL3545252 | DOCETAXEL | |
| 7277 | TUBA4A | DRUGGABLE GENOME | CHEMBL2103826 | DAVUNETIDE | ||
| 7277 | TUBA4A | DRUGGABLE GENOME | inhibitor | CHEMBL428647 | PACLITAXEL |
| Page: 1 2 3 4 5 |

Copyright 2023-Present -The University of Texas Health Science Center at Houston |