
|
|||||
|
 | |
| |
| |
| |
| |
| |
|
Gene: TUBA3C |
Gene summary for TUBA3C |
| Gene information | Species | Human | Gene symbol | TUBA3C | Gene ID | 7278 |
| Gene name | tubulin alpha 3c | |
| Gene Alias | TUBA2 | |
| Cytomap | 13q12.11 | |
| Gene Type | protein-coding | GO ID | GO:0000226 | UniProtAcc | Q13748 |
Top |
Malignant transformation analysis |
| Identification of the aberrant gene expression in precancerous and cancerous lesions by comparing the gene expression of stem-like cells in diseased tissues with normal stem cells |
| Entrez ID | Symbol | Replicates | Species | Organ | Tissue | Adj P-value | Log2FC | Malignancy |
| 7278 | TUBA3C | S014 | Human | Liver | HCC | 1.27e-04 | 5.16e-01 | 0.2254 |
| 7278 | TUBA3C | S015 | Human | Liver | HCC | 2.60e-11 | 6.58e-01 | 0.2375 |
| 7278 | TUBA3C | S016 | Human | Liver | HCC | 1.12e-03 | 3.35e-01 | 0.2243 |
| Page: 1 |
| Tissue | Expression Dynamics | Abbreviation |
| Liver | 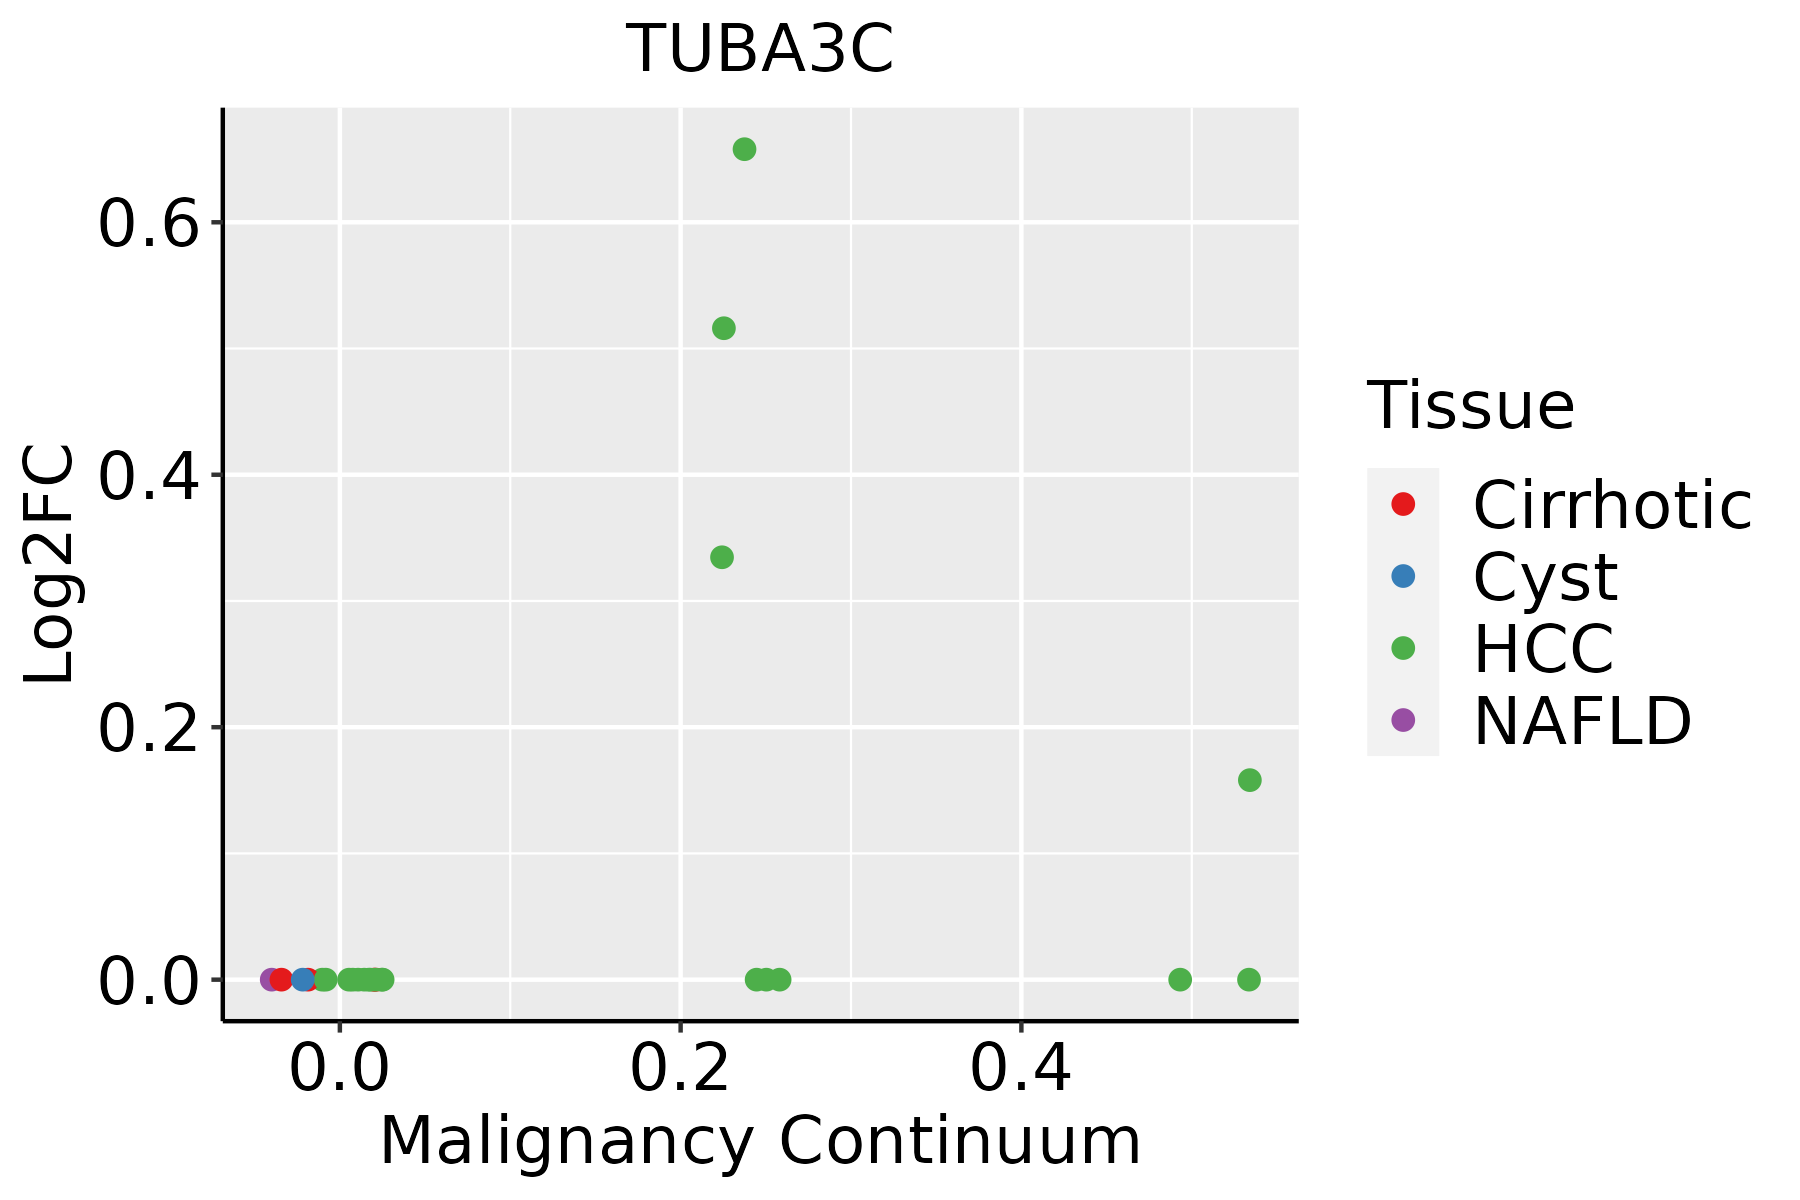 | HCC: Hepatocellular carcinoma |
| NAFLD: Non-alcoholic fatty liver disease |
| ∗log2FC in expression of this searched gene in stem-like cells from each diseased tissue sample relative to stem-like cells in normal samples in each tissue plotted against the malignancy continuum. Samples are colored based on if they are from different disease stage. |
Top |
Malignant transformation related pathway analysis |
| Find out the enriched GO biological processes and KEGG pathways involved in transition from healthy to precancer to cancer |
| Tissue | Disease Stage | Enriched GO biological Processes |
| Colorectum | AD |  |
| Colorectum | SER |  |
| Colorectum | MSS |  |
| Colorectum | MSI-H |  |
| Colorectum | FAP |  |
| ∗Top 15 enriched GO BP terms are showed in the bar plot of each disease state in each tissue. Each row represents a significant GO biological process which is colored according to the -log10(p.adjust). |
| Page: 1 2 3 4 5 6 7 8 9 |
| GO ID | Tissue | Disease Stage | Description | Gene Ratio | Bg Ratio | pvalue | p.adjust | Count |
| Page: 1 |
| Pathway ID | Tissue | Disease Stage | Description | Gene Ratio | Bg Ratio | pvalue | p.adjust | qvalue | Count |
| hsa0501222 | Liver | HCC | Parkinson disease | 198/4020 | 266/8465 | 9.40e-20 | 1.58e-17 | 8.76e-18 | 198 |
| hsa0501622 | Liver | HCC | Huntington disease | 219/4020 | 306/8465 | 3.06e-18 | 3.42e-16 | 1.90e-16 | 219 |
| hsa0501422 | Liver | HCC | Amyotrophic lateral sclerosis | 252/4020 | 364/8465 | 8.85e-18 | 7.41e-16 | 4.12e-16 | 252 |
| hsa0502022 | Liver | HCC | Prion disease | 195/4020 | 273/8465 | 3.26e-16 | 1.56e-14 | 8.67e-15 | 195 |
| hsa0513242 | Liver | HCC | Salmonella infection | 178/4020 | 249/8465 | 5.90e-15 | 1.98e-13 | 1.10e-13 | 178 |
| hsa0501022 | Liver | HCC | Alzheimer disease | 254/4020 | 384/8465 | 3.75e-14 | 8.97e-13 | 4.99e-13 | 254 |
| hsa0502222 | Liver | HCC | Pathways of neurodegeneration - multiple diseases | 298/4020 | 476/8465 | 6.59e-12 | 1.30e-10 | 7.22e-11 | 298 |
| hsa0513042 | Liver | HCC | Pathogenic Escherichia coli infection | 129/4020 | 197/8465 | 2.02e-07 | 2.50e-06 | 1.39e-06 | 129 |
| hsa0414521 | Liver | HCC | Phagosome | 93/4020 | 152/8465 | 4.27e-04 | 1.88e-03 | 1.05e-03 | 93 |
| hsa0501232 | Liver | HCC | Parkinson disease | 198/4020 | 266/8465 | 9.40e-20 | 1.58e-17 | 8.76e-18 | 198 |
| hsa0501632 | Liver | HCC | Huntington disease | 219/4020 | 306/8465 | 3.06e-18 | 3.42e-16 | 1.90e-16 | 219 |
| hsa0501432 | Liver | HCC | Amyotrophic lateral sclerosis | 252/4020 | 364/8465 | 8.85e-18 | 7.41e-16 | 4.12e-16 | 252 |
| hsa0502032 | Liver | HCC | Prion disease | 195/4020 | 273/8465 | 3.26e-16 | 1.56e-14 | 8.67e-15 | 195 |
| hsa0513252 | Liver | HCC | Salmonella infection | 178/4020 | 249/8465 | 5.90e-15 | 1.98e-13 | 1.10e-13 | 178 |
| hsa0501032 | Liver | HCC | Alzheimer disease | 254/4020 | 384/8465 | 3.75e-14 | 8.97e-13 | 4.99e-13 | 254 |
| hsa0502232 | Liver | HCC | Pathways of neurodegeneration - multiple diseases | 298/4020 | 476/8465 | 6.59e-12 | 1.30e-10 | 7.22e-11 | 298 |
| hsa0513052 | Liver | HCC | Pathogenic Escherichia coli infection | 129/4020 | 197/8465 | 2.02e-07 | 2.50e-06 | 1.39e-06 | 129 |
| hsa0414531 | Liver | HCC | Phagosome | 93/4020 | 152/8465 | 4.27e-04 | 1.88e-03 | 1.05e-03 | 93 |
| Page: 1 |
Top |
Cell-cell communication analysis |
| Identification of potential cell-cell interactions between two cell types and their ligand-receptor pairs for different disease states |
| Ligand | Receptor | LRpair | Pathway | Tissue | Disease Stage |
| Page: 1 |
Top |
Single-cell gene regulatory network inference analysis |
| Find out the significant the regulons (TFs) and the target genes of each regulon across cell types for different disease states |
| TF | Cell Type | Tissue | Disease Stage | Target Gene | RSS | Regulon Activity |
| ∗The dot plots of a searched regulon are shown for all cell subpopulations in each disease state of each tissue based on the regulon specific score inferred using pySCENIC and by calculating the average expression. |
| Page: 1 |
Top |
Somatic mutation of malignant transformation related genes |
| Annotation of somatic variants for genes involved in malignant transformation |
| Hugo Symbol | Variant Class | Variant Classification | dbSNP RS | HGVSc | HGVSp | HGVSp Short | SWISSPROT | BIOTYPE | SIFT | PolyPhen | Tumor Sample Barcode | Tissue | Histology | Sex | Age | Stage | Therapy Types | Drugs | Outcome |
| TUBA3C | SNV | Missense_Mutation | c.368N>A | p.Arg123His | p.R123H | Q13748 | protein_coding | deleterious_low_confidence(0.02) | benign(0.127) | TCGA-A2-A0CP-01 | Breast | breast invasive carcinoma | Female | <65 | I/II | Chemotherapy | cytoxan | SD | |
| TUBA3C | SNV | Missense_Mutation | rs752908038 | c.1118N>A | p.Arg373Gln | p.R373Q | Q13748 | protein_coding | deleterious_low_confidence(0.02) | benign(0.364) | TCGA-AR-A2LL-01 | Breast | breast invasive carcinoma | Female | >=65 | I/II | Hormone Therapy | tamoxiphen | SD |
| TUBA3C | SNV | Missense_Mutation | c.293N>T | p.Asp98Val | p.D98V | Q13748 | protein_coding | deleterious_low_confidence(0) | possibly_damaging(0.889) | TCGA-BH-A1F2-01 | Breast | breast invasive carcinoma | Female | <65 | III/IV | Unknown | Unknown | SD | |
| TUBA3C | insertion | Frame_Shift_Ins | novel | c.72_73insGATG | p.Cys25AspfsTer16 | p.C25Dfs*16 | Q13748 | protein_coding | TCGA-A8-A0A1-01 | Breast | breast invasive carcinoma | Female | >=65 | I/II | Hormone Therapy | tamoxiphen | SD | ||
| TUBA3C | insertion | Nonsense_Mutation | novel | c.71_72insAGCATTTTTAACTTACAGCCTT | p.Tyr24Ter | p.Y24* | Q13748 | protein_coding | TCGA-A8-A0A1-01 | Breast | breast invasive carcinoma | Female | >=65 | I/II | Hormone Therapy | tamoxiphen | SD | ||
| TUBA3C | insertion | Frame_Shift_Ins | novel | c.1290_1291insC | p.Asp431ArgfsTer3 | p.D431Rfs*3 | Q13748 | protein_coding | TCGA-BH-A0DZ-01 | Breast | breast invasive carcinoma | Female | <65 | I/II | Chemotherapy | docetaxel | SD | ||
| TUBA3C | insertion | Nonsense_Mutation | novel | c.1289_1290insCCACTAAAGACAGGTCATGCCCCAGAA | p.Glu429_Lys430insAsnHisTerArgGlnValMetProGln | p.E429_K430insNH*RQVMPQ | Q13748 | protein_coding | TCGA-BH-A0DZ-01 | Breast | breast invasive carcinoma | Female | <65 | I/II | Chemotherapy | docetaxel | SD | ||
| TUBA3C | SNV | Missense_Mutation | novel | c.185T>C | p.Val62Ala | p.V62A | Q13748 | protein_coding | deleterious_low_confidence(0) | benign(0.394) | TCGA-2W-A8YY-01 | Cervix | cervical & endocervical cancer | Female | <65 | I/II | Chemotherapy | cisplatin | CR |
| TUBA3C | SNV | Missense_Mutation | c.550N>A | p.Pro184Thr | p.P184T | Q13748 | protein_coding | deleterious_low_confidence(0) | probably_damaging(1) | TCGA-C5-A1BN-01 | Cervix | cervical & endocervical cancer | Female | <65 | I/II | Chemotherapy | cisplatin | PD | |
| TUBA3C | SNV | Missense_Mutation | c.147N>G | p.Phe49Leu | p.F49L | Q13748 | protein_coding | tolerated_low_confidence(0.05) | benign(0.048) | TCGA-EK-A3GK-01 | Cervix | cervical & endocervical cancer | Female | <65 | I/II | Unknown | Unknown | SD |
| Page: 1 2 3 4 5 6 7 8 9 10 11 12 13 14 15 16 |
Top |
Related drugs of malignant transformation related genes |
| Identification of chemicals and drugs interact with genes involved in malignant transfromation |
| (DGIdb 4.0) |
| Entrez ID | Symbol | Category | Interaction Types | Drug Claim Name | Drug Name | PMIDs |
| 7278 | TUBA3C | DRUGGABLE GENOME | VINCRISTINE | VINCRISTINE | 16539377,21664138,23916255 | |
| 7278 | TUBA3C | DRUGGABLE GENOME | CURCUMIN | CURCUMIN | 23830698 | |
| 7278 | TUBA3C | DRUGGABLE GENOME | PACLITAXEL | PACLITAXEL | 23631389,25369367,25768699,24457094,22595423,23313639,17887662,23387901,19758808,23725535,24953821 | |
| 7278 | TUBA3C | DRUGGABLE GENOME | LARGAZOLE | LARGAZOLE | 20491440 | |
| 7278 | TUBA3C | DRUGGABLE GENOME | ABT-751 | ABT-751 | 25468039 | |
| 7278 | TUBA3C | DRUGGABLE GENOME | VINBLASTINE | VINBLASTINE | 23708010,23916255 | |
| 7278 | TUBA3C | DRUGGABLE GENOME | COMBRETASTATIN A4 | COMBRETASTATIN A4 | 23631389,16913727,22543234,25584687,24669888,17765552,25192811 | |
| 7278 | TUBA3C | DRUGGABLE GENOME | 10,11-DIHYDROEPOTHILONE D | CHEMBL453818 | 12141877 | |
| 7278 | TUBA3C | DRUGGABLE GENOME | ZAMPANOLIDE | ZAMPANOLIDE | 19877653 | |
| 7278 | TUBA3C | DRUGGABLE GENOME | NSC-751382 | CHEMBL1935538 | 22435708 |
| Page: 1 2 3 |

Copyright 2023-Present -The University of Texas Health Science Center at Houston |