
|
|||||
|
 | |
| |
| |
| |
| |
| |
|
Gene: TUBA1A |
Gene summary for TUBA1A |
| Gene information | Species | Human | Gene symbol | TUBA1A | Gene ID | 7846 |
| Gene name | tubulin alpha 1a | |
| Gene Alias | B-ALPHA-1 | |
| Cytomap | 12q13.12 | |
| Gene Type | protein-coding | GO ID | GO:0000226 | UniProtAcc | Q71U36 |
Top |
Malignant transformation analysis |
| Identification of the aberrant gene expression in precancerous and cancerous lesions by comparing the gene expression of stem-like cells in diseased tissues with normal stem cells |
| Entrez ID | Symbol | Replicates | Species | Organ | Tissue | Adj P-value | Log2FC | Malignancy |
| 7846 | TUBA1A | GSM4909282 | Human | Breast | IDC | 4.47e-18 | -5.07e-01 | -0.0288 |
| 7846 | TUBA1A | GSM4909285 | Human | Breast | IDC | 4.99e-08 | 4.59e-01 | 0.21 |
| 7846 | TUBA1A | GSM4909290 | Human | Breast | IDC | 1.74e-17 | -5.96e-01 | 0.2096 |
| 7846 | TUBA1A | GSM4909291 | Human | Breast | IDC | 6.99e-15 | -6.03e-01 | 0.1753 |
| 7846 | TUBA1A | GSM4909293 | Human | Breast | IDC | 9.41e-08 | -3.18e-01 | 0.1581 |
| 7846 | TUBA1A | GSM4909294 | Human | Breast | IDC | 5.80e-06 | -2.33e-01 | 0.2022 |
| 7846 | TUBA1A | GSM4909296 | Human | Breast | IDC | 1.97e-16 | -3.79e-01 | 0.1524 |
| 7846 | TUBA1A | GSM4909297 | Human | Breast | IDC | 8.34e-24 | 4.15e-01 | 0.1517 |
| 7846 | TUBA1A | GSM4909299 | Human | Breast | IDC | 6.77e-11 | 5.26e-01 | 0.035 |
| 7846 | TUBA1A | GSM4909300 | Human | Breast | IDC | 4.64e-02 | 4.11e-01 | 0.0334 |
| 7846 | TUBA1A | GSM4909305 | Human | Breast | IDC | 6.63e-04 | 4.05e-01 | 0.0436 |
| 7846 | TUBA1A | GSM4909309 | Human | Breast | IDC | 6.78e-05 | 2.84e-01 | 0.0483 |
| 7846 | TUBA1A | GSM4909311 | Human | Breast | IDC | 1.85e-27 | -3.02e-01 | 0.1534 |
| 7846 | TUBA1A | GSM4909312 | Human | Breast | IDC | 1.16e-08 | -1.01e-01 | 0.1552 |
| 7846 | TUBA1A | GSM4909315 | Human | Breast | IDC | 4.89e-07 | 3.85e-01 | 0.21 |
| 7846 | TUBA1A | GSM4909317 | Human | Breast | IDC | 2.59e-10 | 5.08e-01 | 0.1355 |
| 7846 | TUBA1A | GSM4909319 | Human | Breast | IDC | 8.35e-33 | -3.72e-01 | 0.1563 |
| 7846 | TUBA1A | GSM4909320 | Human | Breast | IDC | 3.06e-03 | -2.72e-01 | 0.1575 |
| 7846 | TUBA1A | GSM4909321 | Human | Breast | IDC | 3.83e-15 | -1.08e-02 | 0.1559 |
| 7846 | TUBA1A | ctrl6 | Human | Breast | Precancer | 2.08e-07 | 5.81e-01 | -0.0061 |
| Page: 1 2 3 4 5 6 7 8 |
| Tissue | Expression Dynamics | Abbreviation |
| Breast | 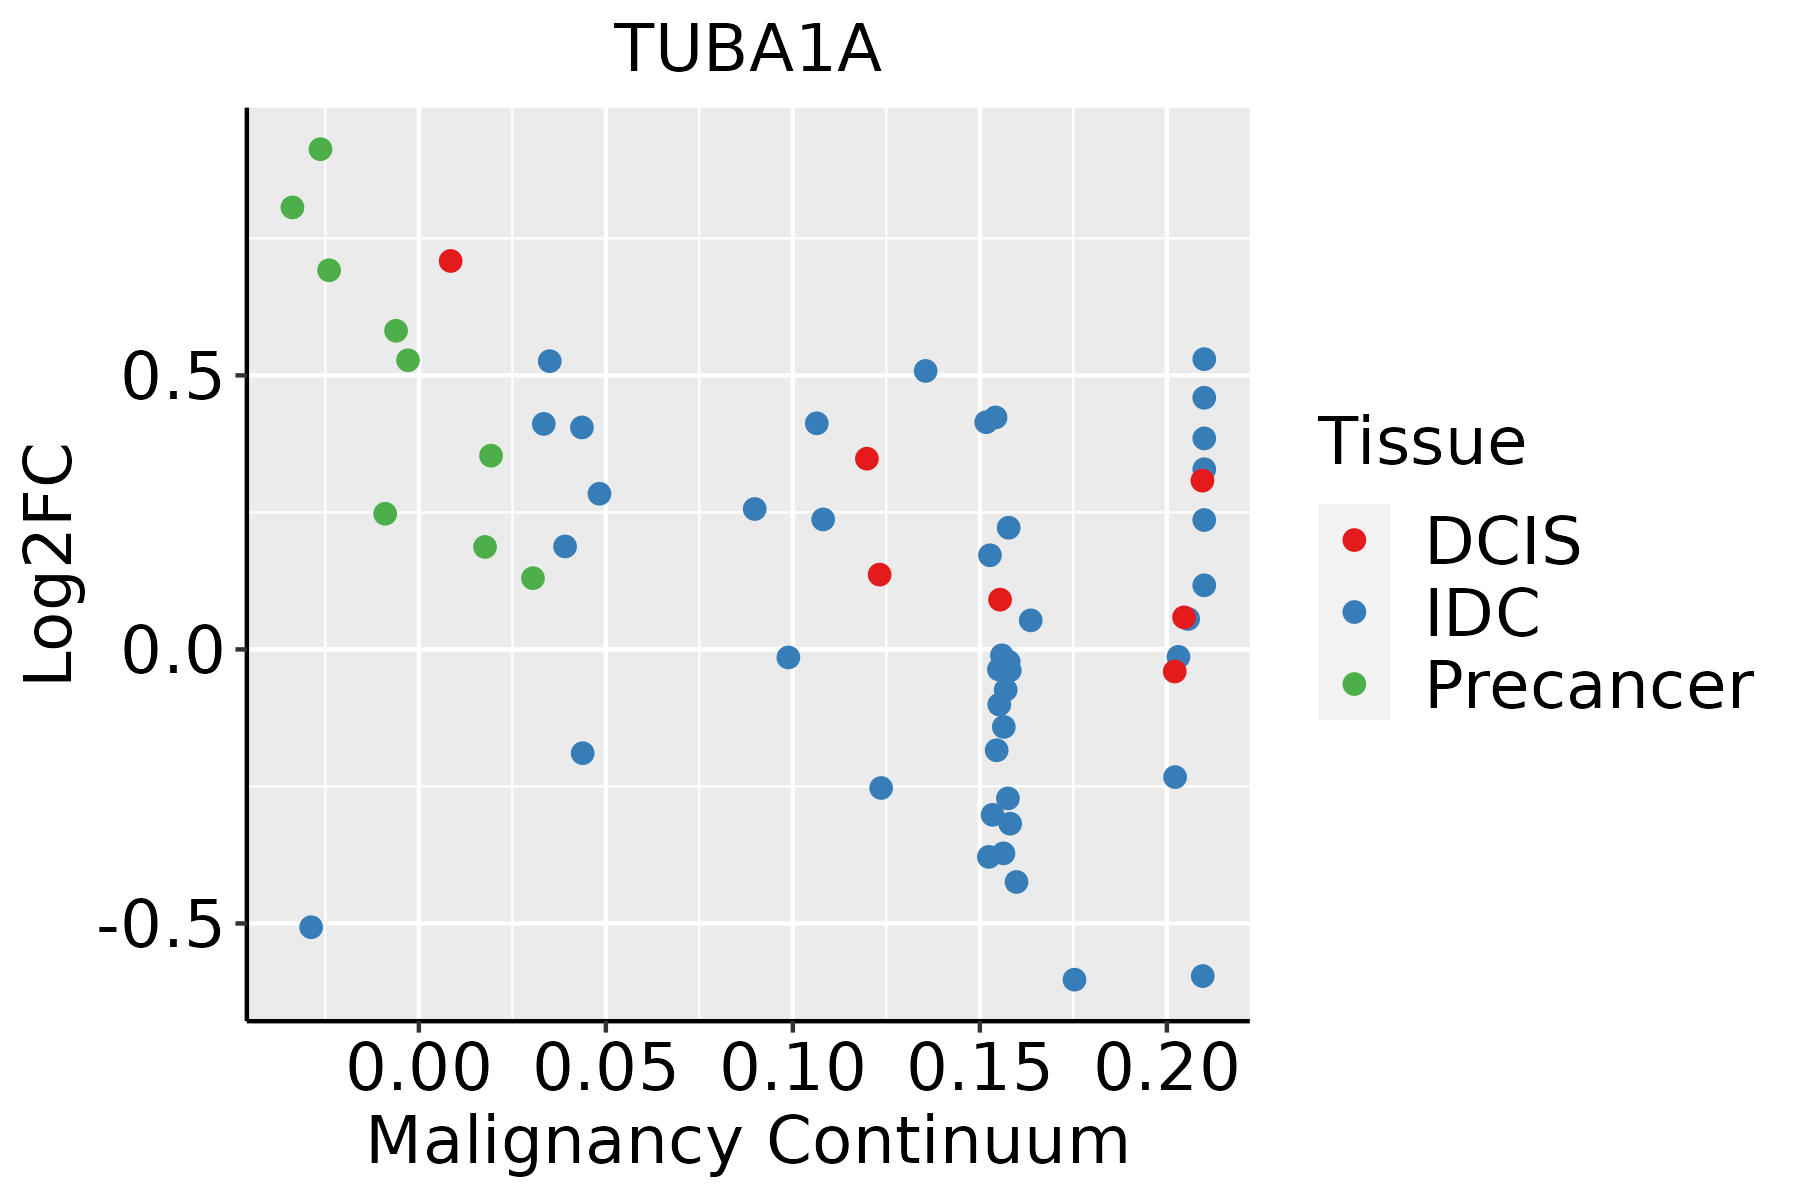 | IDC: Invasive ductal carcinoma |
| DCIS: Ductal carcinoma in situ | ||
| Precancer(BRCA1-mut): Precancerous lesion from BRCA1 mutation carriers | ||
| Cervix | 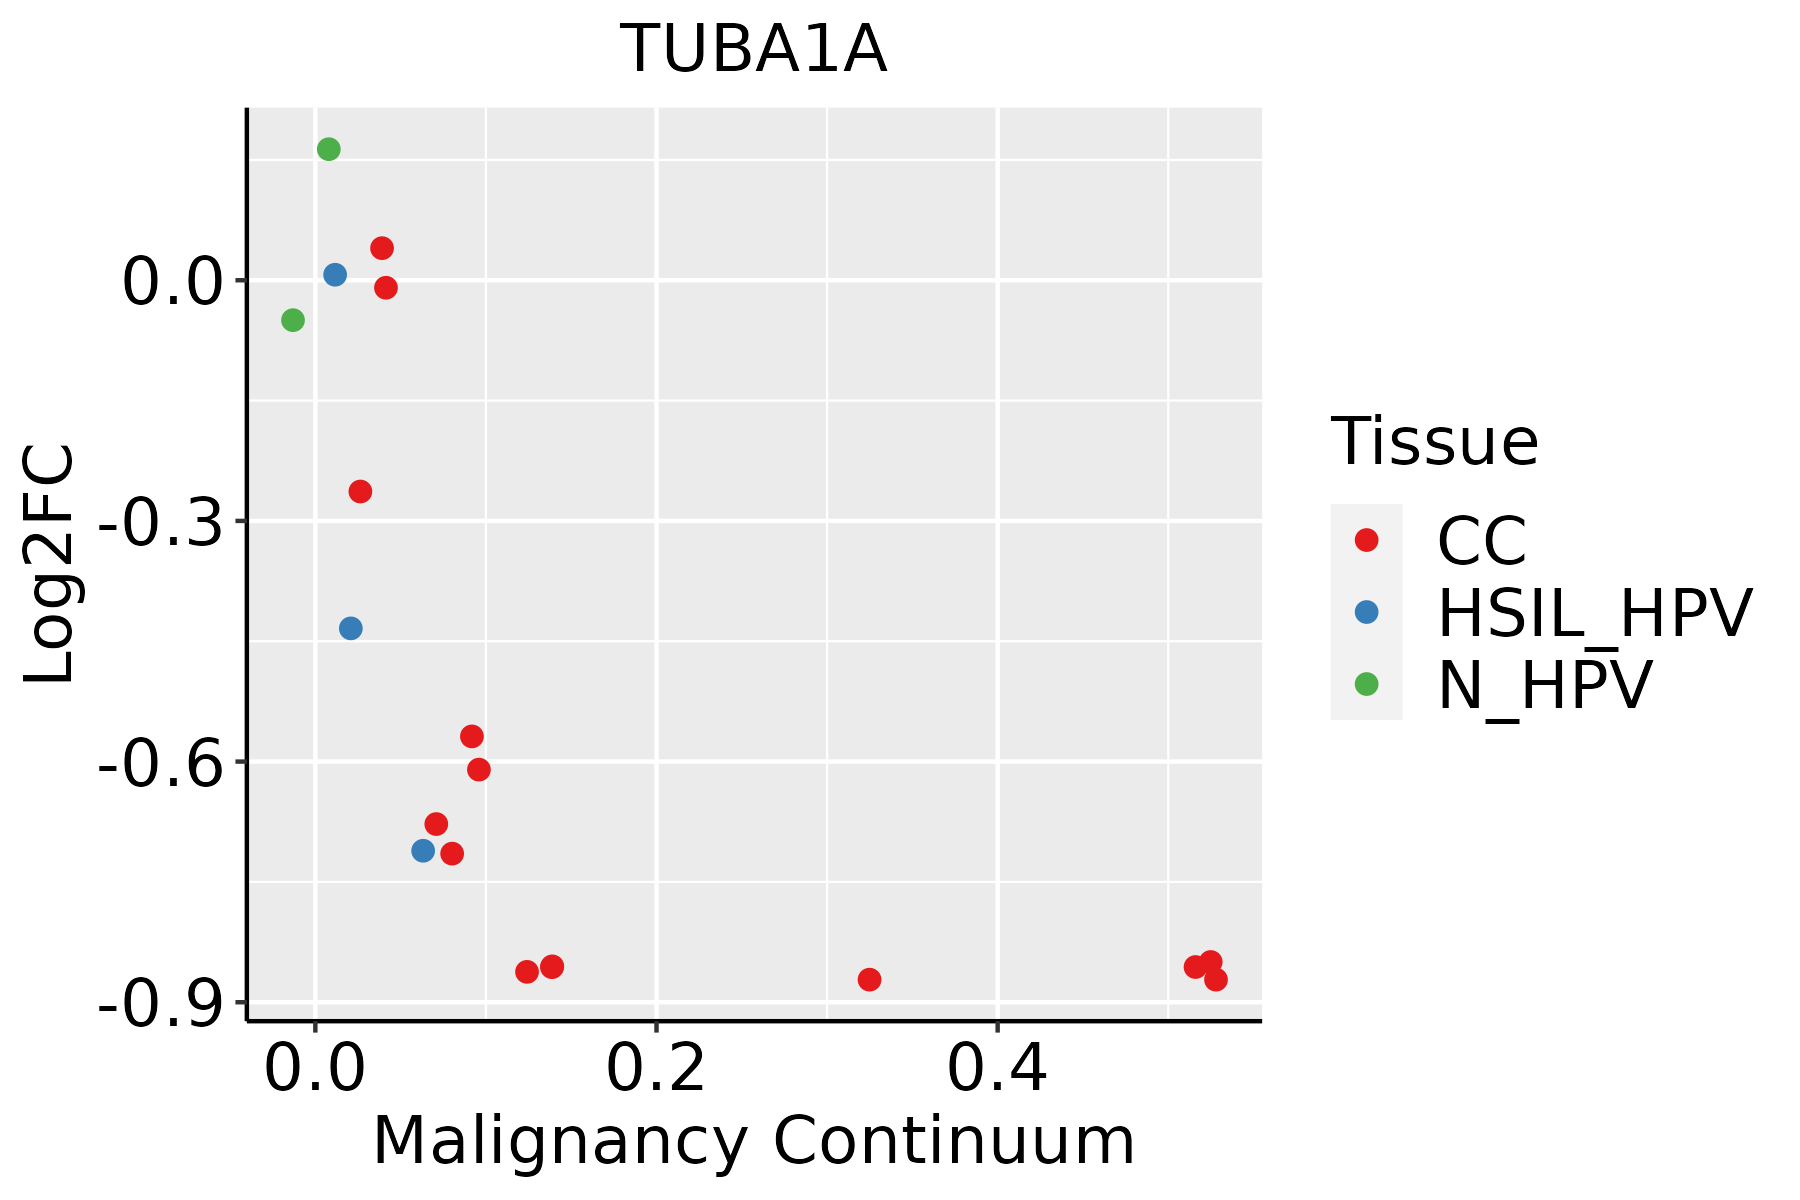 | CC: Cervix cancer |
| HSIL_HPV: HPV-infected high-grade squamous intraepithelial lesions | ||
| N_HPV: HPV-infected normal cervix | ||
| Endometrium | 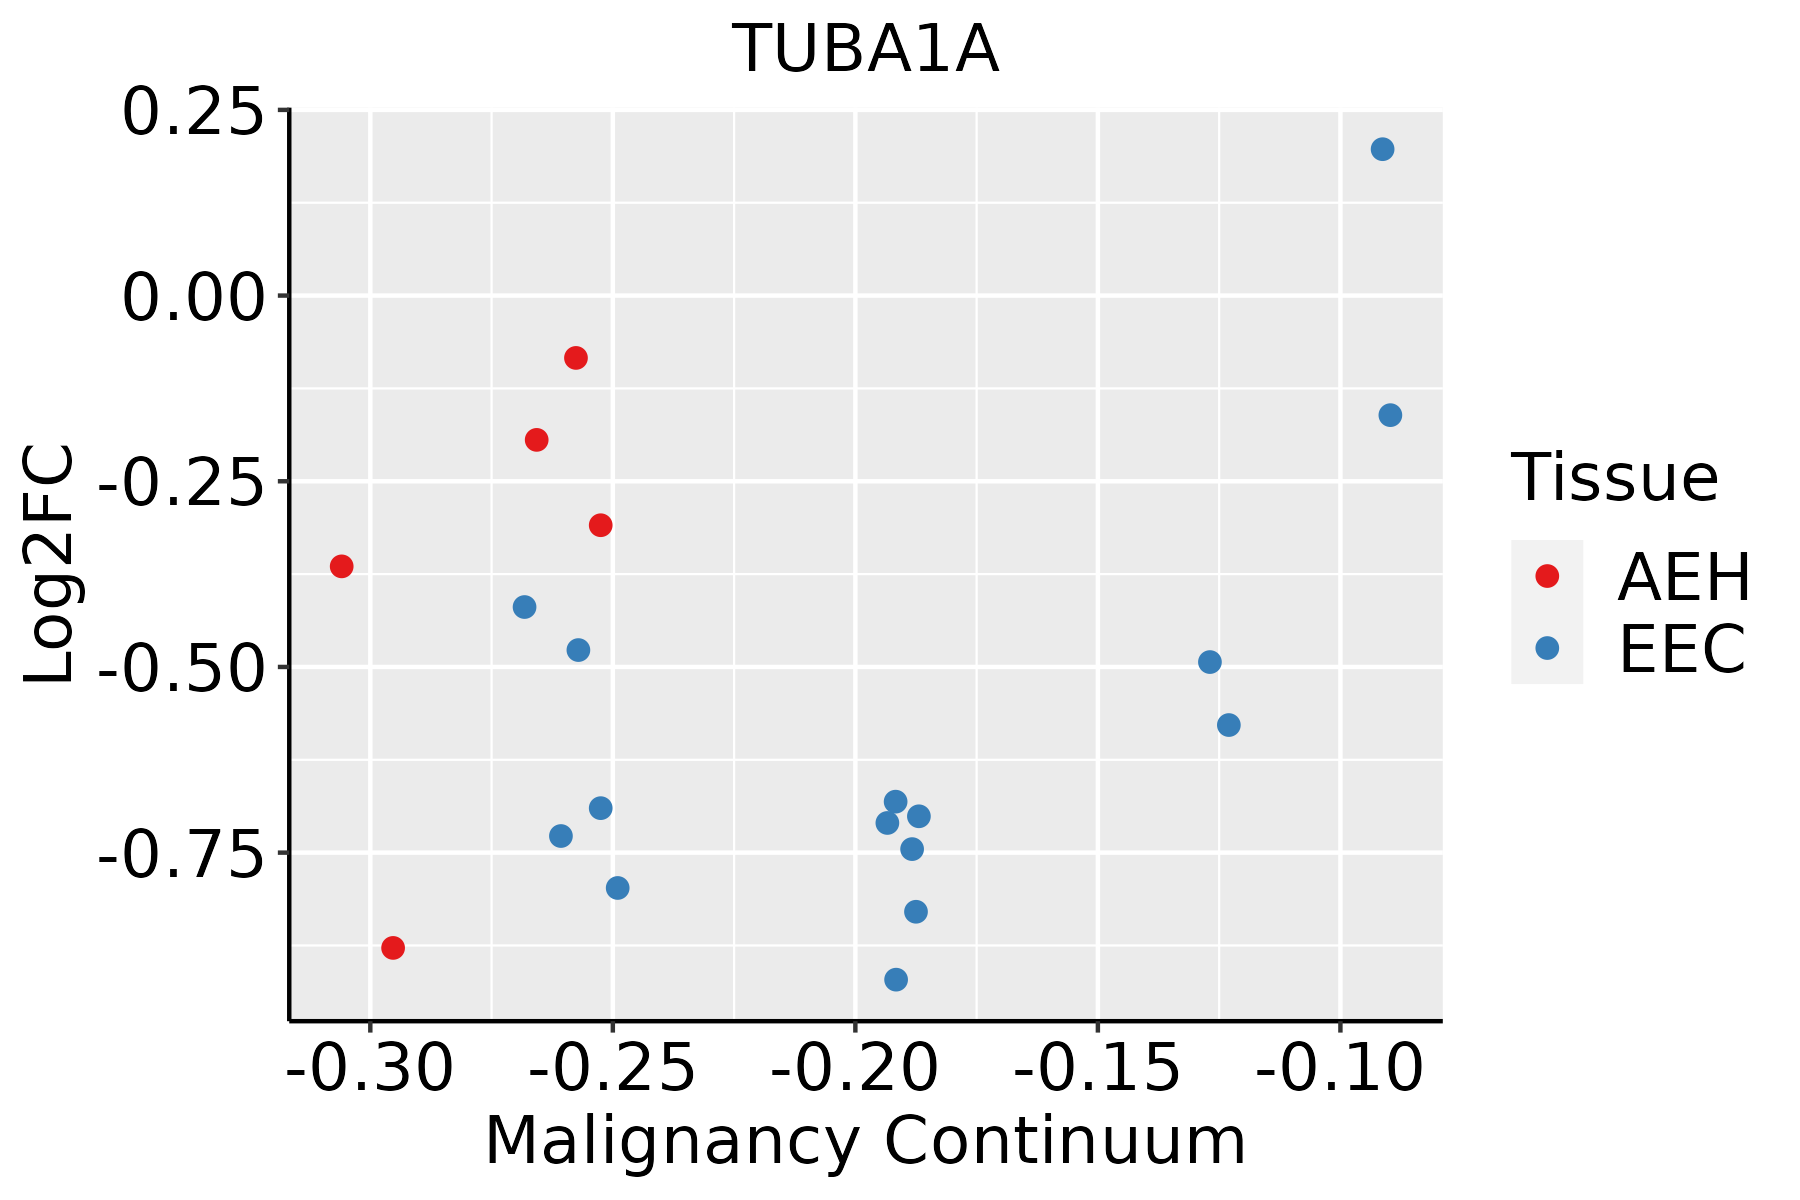 | AEH: Atypical endometrial hyperplasia |
| EEC: Endometrioid Cancer | ||
| Esophagus |  | ESCC: Esophageal squamous cell carcinoma |
| HGIN: High-grade intraepithelial neoplasias | ||
| LGIN: Low-grade intraepithelial neoplasias | ||
| Oral Cavity |  | EOLP: Erosive Oral lichen planus |
| LP: leukoplakia | ||
| NEOLP: Non-erosive oral lichen planus | ||
| OSCC: Oral squamous cell carcinoma | ||
| Prostate |  | BPH: Benign Prostatic Hyperplasia |
| Skin | 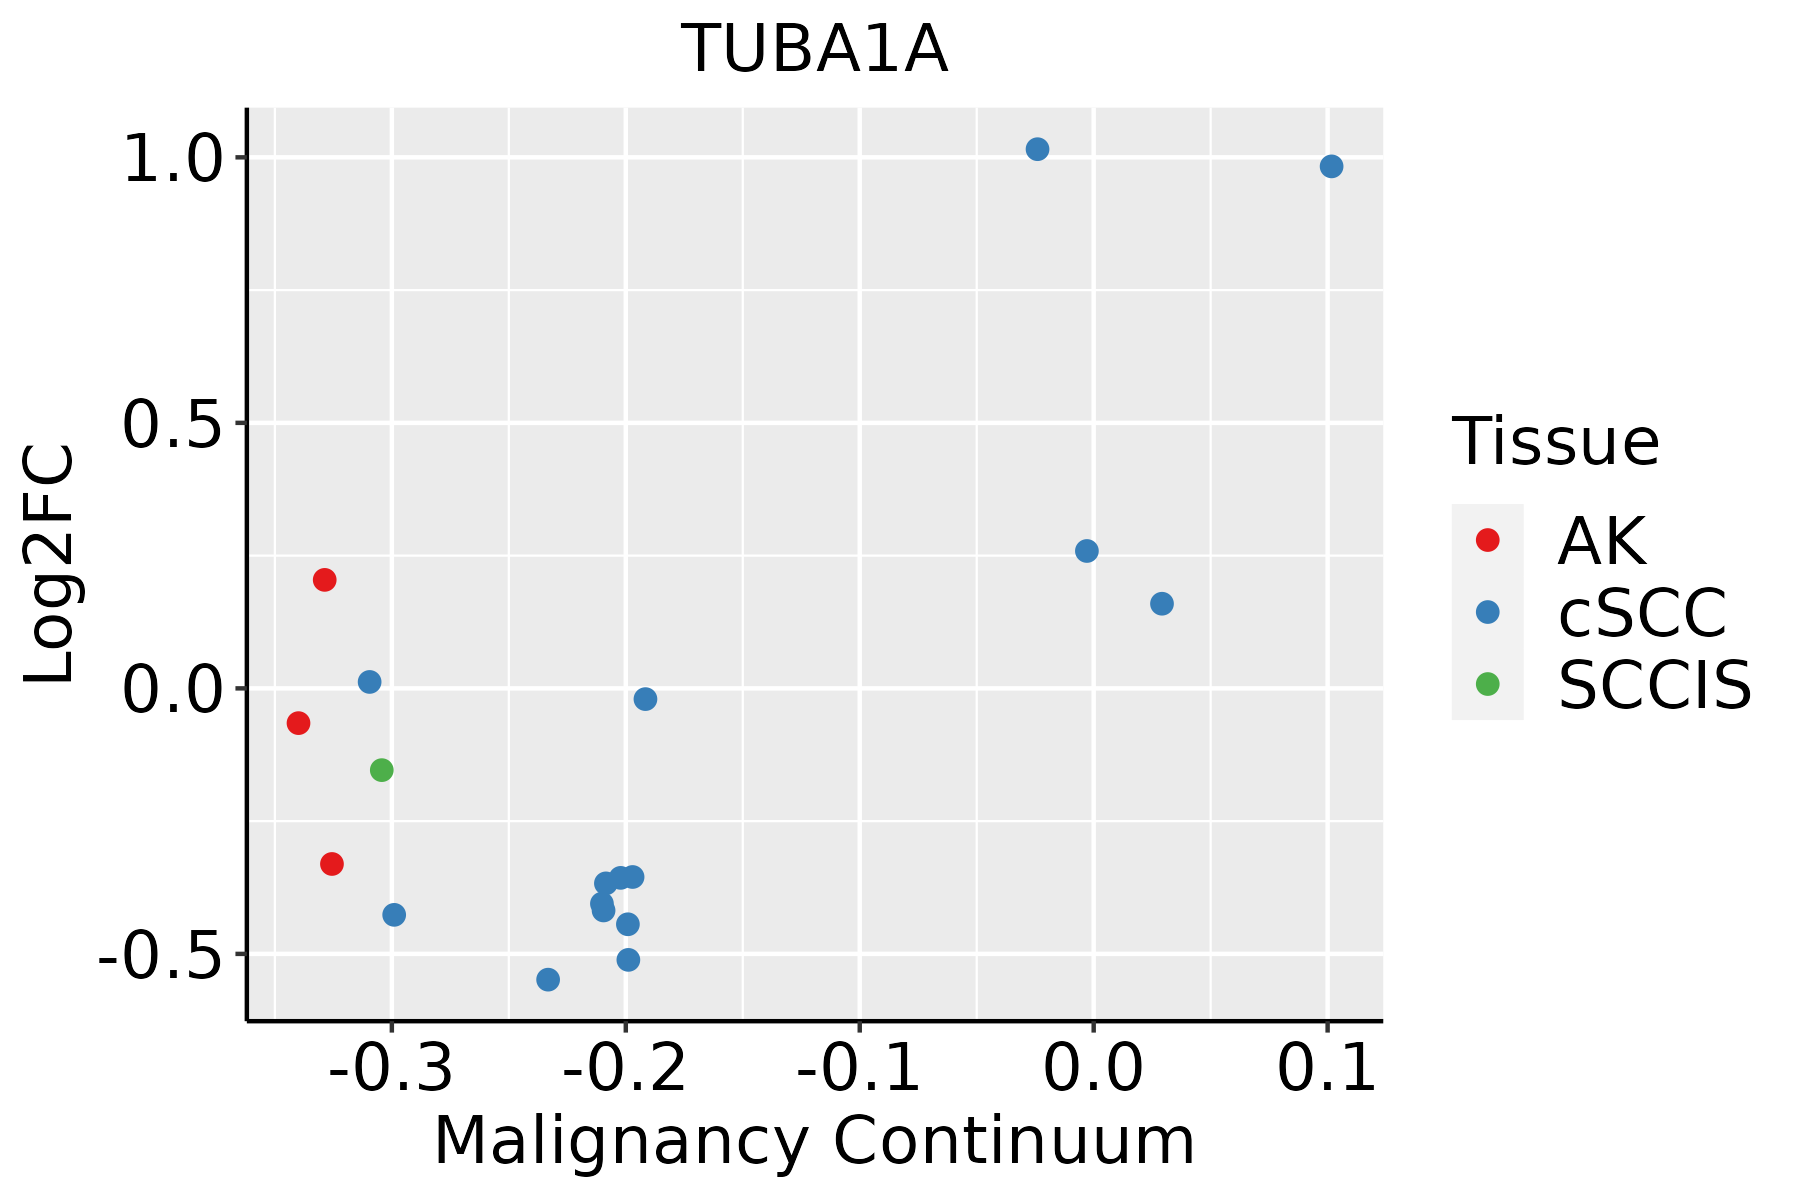 | AK: Actinic keratosis |
| cSCC: Cutaneous squamous cell carcinoma | ||
| SCCIS:squamous cell carcinoma in situ | ||
| Thyroid |  | ATC: Anaplastic thyroid cancer |
| HT: Hashimoto's thyroiditis | ||
| PTC: Papillary thyroid cancer |
| ∗log2FC in expression of this searched gene in stem-like cells from each diseased tissue sample relative to stem-like cells in normal samples in each tissue plotted against the malignancy continuum. Samples are colored based on if they are from different disease stage. |
Top |
Malignant transformation related pathway analysis |
| Find out the enriched GO biological processes and KEGG pathways involved in transition from healthy to precancer to cancer |
| Tissue | Disease Stage | Enriched GO biological Processes |
| Colorectum | AD |  |
| Colorectum | SER |  |
| Colorectum | MSS |  |
| Colorectum | MSI-H |  |
| Colorectum | FAP |  |
| ∗Top 15 enriched GO BP terms are showed in the bar plot of each disease state in each tissue. Each row represents a significant GO biological process which is colored according to the -log10(p.adjust). |
| Page: 1 2 3 4 5 6 7 8 9 |
| GO ID | Tissue | Disease Stage | Description | Gene Ratio | Bg Ratio | pvalue | p.adjust | Count |
| GO:00307057 | Cervix | CC | cytoskeleton-dependent intracellular transport | 40/2311 | 195/18723 | 7.92e-04 | 6.99e-03 | 40 |
| GO:003070513 | Cervix | N_HPV | cytoskeleton-dependent intracellular transport | 13/534 | 195/18723 | 4.03e-03 | 3.16e-02 | 13 |
| GO:00307058 | Endometrium | AEH | cytoskeleton-dependent intracellular transport | 38/2100 | 195/18723 | 4.72e-04 | 4.91e-03 | 38 |
| GO:00508086 | Endometrium | AEH | synapse organization | 67/2100 | 426/18723 | 2.67e-03 | 1.94e-02 | 67 |
| GO:003070514 | Endometrium | EEC | cytoskeleton-dependent intracellular transport | 39/2168 | 195/18723 | 4.40e-04 | 4.58e-03 | 39 |
| GO:005080812 | Endometrium | EEC | synapse organization | 68/2168 | 426/18723 | 3.73e-03 | 2.49e-02 | 68 |
| GO:003070518 | Esophagus | ESCC | cytoskeleton-dependent intracellular transport | 133/8552 | 195/18723 | 1.48e-10 | 4.27e-09 | 133 |
| GO:003070510 | Oral cavity | OSCC | cytoskeleton-dependent intracellular transport | 113/7305 | 195/18723 | 6.03e-08 | 1.09e-06 | 113 |
| GO:003070516 | Oral cavity | LP | cytoskeleton-dependent intracellular transport | 68/4623 | 195/18723 | 8.92e-04 | 7.64e-03 | 68 |
| GO:003070523 | Oral cavity | EOLP | cytoskeleton-dependent intracellular transport | 42/2218 | 195/18723 | 8.11e-05 | 9.69e-04 | 42 |
| GO:003070531 | Oral cavity | NEOLP | cytoskeleton-dependent intracellular transport | 46/2005 | 195/18723 | 1.81e-07 | 6.18e-06 | 46 |
| GO:00307059 | Prostate | BPH | cytoskeleton-dependent intracellular transport | 68/3107 | 195/18723 | 3.78e-10 | 1.98e-08 | 68 |
| GO:00508087 | Prostate | BPH | synapse organization | 103/3107 | 426/18723 | 3.19e-05 | 3.61e-04 | 103 |
| GO:00508072 | Prostate | BPH | regulation of synapse organization | 48/3107 | 211/18723 | 1.23e-02 | 4.94e-02 | 48 |
| GO:003070515 | Prostate | Tumor | cytoskeleton-dependent intracellular transport | 67/3246 | 195/18723 | 6.56e-09 | 2.53e-07 | 67 |
| GO:005080813 | Prostate | Tumor | synapse organization | 105/3246 | 426/18723 | 7.20e-05 | 7.62e-04 | 105 |
| GO:005080711 | Prostate | Tumor | regulation of synapse organization | 50/3246 | 211/18723 | 1.11e-02 | 4.56e-02 | 50 |
| GO:003070524 | Skin | cSCC | cytoskeleton-dependent intracellular transport | 77/4864 | 195/18723 | 2.32e-05 | 2.67e-04 | 77 |
| GO:0030705111 | Thyroid | PTC | cytoskeleton-dependent intracellular transport | 104/5968 | 195/18723 | 3.87e-10 | 1.24e-08 | 104 |
| GO:00508089 | Thyroid | PTC | synapse organization | 161/5968 | 426/18723 | 5.11e-03 | 2.36e-02 | 161 |
| Page: 1 2 |
| Pathway ID | Tissue | Disease Stage | Description | Gene Ratio | Bg Ratio | pvalue | p.adjust | qvalue | Count |
| hsa0501218 | Breast | Precancer | Parkinson disease | 99/684 | 266/8465 | 3.58e-42 | 5.65e-40 | 4.33e-40 | 99 |
| hsa0502016 | Breast | Precancer | Prion disease | 95/684 | 273/8465 | 1.39e-37 | 1.46e-35 | 1.12e-35 | 95 |
| hsa0501616 | Breast | Precancer | Huntington disease | 98/684 | 306/8465 | 2.85e-35 | 2.25e-33 | 1.72e-33 | 98 |
| hsa0501016 | Breast | Precancer | Alzheimer disease | 103/684 | 384/8465 | 1.03e-29 | 4.66e-28 | 3.57e-28 | 103 |
| hsa0501416 | Breast | Precancer | Amyotrophic lateral sclerosis | 98/684 | 364/8465 | 2.13e-28 | 8.41e-27 | 6.44e-27 | 98 |
| hsa0502216 | Breast | Precancer | Pathways of neurodegeneration - multiple diseases | 112/684 | 476/8465 | 6.96e-27 | 2.44e-25 | 1.87e-25 | 112 |
| hsa0513218 | Breast | Precancer | Salmonella infection | 49/684 | 249/8465 | 2.92e-09 | 6.15e-08 | 4.71e-08 | 49 |
| hsa0513018 | Breast | Precancer | Pathogenic Escherichia coli infection | 38/684 | 197/8465 | 3.12e-07 | 5.81e-06 | 4.45e-06 | 38 |
| hsa0453018 | Breast | Precancer | Tight junction | 31/684 | 169/8465 | 1.13e-05 | 1.26e-04 | 9.64e-05 | 31 |
| hsa0414518 | Breast | Precancer | Phagosome | 27/684 | 152/8465 | 7.37e-05 | 6.85e-04 | 5.25e-04 | 27 |
| hsa042108 | Breast | Precancer | Apoptosis | 25/684 | 136/8465 | 7.61e-05 | 6.87e-04 | 5.26e-04 | 25 |
| hsa0501219 | Breast | Precancer | Parkinson disease | 99/684 | 266/8465 | 3.58e-42 | 5.65e-40 | 4.33e-40 | 99 |
| hsa0502017 | Breast | Precancer | Prion disease | 95/684 | 273/8465 | 1.39e-37 | 1.46e-35 | 1.12e-35 | 95 |
| hsa0501617 | Breast | Precancer | Huntington disease | 98/684 | 306/8465 | 2.85e-35 | 2.25e-33 | 1.72e-33 | 98 |
| hsa0501017 | Breast | Precancer | Alzheimer disease | 103/684 | 384/8465 | 1.03e-29 | 4.66e-28 | 3.57e-28 | 103 |
| hsa0501417 | Breast | Precancer | Amyotrophic lateral sclerosis | 98/684 | 364/8465 | 2.13e-28 | 8.41e-27 | 6.44e-27 | 98 |
| hsa0502217 | Breast | Precancer | Pathways of neurodegeneration - multiple diseases | 112/684 | 476/8465 | 6.96e-27 | 2.44e-25 | 1.87e-25 | 112 |
| hsa0513219 | Breast | Precancer | Salmonella infection | 49/684 | 249/8465 | 2.92e-09 | 6.15e-08 | 4.71e-08 | 49 |
| hsa0513019 | Breast | Precancer | Pathogenic Escherichia coli infection | 38/684 | 197/8465 | 3.12e-07 | 5.81e-06 | 4.45e-06 | 38 |
| hsa0453019 | Breast | Precancer | Tight junction | 31/684 | 169/8465 | 1.13e-05 | 1.26e-04 | 9.64e-05 | 31 |
| Page: 1 2 3 4 5 6 7 8 9 10 11 12 13 14 15 16 |
Top |
Cell-cell communication analysis |
| Identification of potential cell-cell interactions between two cell types and their ligand-receptor pairs for different disease states |
| Ligand | Receptor | LRpair | Pathway | Tissue | Disease Stage |
| Page: 1 |
Top |
Single-cell gene regulatory network inference analysis |
| Find out the significant the regulons (TFs) and the target genes of each regulon across cell types for different disease states |
| TF | Cell Type | Tissue | Disease Stage | Target Gene | RSS | Regulon Activity |
| ∗The dot plots of a searched regulon are shown for all cell subpopulations in each disease state of each tissue based on the regulon specific score inferred using pySCENIC and by calculating the average expression. |
| Page: 1 |
Top |
Somatic mutation of malignant transformation related genes |
| Annotation of somatic variants for genes involved in malignant transformation |
| Hugo Symbol | Variant Class | Variant Classification | dbSNP RS | HGVSc | HGVSp | HGVSp Short | SWISSPROT | BIOTYPE | SIFT | PolyPhen | Tumor Sample Barcode | Tissue | Histology | Sex | Age | Stage | Therapy Types | Drugs | Outcome |
| TUBA1A | SNV | Missense_Mutation | c.156N>G | p.Phe52Leu | p.F52L | Q71U36 | protein_coding | deleterious_low_confidence(0.01) | benign(0.337) | TCGA-AC-A23H-01 | Breast | breast invasive carcinoma | Female | >=65 | I/II | Unknown | Unknown | PD | |
| TUBA1A | SNV | Missense_Mutation | novel | c.547N>C | p.Glu183Gln | p.E183Q | Q71U36 | protein_coding | deleterious_low_confidence(0) | probably_damaging(1) | TCGA-B6-A3ZX-01 | Breast | breast invasive carcinoma | Female | <65 | III/IV | Chemotherapy | cyclophosphamide | PD |
| TUBA1A | SNV | Missense_Mutation | c.167N>T | p.Thr56Met | p.T56M | Q71U36 | protein_coding | deleterious_low_confidence(0.02) | benign(0.305) | TCGA-E2-A1LS-01 | Breast | breast invasive carcinoma | Female | <65 | I/II | Unspecific | Cyclophosphamide | SD | |
| TUBA1A | insertion | Nonsense_Mutation | novel | c.138_139insATTTGATGTCATTTTGTAAATGTTAATGAGAATTTTTTAAAA | p.Asp46_Asp47insIleTerCysHisPheValAsnValAsnGluAsnPheLeuLys | p.D46_D47insI*CHFVNVNENFLK | Q71U36 | protein_coding | TCGA-AN-A0FN-01 | Breast | breast invasive carcinoma | Female | <65 | I/II | Unknown | Unknown | SD | ||
| TUBA1A | SNV | Missense_Mutation | c.251N>A | p.Arg84His | p.R84H | Q71U36 | protein_coding | deleterious_low_confidence(0.02) | benign(0.009) | TCGA-2W-A8YY-01 | Cervix | cervical & endocervical cancer | Female | <65 | I/II | Chemotherapy | cisplatin | CR | |
| TUBA1A | SNV | Missense_Mutation | rs1065730 | c.1339N>A | p.Glu447Lys | p.E447K | Q71U36 | protein_coding | deleterious_low_confidence(0.03) | benign(0.292) | TCGA-Q1-A73O-01 | Cervix | cervical & endocervical cancer | Female | <65 | I/II | Chemotherapy | cisplatin | CR |
| TUBA1A | SNV | Missense_Mutation | novel | c.826A>G | p.Ile276Val | p.I276V | Q71U36 | protein_coding | tolerated_low_confidence(0.2) | benign(0.015) | TCGA-A6-3809-01 | Colorectum | colon adenocarcinoma | Female | >=65 | I/II | Unknown | Unknown | SD |
| TUBA1A | SNV | Missense_Mutation | rs886039513 | c.367N>T | p.Arg123Cys | p.R123C | Q71U36 | protein_coding | deleterious_low_confidence(0) | probably_damaging(0.915) | TCGA-AU-6004-01 | Colorectum | colon adenocarcinoma | Female | >=65 | I/II | Unknown | Unknown | SD |
| TUBA1A | SNV | Missense_Mutation | novel | c.565N>A | p.Leu189Ile | p.L189I | Q71U36 | protein_coding | deleterious_low_confidence(0.01) | probably_damaging(0.922) | TCGA-CA-6717-01 | Colorectum | colon adenocarcinoma | Male | <65 | I/II | Chemotherapy | oxaliplatin | CR |
| TUBA1A | SNV | Missense_Mutation | c.959N>A | p.Arg320His | p.R320H | Q71U36 | protein_coding | deleterious_low_confidence(0.03) | possibly_damaging(0.454) | TCGA-G4-6304-01 | Colorectum | colon adenocarcinoma | Female | >=65 | I/II | Chemotherapy | fluorouracil | PD |
| Page: 1 2 3 4 5 |
Top |
Related drugs of malignant transformation related genes |
| Identification of chemicals and drugs interact with genes involved in malignant transfromation |
| (DGIdb 4.0) |
| Entrez ID | Symbol | Category | Interaction Types | Drug Claim Name | Drug Name | PMIDs |
| 7846 | TUBA1A | DRUGGABLE GENOME | MEBENDAZOLE | MEBENDAZOLE | ||
| 7846 | TUBA1A | DRUGGABLE GENOME | CHEMBL2108628 | PACLITAXEL POLIGLUMEX | ||
| 7846 | TUBA1A | DRUGGABLE GENOME | CHEMBL492399 | VERUBULIN | ||
| 7846 | TUBA1A | DRUGGABLE GENOME | inhibitor | CHEMBL378544 | VINBLASTINE SULFATE | |
| 7846 | TUBA1A | DRUGGABLE GENOME | CURCUMIN | CURCUMIN | 23830698 | |
| 7846 | TUBA1A | DRUGGABLE GENOME | ZAMPANOLIDE | ZAMPANOLIDE | 19877653 | |
| 7846 | TUBA1A | DRUGGABLE GENOME | VINORELBINE BASE | VINORELBINE | 25768699 | |
| 7846 | TUBA1A | DRUGGABLE GENOME | NSC-753575 | CHEMBL2036119 | 22543234 | |
| 7846 | TUBA1A | DRUGGABLE GENOME | COMBRETASTATIN A4 | COMBRETASTATIN A4 | 23631389,16913727,22543234,25584687,24669888,17765552,25192811 | |
| 7846 | TUBA1A | DRUGGABLE GENOME | inhibitor | CHEMBL1743082 | TRASTUZUMAB EMTANSINE |
| Page: 1 2 3 4 5 |

Copyright 2023-Present -The University of Texas Health Science Center at Houston |