
|
|||||
|
 | |
| |
| |
| |
| |
| |
|
Gene: TTYH1 |
Gene summary for TTYH1 |
| Gene information | Species | Human | Gene symbol | TTYH1 | Gene ID | 57348 |
| Gene name | tweety family member 1 | |
| Gene Alias | TTYH1 | |
| Cytomap | 19q13.42 | |
| Gene Type | protein-coding | GO ID | GO:0000041 | UniProtAcc | Q9H313 |
Top |
Malignant transformation analysis |
| Identification of the aberrant gene expression in precancerous and cancerous lesions by comparing the gene expression of stem-like cells in diseased tissues with normal stem cells |
| Entrez ID | Symbol | Replicates | Species | Organ | Tissue | Adj P-value | Log2FC | Malignancy |
| 57348 | TTYH1 | GSM4909281 | Human | Breast | IDC | 2.68e-37 | 6.99e-01 | 0.21 |
| 57348 | TTYH1 | GSM4909282 | Human | Breast | IDC | 2.15e-05 | 2.59e-01 | -0.0288 |
| 57348 | TTYH1 | GSM4909285 | Human | Breast | IDC | 6.08e-85 | 1.15e+00 | 0.21 |
| 57348 | TTYH1 | GSM4909286 | Human | Breast | IDC | 1.44e-71 | 9.19e-01 | 0.1081 |
| 57348 | TTYH1 | GSM4909288 | Human | Breast | IDC | 3.30e-05 | 6.24e-01 | 0.0988 |
| 57348 | TTYH1 | GSM4909308 | Human | Breast | IDC | 2.82e-02 | -1.26e-01 | 0.158 |
| 57348 | TTYH1 | brca10 | Human | Breast | Precancer | 4.07e-02 | -1.26e-01 | -0.0029 |
| 57348 | TTYH1 | DCIS2 | Human | Breast | DCIS | 6.68e-19 | 8.01e-02 | 0.0085 |
| 57348 | TTYH1 | P11T-E | Human | Esophagus | ESCC | 3.07e-05 | 4.08e-01 | 0.1426 |
| 57348 | TTYH1 | P19T-E | Human | Esophagus | ESCC | 3.80e-02 | 4.56e-01 | 0.1662 |
| 57348 | TTYH1 | P76T-E | Human | Esophagus | ESCC | 2.00e-21 | 7.31e-01 | 0.1207 |
| 57348 | TTYH1 | P82T-E | Human | Esophagus | ESCC | 2.37e-04 | 4.30e-01 | 0.1072 |
| 57348 | TTYH1 | P126T-E | Human | Esophagus | ESCC | 4.48e-02 | 6.28e-01 | 0.1125 |
| Page: 1 |
| Tissue | Expression Dynamics | Abbreviation |
| Breast | 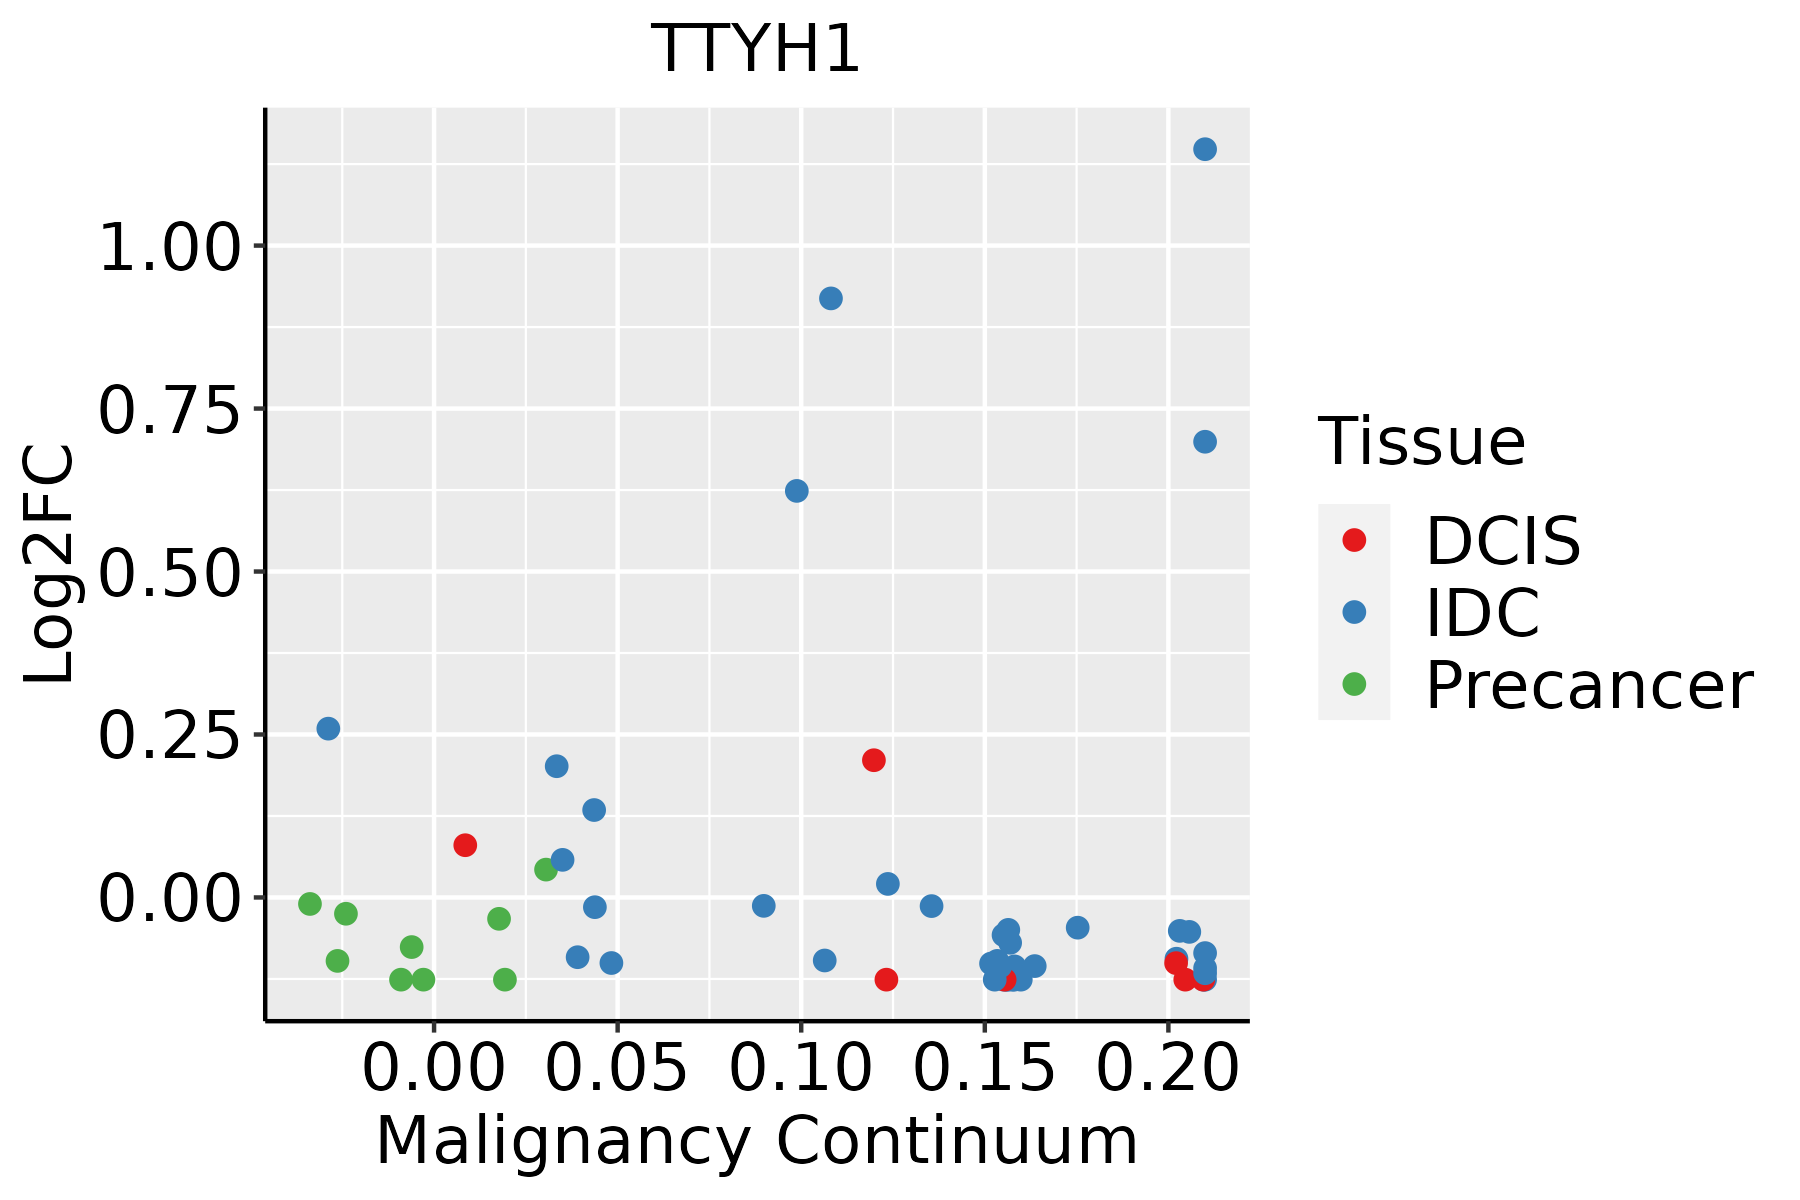 | IDC: Invasive ductal carcinoma |
| DCIS: Ductal carcinoma in situ | ||
| Precancer(BRCA1-mut): Precancerous lesion from BRCA1 mutation carriers | ||
| Esophagus | 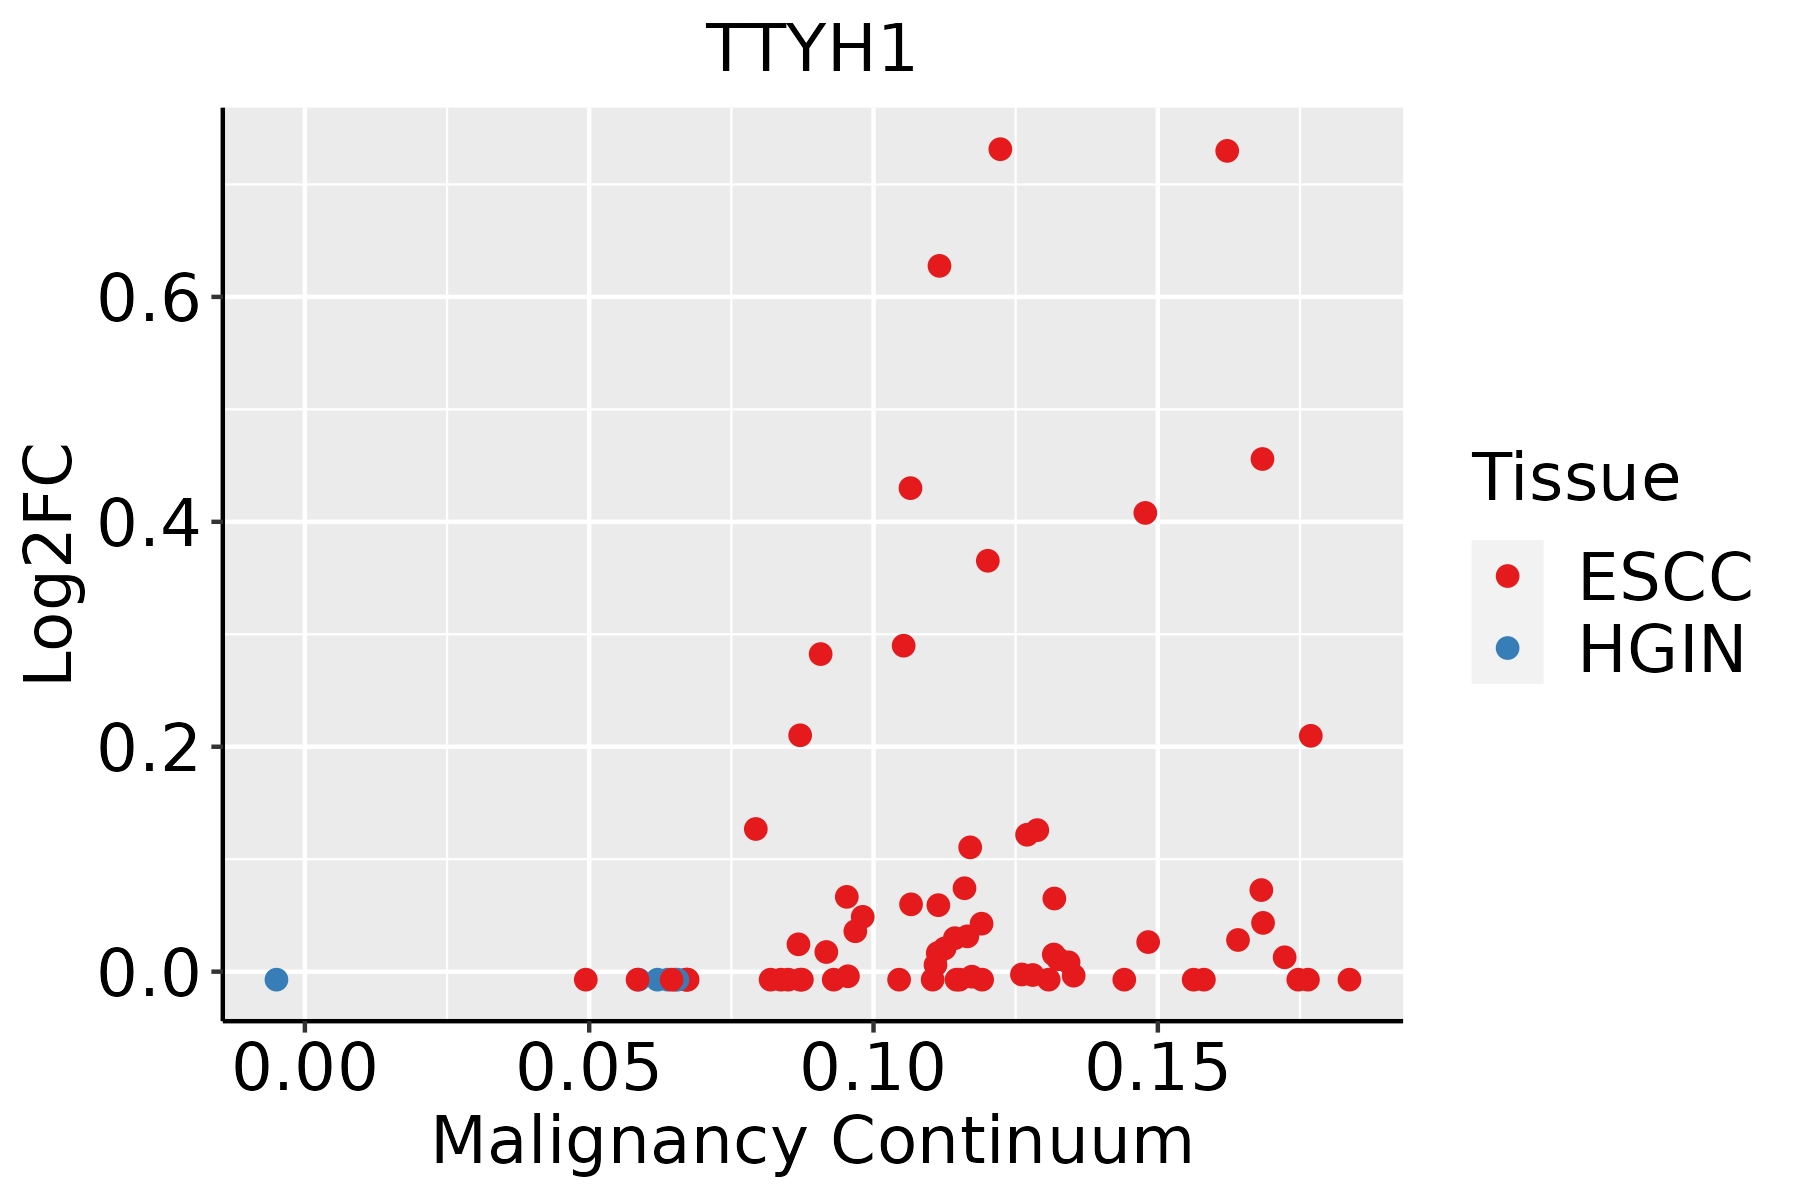 | ESCC: Esophageal squamous cell carcinoma |
| HGIN: High-grade intraepithelial neoplasias | ||
| LGIN: Low-grade intraepithelial neoplasias |
| ∗log2FC in expression of this searched gene in stem-like cells from each diseased tissue sample relative to stem-like cells in normal samples in each tissue plotted against the malignancy continuum. Samples are colored based on if they are from different disease stage. |
Top |
Malignant transformation related pathway analysis |
| Find out the enriched GO biological processes and KEGG pathways involved in transition from healthy to precancer to cancer |
| Tissue | Disease Stage | Enriched GO biological Processes |
| Colorectum | AD |  |
| Colorectum | SER |  |
| Colorectum | MSS |  |
| Colorectum | MSI-H |  |
| Colorectum | FAP |  |
| ∗Top 15 enriched GO BP terms are showed in the bar plot of each disease state in each tissue. Each row represents a significant GO biological process which is colored according to the -log10(p.adjust). |
| Page: 1 2 3 4 5 6 7 8 9 |
| GO ID | Tissue | Disease Stage | Description | Gene Ratio | Bg Ratio | pvalue | p.adjust | Count |
| GO:00068263 | Breast | Precancer | iron ion transport | 9/1080 | 58/18723 | 5.67e-03 | 4.08e-02 | 9 |
| GO:00000412 | Breast | Precancer | transition metal ion transport | 13/1080 | 105/18723 | 7.35e-03 | 4.89e-02 | 13 |
| GO:000682611 | Breast | IDC | iron ion transport | 11/1434 | 58/18723 | 4.10e-03 | 3.25e-02 | 11 |
| GO:000682621 | Breast | DCIS | iron ion transport | 11/1390 | 58/18723 | 3.23e-03 | 2.73e-02 | 11 |
| Page: 1 |
| Pathway ID | Tissue | Disease Stage | Description | Gene Ratio | Bg Ratio | pvalue | p.adjust | qvalue | Count |
| Page: 1 |
Top |
Cell-cell communication analysis |
| Identification of potential cell-cell interactions between two cell types and their ligand-receptor pairs for different disease states |
| Ligand | Receptor | LRpair | Pathway | Tissue | Disease Stage |
| Page: 1 |
Top |
Single-cell gene regulatory network inference analysis |
| Find out the significant the regulons (TFs) and the target genes of each regulon across cell types for different disease states |
| TF | Cell Type | Tissue | Disease Stage | Target Gene | RSS | Regulon Activity |
| ∗The dot plots of a searched regulon are shown for all cell subpopulations in each disease state of each tissue based on the regulon specific score inferred using pySCENIC and by calculating the average expression. |
| Page: 1 |
Top |
Somatic mutation of malignant transformation related genes |
| Annotation of somatic variants for genes involved in malignant transformation |
| Hugo Symbol | Variant Class | Variant Classification | dbSNP RS | HGVSc | HGVSp | HGVSp Short | SWISSPROT | BIOTYPE | SIFT | PolyPhen | Tumor Sample Barcode | Tissue | Histology | Sex | Age | Stage | Therapy Types | Drugs | Outcome |
| TTYH1 | SNV | Missense_Mutation | c.1205C>T | p.Ser402Phe | p.S402F | Q9H313 | protein_coding | deleterious(0) | probably_damaging(0.983) | TCGA-A2-A0CM-01 | Breast | breast invasive carcinoma | Female | <65 | I/II | Chemotherapy | adriamycin | PD | |
| TTYH1 | SNV | Missense_Mutation | rs762277818 | c.728N>G | p.Val243Gly | p.V243G | Q9H313 | protein_coding | deleterious(0) | possibly_damaging(0.885) | TCGA-A2-A0CS-01 | Breast | breast invasive carcinoma | Female | >=65 | III/IV | Hormone Therapy | anastrozole | SD |
| TTYH1 | SNV | Missense_Mutation | c.857C>G | p.Thr286Ser | p.T286S | Q9H313 | protein_coding | deleterious(0.01) | probably_damaging(0.997) | TCGA-A2-A1FZ-01 | Breast | breast invasive carcinoma | Female | <65 | I/II | Unspecific | Arimidex | SD | |
| TTYH1 | SNV | Missense_Mutation | rs762277818 | c.728N>G | p.Val243Gly | p.V243G | Q9H313 | protein_coding | deleterious(0) | possibly_damaging(0.885) | TCGA-E2-A1LA-01 | Breast | breast invasive carcinoma | Female | <65 | I/II | Hormone Therapy | arimidex | SD |
| TTYH1 | insertion | Frame_Shift_Ins | novel | c.1331_1332insTAACAATGCTATGAAGAAGGAACTAT | p.Glu444AspfsTer36 | p.E444Dfs*36 | Q9H313 | protein_coding | TCGA-A7-A0CJ-01 | Breast | breast invasive carcinoma | Female | <65 | I/II | Chemotherapy | cytoxan | SD | ||
| TTYH1 | SNV | Missense_Mutation | rs555603023 | c.218N>A | p.Arg73Gln | p.R73Q | Q9H313 | protein_coding | tolerated(0.05) | possibly_damaging(0.772) | TCGA-2W-A8YY-01 | Cervix | cervical & endocervical cancer | Female | <65 | I/II | Chemotherapy | cisplatin | CR |
| TTYH1 | SNV | Missense_Mutation | rs769313856 | c.494N>A | p.Arg165His | p.R165H | Q9H313 | protein_coding | tolerated(0.05) | probably_damaging(0.991) | TCGA-2W-A8YY-01 | Cervix | cervical & endocervical cancer | Female | <65 | I/II | Chemotherapy | cisplatin | CR |
| TTYH1 | SNV | Missense_Mutation | novel | c.1211N>C | p.Gly404Ala | p.G404A | Q9H313 | protein_coding | tolerated(0.5) | possibly_damaging(0.54) | TCGA-C5-A902-01 | Cervix | cervical & endocervical cancer | Female | <65 | I/II | Chemotherapy | cisplatin | SD |
| TTYH1 | SNV | Missense_Mutation | rs752829139 | c.221N>A | p.Pro74His | p.P74H | Q9H313 | protein_coding | tolerated(0.1) | possibly_damaging(0.506) | TCGA-EK-A2RN-01 | Cervix | cervical & endocervical cancer | Female | <65 | I/II | Unknown | Unknown | SD |
| TTYH1 | SNV | Missense_Mutation | c.1141N>A | p.Leu381Met | p.L381M | Q9H313 | protein_coding | tolerated(0.06) | probably_damaging(0.992) | TCGA-A6-5661-01 | Colorectum | colon adenocarcinoma | Female | >=65 | I/II | Unknown | Unknown | SD |
| Page: 1 2 3 4 5 6 |
Top |
Related drugs of malignant transformation related genes |
| Identification of chemicals and drugs interact with genes involved in malignant transfromation |
| (DGIdb 4.0) |
| Entrez ID | Symbol | Category | Interaction Types | Drug Claim Name | Drug Name | PMIDs |
| Page: 1 |

Copyright 2023-Present -The University of Texas Health Science Center at Houston |