
|
|||||
|
 | |
| |
| |
| |
| |
| |
|
Gene: TTR |
Gene summary for TTR |
| Gene information | Species | Human | Gene symbol | TTR | Gene ID | 7276 |
| Gene name | transthyretin | |
| Gene Alias | ATTR | |
| Cytomap | 18q12.1 | |
| Gene Type | protein-coding | GO ID | GO:0001523 | UniProtAcc | E9KL36 |
Top |
Malignant transformation analysis |
| Identification of the aberrant gene expression in precancerous and cancerous lesions by comparing the gene expression of stem-like cells in diseased tissues with normal stem cells |
| Entrez ID | Symbol | Replicates | Species | Organ | Tissue | Adj P-value | Log2FC | Malignancy |
| 7276 | TTR | NAFLD1 | Human | Liver | NAFLD | 2.46e-03 | 9.91e-02 | -0.04 |
| 7276 | TTR | S43 | Human | Liver | Cirrhotic | 1.22e-02 | -1.91e-02 | -0.0187 |
| 7276 | TTR | HCC1_Meng | Human | Liver | HCC | 5.66e-59 | 8.48e-01 | 0.0246 |
| 7276 | TTR | HCC2_Meng | Human | Liver | HCC | 4.84e-21 | -7.88e-01 | 0.0107 |
| 7276 | TTR | cirrhotic1 | Human | Liver | Cirrhotic | 3.44e-10 | -8.52e-03 | 0.0202 |
| 7276 | TTR | cirrhotic2 | Human | Liver | Cirrhotic | 2.59e-07 | -1.34e-01 | 0.0201 |
| 7276 | TTR | cirrhotic3 | Human | Liver | Cirrhotic | 8.38e-07 | -1.95e-01 | 0.0215 |
| 7276 | TTR | HCC1 | Human | Liver | HCC | 4.59e-29 | 6.25e+00 | 0.5336 |
| 7276 | TTR | HCC2 | Human | Liver | HCC | 6.59e-41 | 9.52e+00 | 0.5341 |
| 7276 | TTR | Pt13.a | Human | Liver | HCC | 6.23e-106 | 1.29e+00 | 0.021 |
| 7276 | TTR | Pt13.b | Human | Liver | HCC | 7.48e-75 | 9.12e-01 | 0.0251 |
| 7276 | TTR | Pt13.c | Human | Liver | HCC | 3.21e-51 | 1.21e+00 | 0.0076 |
| 7276 | TTR | Pt14.a | Human | Liver | HCC | 1.89e-09 | 4.33e-01 | 0.0169 |
| 7276 | TTR | Pt14.b | Human | Liver | HCC | 3.43e-14 | 6.28e-01 | 0.018 |
| 7276 | TTR | Pt14.d | Human | Liver | HCC | 4.04e-07 | 3.35e-01 | 0.0143 |
| 7276 | TTR | S027 | Human | Liver | HCC | 6.86e-04 | 1.30e+00 | 0.2446 |
| 7276 | TTR | S028 | Human | Liver | HCC | 7.40e-14 | 1.56e+00 | 0.2503 |
| 7276 | TTR | S029 | Human | Liver | HCC | 4.78e-18 | 1.83e+00 | 0.2581 |
| 7276 | TTR | HTA12-15-2 | Human | Pancreas | PDAC | 1.43e-13 | 1.30e+00 | 0.2315 |
| 7276 | TTR | HTA12-18-3 | Human | Pancreas | PDAC | 7.11e-07 | 1.15e+00 | 0.0716 |
| Page: 1 2 |
| Tissue | Expression Dynamics | Abbreviation |
| Liver | 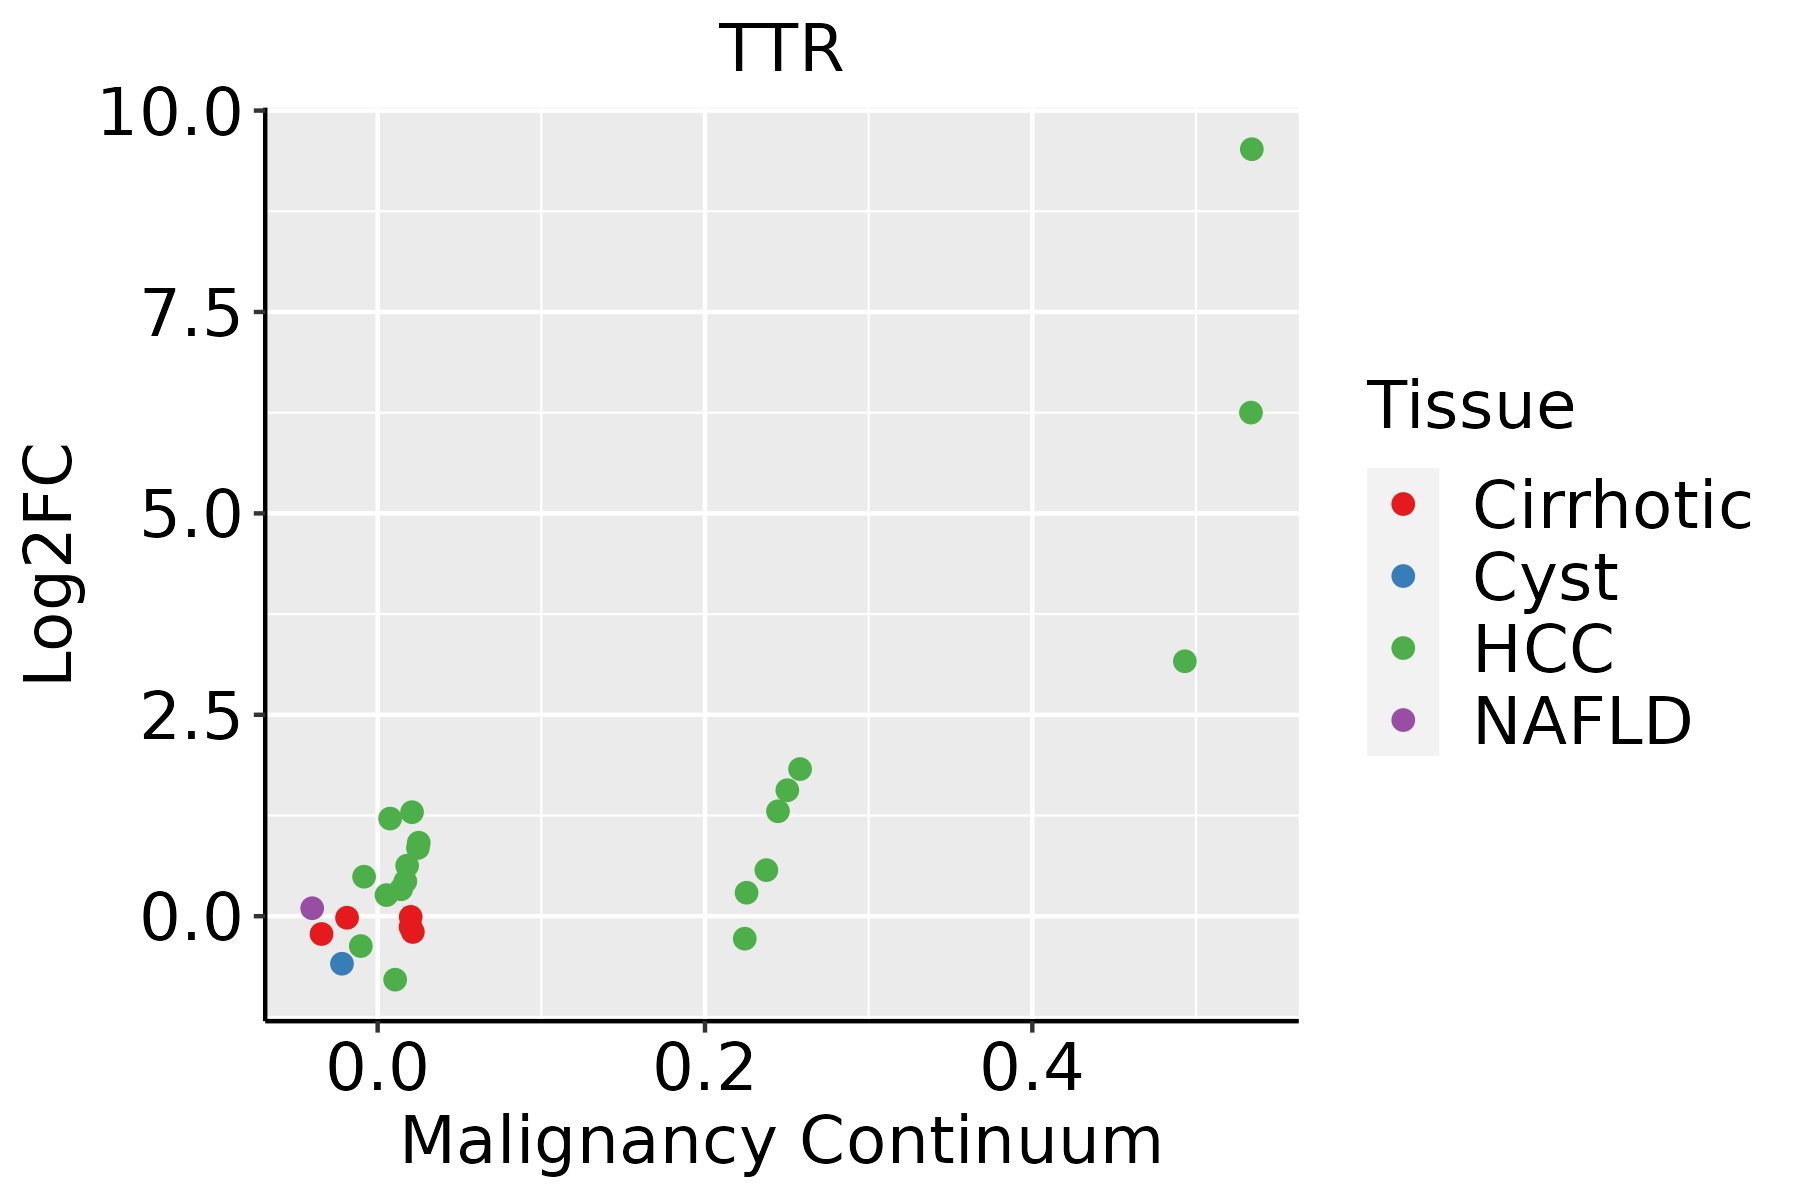 | HCC: Hepatocellular carcinoma |
| NAFLD: Non-alcoholic fatty liver disease |
| ∗log2FC in expression of this searched gene in stem-like cells from each diseased tissue sample relative to stem-like cells in normal samples in each tissue plotted against the malignancy continuum. Samples are colored based on if they are from different disease stage. |
Top |
Malignant transformation related pathway analysis |
| Find out the enriched GO biological processes and KEGG pathways involved in transition from healthy to precancer to cancer |
| Tissue | Disease Stage | Enriched GO biological Processes |
| Colorectum | AD |  |
| Colorectum | SER |  |
| Colorectum | MSS |  |
| Colorectum | MSI-H |  |
| Colorectum | FAP |  |
| ∗Top 15 enriched GO BP terms are showed in the bar plot of each disease state in each tissue. Each row represents a significant GO biological process which is colored according to the -log10(p.adjust). |
| Page: 1 2 3 4 5 6 7 8 9 |
| GO ID | Tissue | Disease Stage | Description | Gene Ratio | Bg Ratio | pvalue | p.adjust | Count |
| GO:00725217 | Liver | NAFLD | purine-containing compound metabolic process | 74/1882 | 416/18723 | 7.73e-07 | 4.27e-05 | 74 |
| GO:00060666 | Liver | NAFLD | alcohol metabolic process | 62/1882 | 353/18723 | 9.01e-06 | 2.96e-04 | 62 |
| GO:01202545 | Liver | NAFLD | olefinic compound metabolic process | 28/1882 | 153/18723 | 1.28e-03 | 1.45e-02 | 28 |
| GO:00424452 | Liver | NAFLD | hormone metabolic process | 36/1882 | 218/18723 | 1.98e-03 | 1.98e-02 | 36 |
| GO:0009112 | Liver | NAFLD | nucleobase metabolic process | 9/1882 | 34/18723 | 5.27e-03 | 4.08e-02 | 9 |
| GO:000606612 | Liver | Cirrhotic | alcohol metabolic process | 141/4634 | 353/18723 | 1.57e-10 | 8.03e-09 | 141 |
| GO:007252112 | Liver | Cirrhotic | purine-containing compound metabolic process | 156/4634 | 416/18723 | 3.74e-09 | 1.52e-07 | 156 |
| GO:00091121 | Liver | Cirrhotic | nucleobase metabolic process | 20/4634 | 34/18723 | 2.41e-05 | 3.14e-04 | 20 |
| GO:00067202 | Liver | Cirrhotic | isoprenoid metabolic process | 46/4634 | 116/18723 | 2.71e-04 | 2.41e-03 | 46 |
| GO:00067212 | Liver | Cirrhotic | terpenoid metabolic process | 38/4634 | 97/18723 | 1.16e-03 | 7.89e-03 | 38 |
| GO:004244511 | Liver | Cirrhotic | hormone metabolic process | 73/4634 | 218/18723 | 2.22e-03 | 1.36e-02 | 73 |
| GO:00343085 | Liver | Cirrhotic | primary alcohol metabolic process | 37/4634 | 102/18723 | 6.17e-03 | 3.07e-02 | 37 |
| GO:00061442 | Liver | Cirrhotic | purine nucleobase metabolic process | 10/4634 | 19/18723 | 8.23e-03 | 3.83e-02 | 10 |
| GO:012025411 | Liver | Cirrhotic | olefinic compound metabolic process | 51/4634 | 153/18723 | 1.03e-02 | 4.61e-02 | 51 |
| GO:007252122 | Liver | HCC | purine-containing compound metabolic process | 250/7958 | 416/18723 | 2.26e-13 | 1.24e-11 | 250 |
| GO:000606621 | Liver | HCC | alcohol metabolic process | 208/7958 | 353/18723 | 2.80e-10 | 9.50e-09 | 208 |
| GO:00091122 | Liver | HCC | nucleobase metabolic process | 28/7958 | 34/18723 | 2.21e-06 | 2.99e-05 | 28 |
| GO:000672011 | Liver | HCC | isoprenoid metabolic process | 65/7958 | 116/18723 | 2.23e-03 | 1.11e-02 | 65 |
| GO:00061441 | Liver | HCC | purine nucleobase metabolic process | 14/7958 | 19/18723 | 5.94e-03 | 2.44e-02 | 14 |
| GO:003430812 | Liver | HCC | primary alcohol metabolic process | 55/7958 | 102/18723 | 1.30e-02 | 4.67e-02 | 55 |
| Page: 1 |
| Pathway ID | Tissue | Disease Stage | Description | Gene Ratio | Bg Ratio | pvalue | p.adjust | qvalue | Count |
| Page: 1 |
Top |
Cell-cell communication analysis |
| Identification of potential cell-cell interactions between two cell types and their ligand-receptor pairs for different disease states |
| Ligand | Receptor | LRpair | Pathway | Tissue | Disease Stage |
| Page: 1 |
Top |
Single-cell gene regulatory network inference analysis |
| Find out the significant the regulons (TFs) and the target genes of each regulon across cell types for different disease states |
| TF | Cell Type | Tissue | Disease Stage | Target Gene | RSS | Regulon Activity |
| ∗The dot plots of a searched regulon are shown for all cell subpopulations in each disease state of each tissue based on the regulon specific score inferred using pySCENIC and by calculating the average expression. |
| Page: 1 |
Top |
Somatic mutation of malignant transformation related genes |
| Annotation of somatic variants for genes involved in malignant transformation |
| Hugo Symbol | Variant Class | Variant Classification | dbSNP RS | HGVSc | HGVSp | HGVSp Short | SWISSPROT | BIOTYPE | SIFT | PolyPhen | Tumor Sample Barcode | Tissue | Histology | Sex | Age | Stage | Therapy Types | Drugs | Outcome |
| TTR | insertion | Frame_Shift_Ins | novel | c.41_42insTCCAAACC | p.Val15ProfsTer21 | p.V15Pfs*21 | P02766 | protein_coding | TCGA-BH-A0BM-01 | Breast | breast invasive carcinoma | Female | <65 | I/II | Chemotherapy | adriamycin | SD | ||
| TTR | insertion | Frame_Shift_Ins | novel | c.43_44insACTTGCTCTTGGCTTG | p.Val15AspfsTer10 | p.V15Dfs*10 | P02766 | protein_coding | TCGA-BH-A0BM-01 | Breast | breast invasive carcinoma | Female | <65 | I/II | Chemotherapy | adriamycin | SD | ||
| TTR | SNV | Missense_Mutation | c.25N>G | p.Leu9Val | p.L9V | P02766 | protein_coding | tolerated(0.82) | benign(0.011) | TCGA-DR-A0ZM-01 | Cervix | cervical & endocervical cancer | Female | <65 | III/IV | Unspecific | Cisplatin | SD | |
| TTR | SNV | Missense_Mutation | c.280N>T | p.Asp94Tyr | p.D94Y | P02766 | protein_coding | deleterious(0) | probably_damaging(0.995) | TCGA-AA-3977-01 | Colorectum | colon adenocarcinoma | Male | >=65 | I/II | Unknown | Unknown | SD | |
| TTR | SNV | Missense_Mutation | novel | c.53N>T | p.Ser18Phe | p.S18F | P02766 | protein_coding | deleterious(0.01) | possibly_damaging(0.653) | TCGA-CA-6717-01 | Colorectum | colon adenocarcinoma | Male | <65 | I/II | Chemotherapy | oxaliplatin | CR |
| TTR | SNV | Missense_Mutation | rs148538950 | c.368G>A | p.Arg123His | p.R123H | P02766 | protein_coding | deleterious(0.04) | possibly_damaging(0.495) | TCGA-AG-3999-01 | Colorectum | rectum adenocarcinoma | Female | <65 | III/IV | Unspecific | PD | |
| TTR | SNV | Missense_Mutation | rs876661395 | c.327N>T | p.Glu109Asp | p.E109D | P02766 | protein_coding | tolerated(0.14) | benign(0.408) | TCGA-F5-6814-01 | Colorectum | rectum adenocarcinoma | Male | <65 | I/II | Unknown | Unknown | SD |
| TTR | SNV | Missense_Mutation | rs148538950 | c.368N>A | p.Arg123His | p.R123H | P02766 | protein_coding | deleterious(0.04) | possibly_damaging(0.495) | TCGA-AP-A056-01 | Endometrium | uterine corpus endometrioid carcinoma | Female | <65 | I/II | Unknown | Unknown | SD |
| TTR | SNV | Missense_Mutation | rs121918081 | c.205A>G | p.Thr69Ala | p.T69A | P02766 | protein_coding | deleterious(0) | probably_damaging(0.974) | TCGA-AP-A0LM-01 | Endometrium | uterine corpus endometrioid carcinoma | Female | <65 | III/IV | Chemotherapy | cisplatin | SD |
| TTR | SNV | Missense_Mutation | rs879254269 | c.122N>A | p.Arg41Gln | p.R41Q | P02766 | protein_coding | tolerated(0.24) | benign(0.06) | TCGA-BS-A0UF-01 | Endometrium | uterine corpus endometrioid carcinoma | Female | >=65 | I/II | Unknown | Unknown | SD |
| Page: 1 2 |
Top |
Related drugs of malignant transformation related genes |
| Identification of chemicals and drugs interact with genes involved in malignant transfromation |
| (DGIdb 4.0) |
| Entrez ID | Symbol | Category | Interaction Types | Drug Claim Name | Drug Name | PMIDs |
| 7276 | TTR | HORMONE ACTIVITY, DRUGGABLE GENOME | Tafamidis | TAFAMIDIS | ||
| 7276 | TTR | HORMONE ACTIVITY, DRUGGABLE GENOME | ISIS-TTRRx | |||
| 7276 | TTR | HORMONE ACTIVITY, DRUGGABLE GENOME | ALN-TTR | |||
| 7276 | TTR | HORMONE ACTIVITY, DRUGGABLE GENOME | CHEMBL2103837 | TAFAMIDIS | ||
| 7276 | TTR | HORMONE ACTIVITY, DRUGGABLE GENOME | inotersen | INOTERSEN | ||
| 7276 | TTR | HORMONE ACTIVITY, DRUGGABLE GENOME | ALN-TTRsc | |||
| 7276 | TTR | HORMONE ACTIVITY, DRUGGABLE GENOME | Patisiran | PATISIRAN | ||
| 7276 | TTR | HORMONE ACTIVITY, DRUGGABLE GENOME | ETHYL CAFFEATE | ETHYL CAFFEATE | 25314129 | |
| 7276 | TTR | HORMONE ACTIVITY, DRUGGABLE GENOME | Patisiran | PATISIRAN | ||
| 7276 | TTR | HORMONE ACTIVITY, DRUGGABLE GENOME | Inotersen | INOTERSEN |
| Page: 1 2 |

Copyright 2023-Present -The University of Texas Health Science Center at Houston |