
|
|||||
|
 | |
| |
| |
| |
| |
| |
|
Gene: TTPA |
Gene summary for TTPA |
| Gene information | Species | Human | Gene symbol | TTPA | Gene ID | 7274 |
| Gene name | alpha tocopherol transfer protein | |
| Gene Alias | ATTP | |
| Cytomap | 8q12.3 | |
| Gene Type | protein-coding | GO ID | GO:0006629 | UniProtAcc | P49638 |
Top |
Malignant transformation analysis |
| Identification of the aberrant gene expression in precancerous and cancerous lesions by comparing the gene expression of stem-like cells in diseased tissues with normal stem cells |
| Entrez ID | Symbol | Replicates | Species | Organ | Tissue | Adj P-value | Log2FC | Malignancy |
| 7274 | TTPA | NAFLD1 | Human | Liver | NAFLD | 1.43e-08 | 7.58e-01 | -0.04 |
| 7274 | TTPA | S43 | Human | Liver | Cirrhotic | 1.25e-03 | -8.54e-02 | -0.0187 |
| 7274 | TTPA | HCC1_Meng | Human | Liver | HCC | 2.12e-04 | -1.63e-01 | 0.0246 |
| 7274 | TTPA | HCC2_Meng | Human | Liver | HCC | 9.68e-04 | -1.61e-01 | 0.0107 |
| 7274 | TTPA | HCC1 | Human | Liver | HCC | 3.14e-11 | 4.24e+00 | 0.5336 |
| 7274 | TTPA | Pt13.b | Human | Liver | HCC | 3.12e-02 | -1.77e-02 | 0.0251 |
| 7274 | TTPA | S014 | Human | Liver | HCC | 1.51e-15 | 1.11e+00 | 0.2254 |
| 7274 | TTPA | S015 | Human | Liver | HCC | 4.05e-18 | 1.29e+00 | 0.2375 |
| 7274 | TTPA | S016 | Human | Liver | HCC | 8.46e-23 | 1.29e+00 | 0.2243 |
| Page: 1 |
| Tissue | Expression Dynamics | Abbreviation |
| Liver | 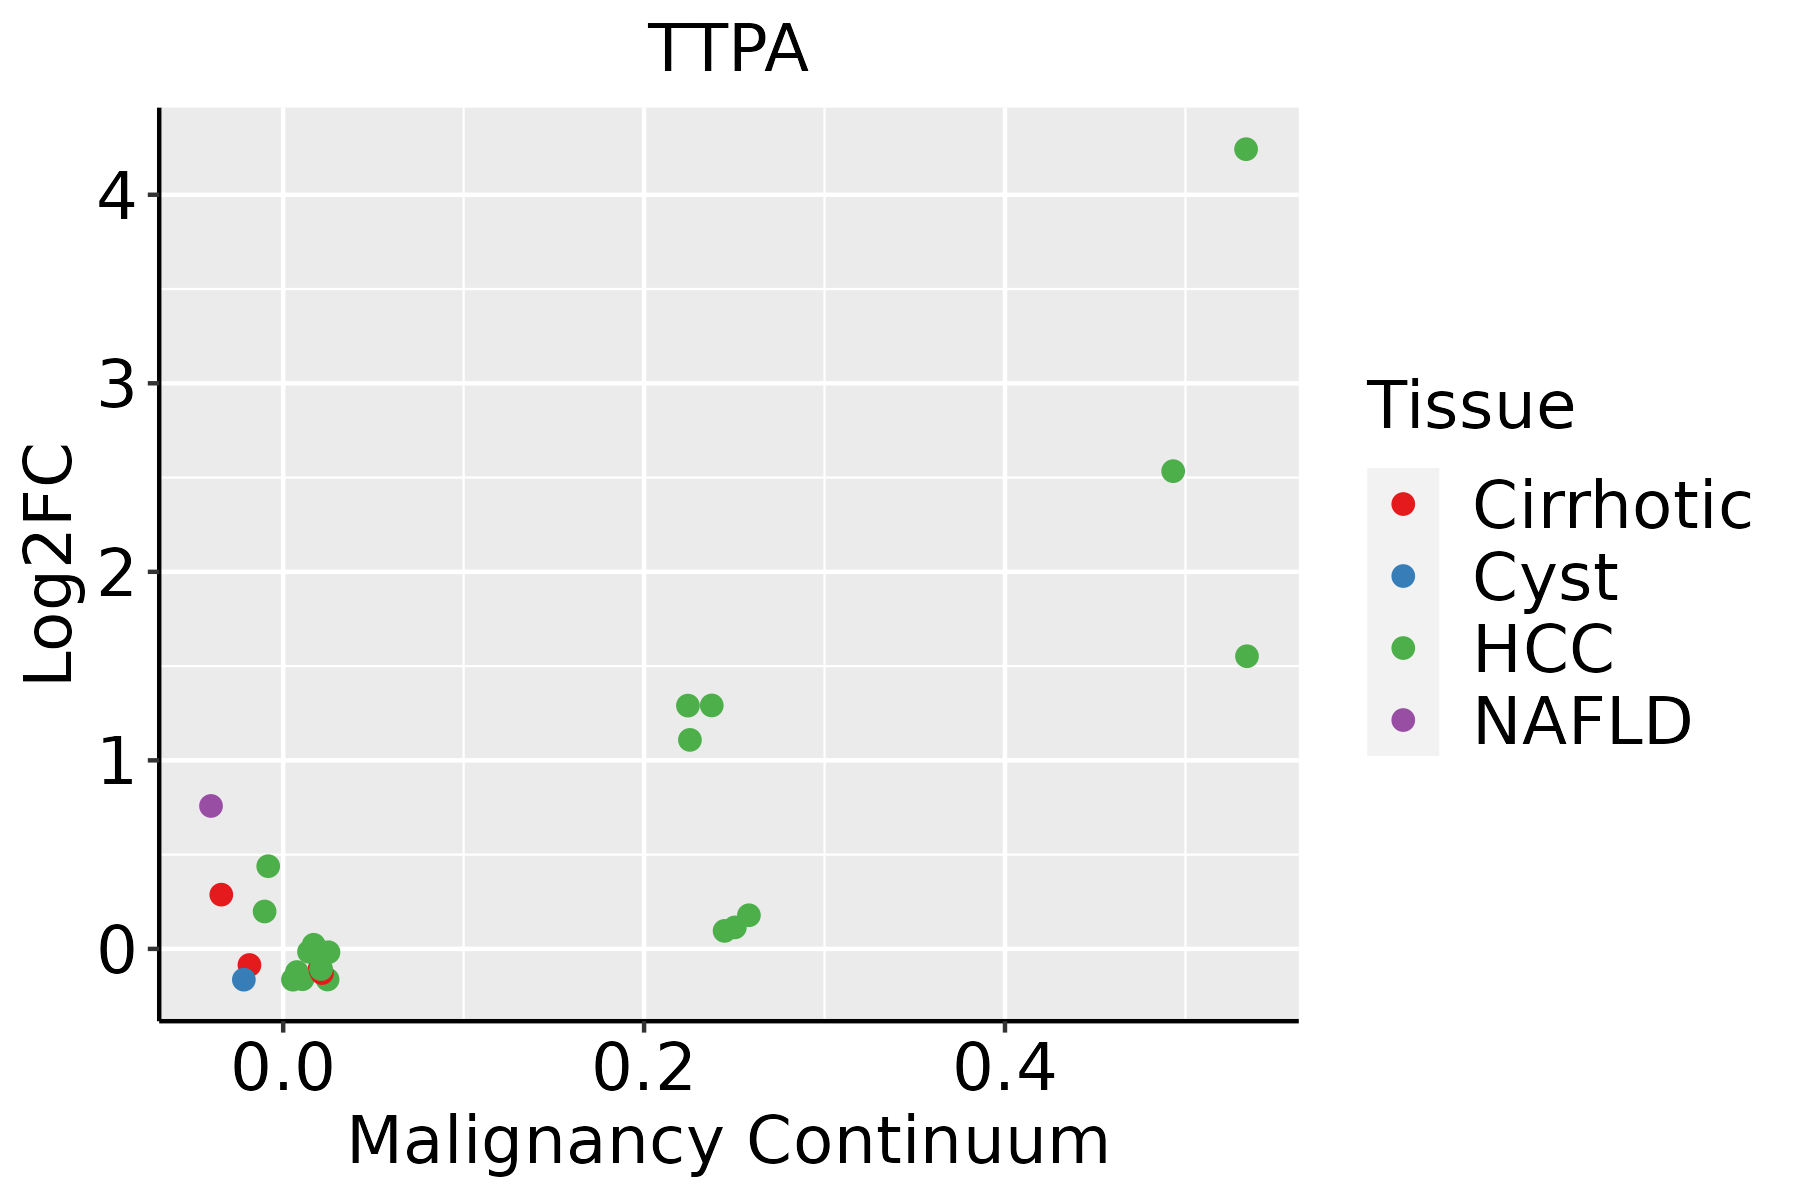 | HCC: Hepatocellular carcinoma |
| NAFLD: Non-alcoholic fatty liver disease |
| ∗log2FC in expression of this searched gene in stem-like cells from each diseased tissue sample relative to stem-like cells in normal samples in each tissue plotted against the malignancy continuum. Samples are colored based on if they are from different disease stage. |
Top |
Malignant transformation related pathway analysis |
| Find out the enriched GO biological processes and KEGG pathways involved in transition from healthy to precancer to cancer |
| Tissue | Disease Stage | Enriched GO biological Processes |
| Colorectum | AD |  |
| Colorectum | SER |  |
| Colorectum | MSS |  |
| Colorectum | MSI-H |  |
| Colorectum | FAP |  |
| ∗Top 15 enriched GO BP terms are showed in the bar plot of each disease state in each tissue. Each row represents a significant GO biological process which is colored according to the -log10(p.adjust). |
| Page: 1 2 3 4 5 6 7 8 9 |
| GO ID | Tissue | Disease Stage | Description | Gene Ratio | Bg Ratio | pvalue | p.adjust | Count |
| GO:00316677 | Liver | NAFLD | response to nutrient levels | 85/1882 | 474/18723 | 8.23e-08 | 7.09e-06 | 85 |
| GO:00108765 | Liver | NAFLD | lipid localization | 79/1882 | 448/18723 | 4.75e-07 | 2.92e-05 | 79 |
| GO:00068694 | Liver | NAFLD | lipid transport | 71/1882 | 398/18723 | 1.16e-06 | 5.59e-05 | 71 |
| GO:00075844 | Liver | NAFLD | response to nutrient | 36/1882 | 174/18723 | 2.06e-05 | 5.78e-04 | 36 |
| GO:01200093 | Liver | NAFLD | intermembrane lipid transfer | 11/1882 | 48/18723 | 7.00e-03 | 4.90e-02 | 11 |
| GO:003166712 | Liver | Cirrhotic | response to nutrient levels | 174/4634 | 474/18723 | 3.08e-09 | 1.27e-07 | 174 |
| GO:000758411 | Liver | Cirrhotic | response to nutrient | 67/4634 | 174/18723 | 3.83e-05 | 4.59e-04 | 67 |
| GO:001087611 | Liver | Cirrhotic | lipid localization | 147/4634 | 448/18723 | 6.24e-05 | 7.12e-04 | 147 |
| GO:0051452 | Liver | Cirrhotic | intracellular pH reduction | 21/4634 | 42/18723 | 3.57e-04 | 3.03e-03 | 21 |
| GO:000686911 | Liver | Cirrhotic | lipid transport | 128/4634 | 398/18723 | 4.54e-04 | 3.69e-03 | 128 |
| GO:0045851 | Liver | Cirrhotic | pH reduction | 22/4634 | 46/18723 | 5.75e-04 | 4.48e-03 | 22 |
| GO:01200091 | Liver | Cirrhotic | intermembrane lipid transfer | 21/4634 | 48/18723 | 3.06e-03 | 1.73e-02 | 21 |
| GO:00300045 | Liver | Cirrhotic | cellular monovalent inorganic cation homeostasis | 38/4634 | 103/18723 | 4.02e-03 | 2.17e-02 | 38 |
| GO:00306415 | Liver | Cirrhotic | regulation of cellular pH | 31/4634 | 81/18723 | 4.76e-03 | 2.50e-02 | 31 |
| GO:00068853 | Liver | Cirrhotic | regulation of pH | 33/4634 | 91/18723 | 9.39e-03 | 4.29e-02 | 33 |
| GO:003166722 | Liver | HCC | response to nutrient levels | 276/7958 | 474/18723 | 2.30e-12 | 1.08e-10 | 276 |
| GO:000758421 | Liver | HCC | response to nutrient | 111/7958 | 174/18723 | 1.10e-08 | 2.73e-07 | 111 |
| GO:001087621 | Liver | HCC | lipid localization | 228/7958 | 448/18723 | 1.80e-04 | 1.41e-03 | 228 |
| GO:01200092 | Liver | HCC | intermembrane lipid transfer | 33/7958 | 48/18723 | 2.12e-04 | 1.63e-03 | 33 |
| GO:000686921 | Liver | HCC | lipid transport | 198/7958 | 398/18723 | 1.92e-03 | 9.78e-03 | 198 |
| Page: 1 2 |
| Pathway ID | Tissue | Disease Stage | Description | Gene Ratio | Bg Ratio | pvalue | p.adjust | qvalue | Count |
| Page: 1 |
Top |
Cell-cell communication analysis |
| Identification of potential cell-cell interactions between two cell types and their ligand-receptor pairs for different disease states |
| Ligand | Receptor | LRpair | Pathway | Tissue | Disease Stage |
| Page: 1 |
Top |
Single-cell gene regulatory network inference analysis |
| Find out the significant the regulons (TFs) and the target genes of each regulon across cell types for different disease states |
| TF | Cell Type | Tissue | Disease Stage | Target Gene | RSS | Regulon Activity |
| ∗The dot plots of a searched regulon are shown for all cell subpopulations in each disease state of each tissue based on the regulon specific score inferred using pySCENIC and by calculating the average expression. |
| Page: 1 |
Top |
Somatic mutation of malignant transformation related genes |
| Annotation of somatic variants for genes involved in malignant transformation |
| Hugo Symbol | Variant Class | Variant Classification | dbSNP RS | HGVSc | HGVSp | HGVSp Short | SWISSPROT | BIOTYPE | SIFT | PolyPhen | Tumor Sample Barcode | Tissue | Histology | Sex | Age | Stage | Therapy Types | Drugs | Outcome |
| TTPA | SNV | Missense_Mutation | c.750N>G | p.Phe250Leu | p.F250L | P49638 | protein_coding | tolerated(0.65) | benign(0.005) | TCGA-AC-A23H-01 | Breast | breast invasive carcinoma | Female | >=65 | I/II | Unknown | Unknown | PD | |
| TTPA | SNV | Missense_Mutation | c.366G>C | p.Trp122Cys | p.W122C | P49638 | protein_coding | deleterious(0) | probably_damaging(1) | TCGA-AN-A0FJ-01 | Breast | breast invasive carcinoma | Female | <65 | III/IV | Unknown | Unknown | SD | |
| TTPA | SNV | Missense_Mutation | rs121917850 | c.575N>A | p.Arg192His | p.R192H | P49638 | protein_coding | deleterious(0) | probably_damaging(0.953) | TCGA-E2-A14R-01 | Breast | breast invasive carcinoma | Female | <65 | I/II | Chemotherapy | doxorubicin | PD |
| TTPA | SNV | Missense_Mutation | novel | c.485N>T | p.Gly162Val | p.G162V | P49638 | protein_coding | deleterious(0) | probably_damaging(0.999) | TCGA-GI-A2C8-01 | Breast | breast invasive carcinoma | Female | <65 | III/IV | Unspecific | Adriamycin | SD |
| TTPA | SNV | Missense_Mutation | rs202136581 | c.551N>T | p.Thr184Met | p.T184M | P49638 | protein_coding | deleterious(0.01) | benign(0.232) | TCGA-AA-3715-01 | Colorectum | colon adenocarcinoma | Male | >=65 | I/II | Unknown | Unknown | PD |
| TTPA | SNV | Missense_Mutation | c.758A>T | p.Glu253Val | p.E253V | P49638 | protein_coding | deleterious(0) | benign(0.1) | TCGA-AD-6889-01 | Colorectum | colon adenocarcinoma | Male | >=65 | I/II | Chemotherapy | xeloda | PD | |
| TTPA | SNV | Missense_Mutation | novel | c.497N>A | p.Ser166Tyr | p.S166Y | P49638 | protein_coding | deleterious(0) | possibly_damaging(0.817) | TCGA-AG-3892-01 | Colorectum | rectum adenocarcinoma | Female | <65 | I/II | Unknown | Unknown | SD |
| TTPA | SNV | Missense_Mutation | novel | c.821N>A | p.Ser274Tyr | p.S274Y | P49638 | protein_coding | deleterious(0) | possibly_damaging(0.896) | TCGA-F5-6814-01 | Colorectum | rectum adenocarcinoma | Male | <65 | I/II | Unknown | Unknown | SD |
| TTPA | insertion | Frame_Shift_Ins | novel | c.429_430insTACCGTAA | p.Val144TyrfsTer7 | p.V144Yfs*7 | P49638 | protein_coding | TCGA-AM-5820-01 | Colorectum | colon adenocarcinoma | Female | <65 | I/II | Unknown | Unknown | SD | ||
| TTPA | insertion | In_Frame_Ins | novel | c.402_403insTATACATTTACC | p.Arg134_Val135insTyrThrPheThr | p.R134_V135insYTFT | P49638 | protein_coding | TCGA-AM-5820-01 | Colorectum | colon adenocarcinoma | Female | <65 | I/II | Unknown | Unknown | SD |
| Page: 1 2 3 4 5 |
Top |
Related drugs of malignant transformation related genes |
| Identification of chemicals and drugs interact with genes involved in malignant transfromation |
| (DGIdb 4.0) |
| Entrez ID | Symbol | Category | Interaction Types | Drug Claim Name | Drug Name | PMIDs |
| Page: 1 |

Copyright 2023-Present -The University of Texas Health Science Center at Houston |