
|
|||||
|
 | |
| |
| |
| |
| |
| |
|
Gene: TTN |
Gene summary for TTN |
| Gene information | Species | Human | Gene symbol | TTN | Gene ID | 7273 |
| Gene name | titin | |
| Gene Alias | CMD1G | |
| Cytomap | 2q31.2 | |
| Gene Type | protein-coding | GO ID | GO:0000070 | UniProtAcc | Q8WZ42 |
Top |
Malignant transformation analysis |
| Identification of the aberrant gene expression in precancerous and cancerous lesions by comparing the gene expression of stem-like cells in diseased tissues with normal stem cells |
| Entrez ID | Symbol | Replicates | Species | Organ | Tissue | Adj P-value | Log2FC | Malignancy |
| 7273 | TTN | HCC1_Meng | Human | Liver | HCC | 1.93e-02 | -1.44e-01 | 0.0246 |
| 7273 | TTN | HCC5 | Human | Liver | HCC | 6.34e-15 | 2.72e+00 | 0.4932 |
| 7273 | TTN | S028 | Human | Liver | HCC | 7.08e-10 | 6.89e-01 | 0.2503 |
| 7273 | TTN | S029 | Human | Liver | HCC | 1.04e-02 | 3.61e-01 | 0.2581 |
| 7273 | TTN | RNA-P25T1-P25T1-1 | Human | Lung | AIS | 2.80e-10 | 5.59e-01 | -0.2116 |
| 7273 | TTN | RNA-P25T1-P25T1-2 | Human | Lung | AIS | 1.21e-06 | 7.26e-01 | -0.1941 |
| 7273 | TTN | RNA-P25T1-P25T1-3 | Human | Lung | AIS | 8.26e-07 | 6.77e-01 | -0.2107 |
| 7273 | TTN | RNA-P25T1-P25T1-4 | Human | Lung | AIS | 2.27e-10 | 6.99e-01 | -0.2119 |
| 7273 | TTN | HTA12-18-3 | Human | Pancreas | PDAC | 1.07e-02 | 5.78e-01 | 0.0716 |
| 7273 | TTN | HTA12-25-1 | Human | Pancreas | PDAC | 2.02e-02 | 4.06e-01 | 0.313 |
| 7273 | TTN | HTA12-26-1 | Human | Pancreas | PDAC | 1.84e-07 | 4.56e-01 | 0.3728 |
| 7273 | TTN | HTA12-29-1 | Human | Pancreas | PDAC | 3.65e-29 | 6.66e-01 | 0.3722 |
| Page: 1 |
| Tissue | Expression Dynamics | Abbreviation |
| Liver | 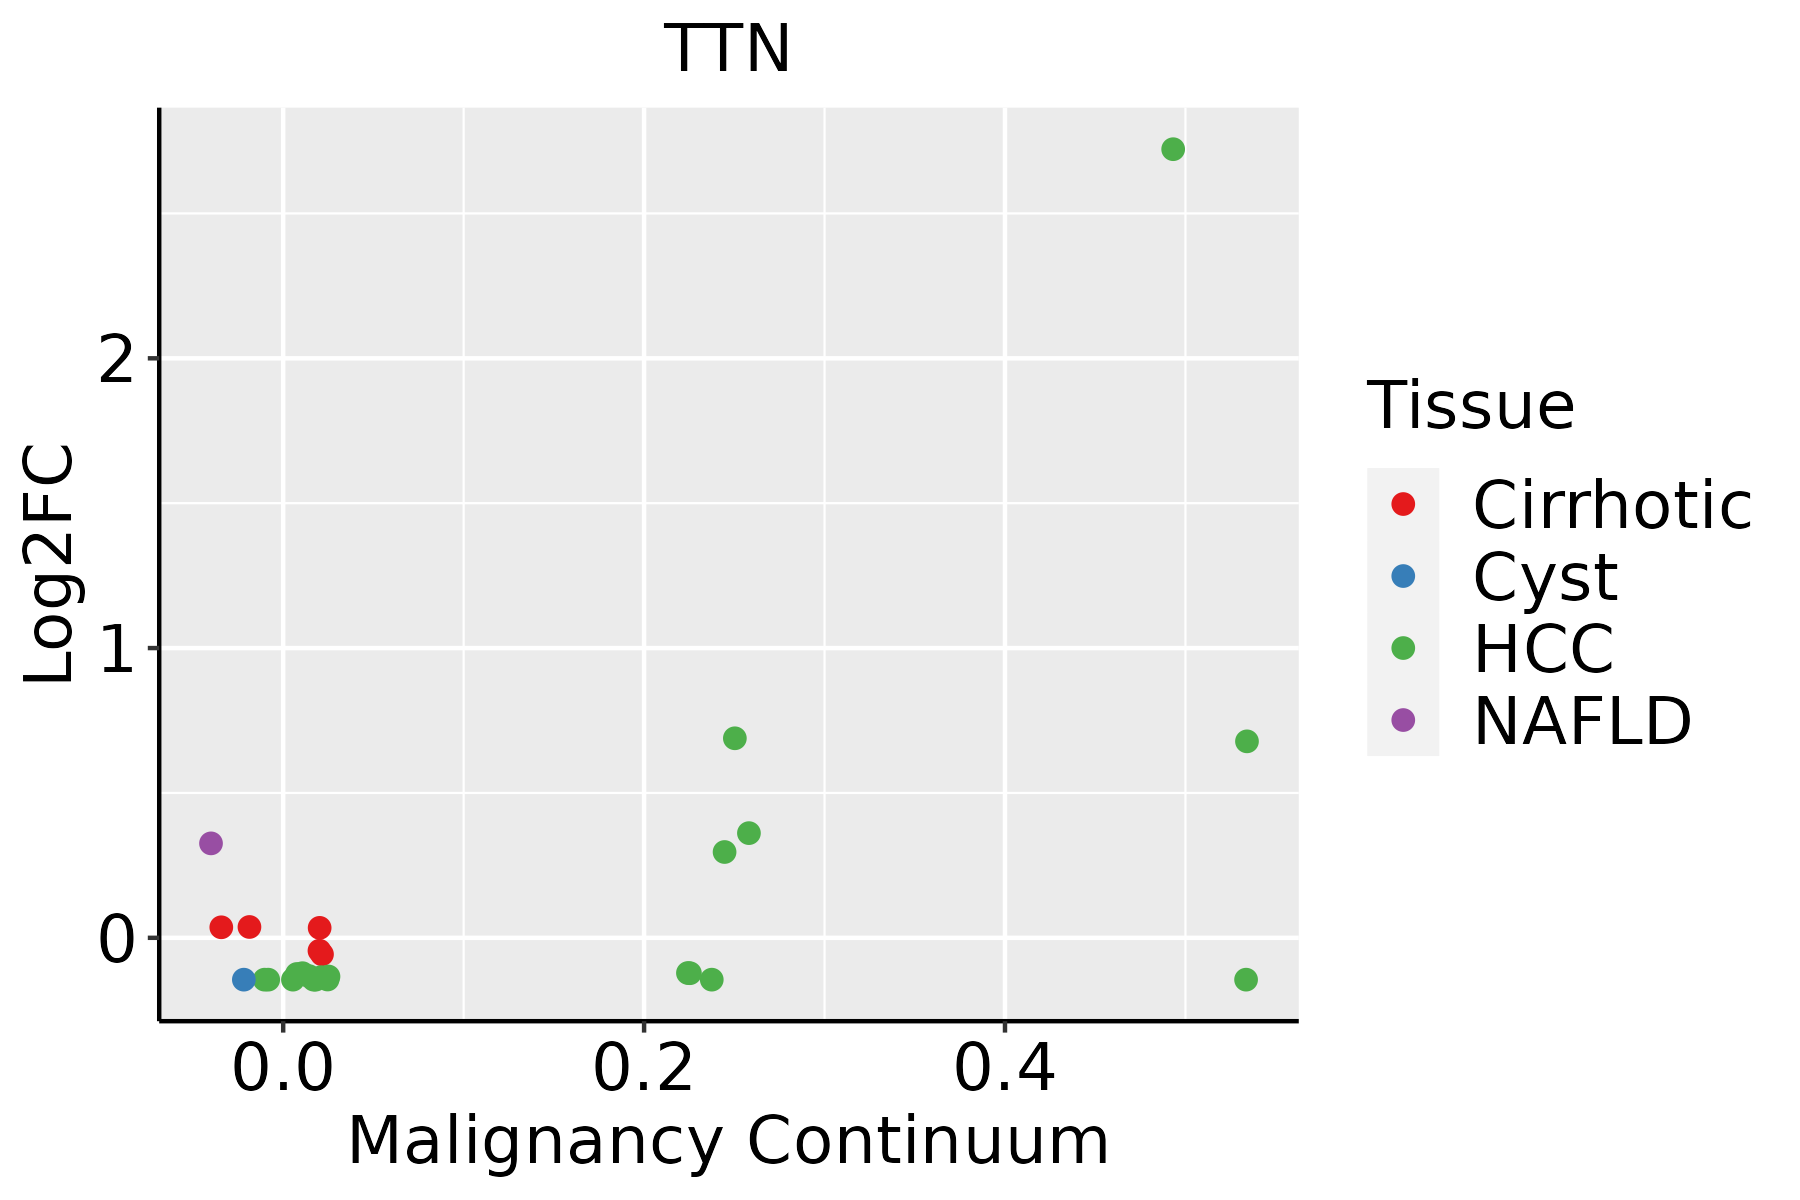 | HCC: Hepatocellular carcinoma |
| NAFLD: Non-alcoholic fatty liver disease | ||
| Lung |  | AAH: Atypical adenomatous hyperplasia |
| AIS: Adenocarcinoma in situ | ||
| IAC: Invasive lung adenocarcinoma | ||
| MIA: Minimally invasive adenocarcinoma |
| ∗log2FC in expression of this searched gene in stem-like cells from each diseased tissue sample relative to stem-like cells in normal samples in each tissue plotted against the malignancy continuum. Samples are colored based on if they are from different disease stage. |
Top |
Malignant transformation related pathway analysis |
| Find out the enriched GO biological processes and KEGG pathways involved in transition from healthy to precancer to cancer |
| Tissue | Disease Stage | Enriched GO biological Processes |
| Colorectum | AD |  |
| Colorectum | SER |  |
| Colorectum | MSS |  |
| Colorectum | MSI-H |  |
| Colorectum | FAP |  |
| ∗Top 15 enriched GO BP terms are showed in the bar plot of each disease state in each tissue. Each row represents a significant GO biological process which is colored according to the -log10(p.adjust). |
| Page: 1 2 3 4 5 6 7 8 9 |
| GO ID | Tissue | Disease Stage | Description | Gene Ratio | Bg Ratio | pvalue | p.adjust | Count |
| GO:20012339 | Breast | Precancer | regulation of apoptotic signaling pathway | 65/1080 | 356/18723 | 7.70e-17 | 3.17e-14 | 65 |
| GO:20012349 | Breast | Precancer | negative regulation of apoptotic signaling pathway | 39/1080 | 224/18723 | 5.35e-10 | 4.77e-08 | 39 |
| GO:00432549 | Breast | Precancer | regulation of protein-containing complex assembly | 50/1080 | 428/18723 | 1.63e-06 | 5.97e-05 | 50 |
| GO:00313349 | Breast | Precancer | positive regulation of protein-containing complex assembly | 33/1080 | 237/18723 | 2.39e-06 | 8.21e-05 | 33 |
| GO:20012369 | Breast | Precancer | regulation of extrinsic apoptotic signaling pathway | 24/1080 | 151/18723 | 5.78e-06 | 1.70e-04 | 24 |
| GO:00971919 | Breast | Precancer | extrinsic apoptotic signaling pathway | 30/1080 | 219/18723 | 9.42e-06 | 2.50e-04 | 30 |
| GO:19029059 | Breast | Precancer | positive regulation of supramolecular fiber organization | 28/1080 | 209/18723 | 2.79e-05 | 6.28e-04 | 28 |
| GO:19029039 | Breast | Precancer | regulation of supramolecular fiber organization | 42/1080 | 383/18723 | 4.92e-05 | 1.04e-03 | 42 |
| GO:00329709 | Breast | Precancer | regulation of actin filament-based process | 42/1080 | 397/18723 | 1.11e-04 | 2.01e-03 | 42 |
| GO:00514959 | Breast | Precancer | positive regulation of cytoskeleton organization | 28/1080 | 226/18723 | 1.13e-04 | 2.04e-03 | 28 |
| GO:20012379 | Breast | Precancer | negative regulation of extrinsic apoptotic signaling pathway | 16/1080 | 97/18723 | 1.29e-04 | 2.24e-03 | 16 |
| GO:00004226 | Breast | Precancer | autophagy of mitochondrion | 14/1080 | 81/18723 | 2.01e-04 | 3.16e-03 | 14 |
| GO:00617266 | Breast | Precancer | mitochondrion disassembly | 14/1080 | 81/18723 | 2.01e-04 | 3.16e-03 | 14 |
| GO:00070159 | Breast | Precancer | actin filament organization | 44/1080 | 442/18723 | 3.02e-04 | 4.35e-03 | 44 |
| GO:00224119 | Breast | Precancer | cellular component disassembly | 44/1080 | 443/18723 | 3.17e-04 | 4.51e-03 | 44 |
| GO:00160497 | Breast | Precancer | cell growth | 46/1080 | 482/18723 | 5.63e-04 | 7.16e-03 | 46 |
| GO:00108217 | Breast | Precancer | regulation of mitochondrion organization | 19/1080 | 144/18723 | 6.26e-04 | 7.78e-03 | 19 |
| GO:00329569 | Breast | Precancer | regulation of actin cytoskeleton organization | 36/1080 | 358/18723 | 8.56e-04 | 9.88e-03 | 36 |
| GO:00068986 | Breast | Precancer | receptor-mediated endocytosis | 27/1080 | 244/18723 | 9.01e-04 | 1.03e-02 | 27 |
| GO:00322739 | Breast | Precancer | positive regulation of protein polymerization | 18/1080 | 138/18723 | 9.85e-04 | 1.11e-02 | 18 |
| Page: 1 2 3 4 5 6 7 8 9 10 11 12 13 14 15 16 17 18 19 20 21 22 23 24 25 26 27 28 29 30 31 32 33 34 35 36 37 38 39 40 41 42 43 44 45 46 47 48 |
| Pathway ID | Tissue | Disease Stage | Description | Gene Ratio | Bg Ratio | pvalue | p.adjust | qvalue | Count |
| hsa054142 | Lung | AIS | Dilated cardiomyopathy | 22/961 | 96/8465 | 9.02e-04 | 7.11e-03 | 4.55e-03 | 22 |
| hsa054102 | Lung | AIS | Hypertrophic cardiomyopathy | 20/961 | 90/8465 | 2.25e-03 | 1.37e-02 | 8.80e-03 | 20 |
| hsa054143 | Lung | AIS | Dilated cardiomyopathy | 22/961 | 96/8465 | 9.02e-04 | 7.11e-03 | 4.55e-03 | 22 |
| hsa054103 | Lung | AIS | Hypertrophic cardiomyopathy | 20/961 | 90/8465 | 2.25e-03 | 1.37e-02 | 8.80e-03 | 20 |
| Page: 1 |
Top |
Cell-cell communication analysis |
| Identification of potential cell-cell interactions between two cell types and their ligand-receptor pairs for different disease states |
| Ligand | Receptor | LRpair | Pathway | Tissue | Disease Stage |
| Page: 1 |
Top |
Single-cell gene regulatory network inference analysis |
| Find out the significant the regulons (TFs) and the target genes of each regulon across cell types for different disease states |
| TF | Cell Type | Tissue | Disease Stage | Target Gene | RSS | Regulon Activity |
| ∗The dot plots of a searched regulon are shown for all cell subpopulations in each disease state of each tissue based on the regulon specific score inferred using pySCENIC and by calculating the average expression. |
| Page: 1 |
Top |
Somatic mutation of malignant transformation related genes |
| Annotation of somatic variants for genes involved in malignant transformation |
| Hugo Symbol | Variant Class | Variant Classification | dbSNP RS | HGVSc | HGVSp | HGVSp Short | SWISSPROT | BIOTYPE | SIFT | PolyPhen | Tumor Sample Barcode | Tissue | Histology | Sex | Age | Stage | Therapy Types | Drugs | Outcome |
| TTN | SNV | Missense_Mutation | rs557526069 | c.35041G>A | p.Glu11681Lys | p.E11681K | protein_coding | TCGA-3C-AALI-01 | Breast | breast invasive carcinoma | Female | <65 | I/II | Unspecific | Poly E | Complete Response | |||
| TTN | SNV | Missense_Mutation | novel | c.31372N>C | p.Val10458Leu | p.V10458L | protein_coding | TCGA-3C-AALJ-01 | Breast | breast invasive carcinoma | Female | <65 | I/II | Chemotherapy | doxorubicin | SD | |||
| TTN | SNV | Missense_Mutation | c.69142N>A | p.Glu23048Lys | p.E23048K | protein_coding | TCGA-5L-AAT0-01 | Breast | breast invasive carcinoma | Female | <65 | I/II | Hormone Therapy | tamoxiphen | SD | ||||
| TTN | SNV | Missense_Mutation | novel | c.105331G>C | p.Glu35111Gln | p.E35111Q | protein_coding | TCGA-5L-AAT1-01 | Breast | breast invasive carcinoma | Female | <65 | III/IV | Hormone Therapy | letrozol | SD | |||
| TTN | SNV | Missense_Mutation | novel | c.91713G>A | p.Met30571Ile | p.M30571I | protein_coding | TCGA-5L-AAT1-01 | Breast | breast invasive carcinoma | Female | <65 | III/IV | Hormone Therapy | letrozol | SD | |||
| TTN | SNV | Missense_Mutation | c.31520A>T | p.Glu10507Val | p.E10507V | protein_coding | TCGA-A1-A0SO-01 | Breast | breast invasive carcinoma | Female | >=65 | I/II | Chemotherapy | SD | |||||
| TTN | SNV | Missense_Mutation | novel | c.43021N>A | p.Glu14341Lys | p.E14341K | protein_coding | TCGA-A2-A04P-01 | Breast | breast invasive carcinoma | Female | <65 | III/IV | Chemotherapy | taxol | PD | |||
| TTN | SNV | Missense_Mutation | c.58960N>T | p.Val19654Phe | p.V19654F | protein_coding | TCGA-A2-A04R-01 | Breast | breast invasive carcinoma | Female | <65 | I/II | Chemotherapy | taxol | SD | ||||
| TTN | SNV | Missense_Mutation | novel | c.38183N>T | p.Lys12728Ile | p.K12728I | protein_coding | TCGA-A2-A04R-01 | Breast | breast invasive carcinoma | Female | <65 | I/II | Chemotherapy | taxol | SD | |||
| TTN | SNV | Missense_Mutation | novel | c.10739C>G | p.Ala3580Gly | p.A3580G | protein_coding | TCGA-A2-A0CU-01 | Breast | breast invasive carcinoma | Female | >=65 | I/II | Hormone Therapy | tamoxiphen | SD |
Top |
Related drugs of malignant transformation related genes |
| Identification of chemicals and drugs interact with genes involved in malignant transfromation |
| (DGIdb 4.0) |
| Entrez ID | Symbol | Category | Interaction Types | Drug Claim Name | Drug Name | PMIDs |
| 7273 | TTN | DRUGGABLE GENOME, TYROSINE KINASE, SERINE THREONINE KINASE, KINASE, ENZYME | PROTEASE INHIBITORS | 9648223 |
| Page: 1 |

Copyright 2023-Present -The University of Texas Health Science Center at Houston |