
|
|||||
|
 | |
| |
| |
| |
| |
| |
|
Gene: TTLL4 |
Gene summary for TTLL4 |
| Gene information | Species | Human | Gene symbol | TTLL4 | Gene ID | 9654 |
| Gene name | tubulin tyrosine ligase like 4 | |
| Gene Alias | TTLL4 | |
| Cytomap | 2q35 | |
| Gene Type | protein-coding | GO ID | GO:0000226 | UniProtAcc | A0A024R424 |
Top |
Malignant transformation analysis |
| Identification of the aberrant gene expression in precancerous and cancerous lesions by comparing the gene expression of stem-like cells in diseased tissues with normal stem cells |
| Entrez ID | Symbol | Replicates | Species | Organ | Tissue | Adj P-value | Log2FC | Malignancy |
| 9654 | TTLL4 | LZE24T | Human | Esophagus | ESCC | 9.19e-06 | 1.63e-01 | 0.0596 |
| 9654 | TTLL4 | P2T-E | Human | Esophagus | ESCC | 3.52e-25 | 5.41e-01 | 0.1177 |
| 9654 | TTLL4 | P4T-E | Human | Esophagus | ESCC | 2.20e-02 | 7.99e-02 | 0.1323 |
| 9654 | TTLL4 | P8T-E | Human | Esophagus | ESCC | 2.23e-04 | 6.62e-02 | 0.0889 |
| 9654 | TTLL4 | P10T-E | Human | Esophagus | ESCC | 5.52e-07 | 7.82e-02 | 0.116 |
| 9654 | TTLL4 | P11T-E | Human | Esophagus | ESCC | 1.13e-06 | 2.22e-01 | 0.1426 |
| 9654 | TTLL4 | P12T-E | Human | Esophagus | ESCC | 3.63e-05 | 1.18e-01 | 0.1122 |
| 9654 | TTLL4 | P15T-E | Human | Esophagus | ESCC | 2.04e-07 | 1.72e-01 | 0.1149 |
| 9654 | TTLL4 | P16T-E | Human | Esophagus | ESCC | 2.53e-22 | 4.14e-01 | 0.1153 |
| 9654 | TTLL4 | P20T-E | Human | Esophagus | ESCC | 3.11e-04 | 1.13e-01 | 0.1124 |
| 9654 | TTLL4 | P21T-E | Human | Esophagus | ESCC | 2.74e-02 | 8.36e-02 | 0.1617 |
| 9654 | TTLL4 | P22T-E | Human | Esophagus | ESCC | 4.42e-03 | 1.01e-01 | 0.1236 |
| 9654 | TTLL4 | P23T-E | Human | Esophagus | ESCC | 9.87e-03 | 9.64e-02 | 0.108 |
| 9654 | TTLL4 | P24T-E | Human | Esophagus | ESCC | 4.71e-08 | 1.51e-01 | 0.1287 |
| 9654 | TTLL4 | P26T-E | Human | Esophagus | ESCC | 1.56e-06 | 1.11e-01 | 0.1276 |
| 9654 | TTLL4 | P27T-E | Human | Esophagus | ESCC | 1.80e-09 | 1.89e-01 | 0.1055 |
| 9654 | TTLL4 | P28T-E | Human | Esophagus | ESCC | 2.97e-04 | 1.33e-01 | 0.1149 |
| 9654 | TTLL4 | P30T-E | Human | Esophagus | ESCC | 2.13e-03 | 1.47e-01 | 0.137 |
| 9654 | TTLL4 | P31T-E | Human | Esophagus | ESCC | 8.12e-06 | 8.62e-02 | 0.1251 |
| 9654 | TTLL4 | P32T-E | Human | Esophagus | ESCC | 6.70e-04 | 8.86e-02 | 0.1666 |
| Page: 1 2 3 |
| Tissue | Expression Dynamics | Abbreviation |
| Esophagus | 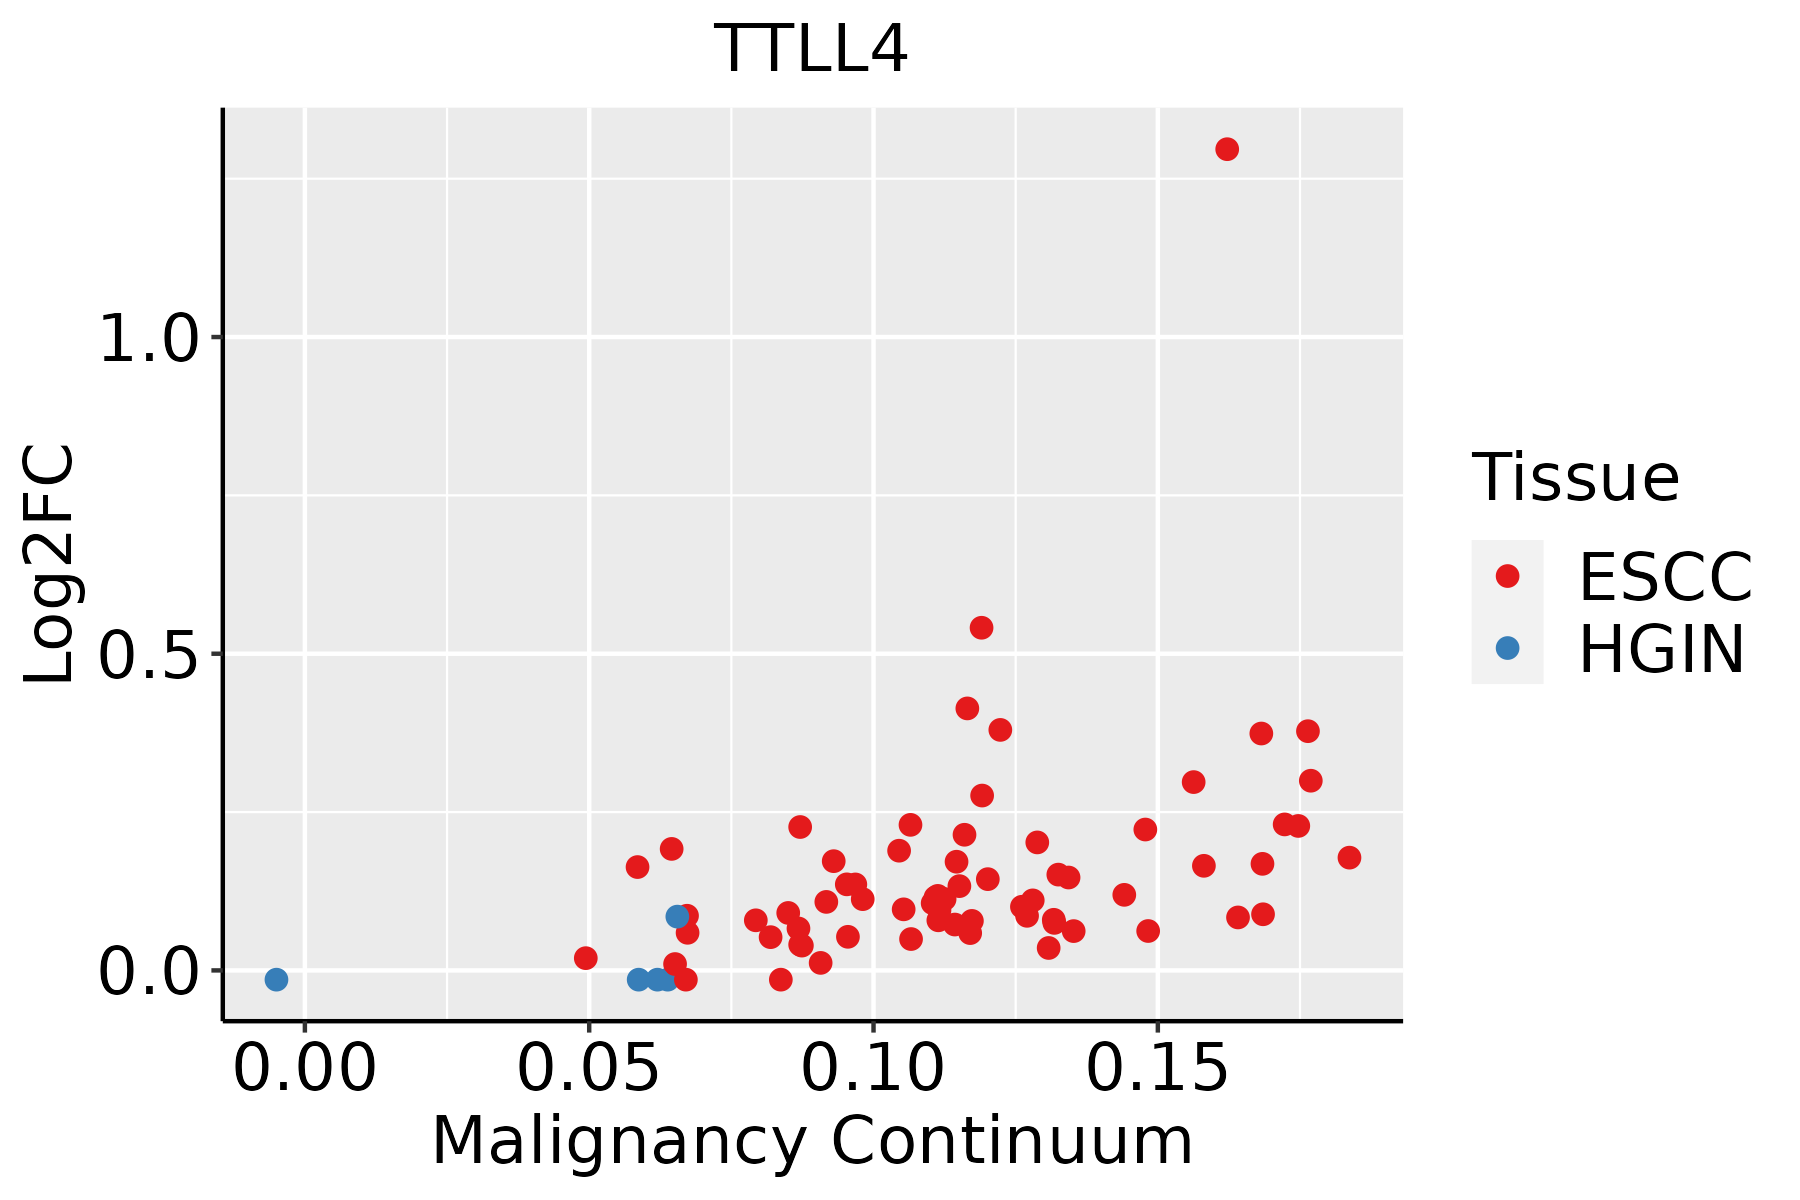 | ESCC: Esophageal squamous cell carcinoma |
| HGIN: High-grade intraepithelial neoplasias | ||
| LGIN: Low-grade intraepithelial neoplasias |
| ∗log2FC in expression of this searched gene in stem-like cells from each diseased tissue sample relative to stem-like cells in normal samples in each tissue plotted against the malignancy continuum. Samples are colored based on if they are from different disease stage. |
Top |
Malignant transformation related pathway analysis |
| Find out the enriched GO biological processes and KEGG pathways involved in transition from healthy to precancer to cancer |
| Tissue | Disease Stage | Enriched GO biological Processes |
| Colorectum | AD |  |
| Colorectum | SER |  |
| Colorectum | MSS |  |
| Colorectum | MSI-H |  |
| Colorectum | FAP |  |
| ∗Top 15 enriched GO BP terms are showed in the bar plot of each disease state in each tissue. Each row represents a significant GO biological process which is colored according to the -log10(p.adjust). |
| Page: 1 2 3 4 5 6 7 8 9 |
| GO ID | Tissue | Disease Stage | Description | Gene Ratio | Bg Ratio | pvalue | p.adjust | Count |
| GO:000170119 | Esophagus | ESCC | in utero embryonic development | 243/8552 | 367/18723 | 1.00e-15 | 6.86e-14 | 243 |
| GO:000182412 | Esophagus | ESCC | blastocyst development | 73/8552 | 106/18723 | 1.13e-06 | 1.40e-05 | 73 |
| Page: 1 |
| Pathway ID | Tissue | Disease Stage | Description | Gene Ratio | Bg Ratio | pvalue | p.adjust | qvalue | Count |
| Page: 1 |
Top |
Cell-cell communication analysis |
| Identification of potential cell-cell interactions between two cell types and their ligand-receptor pairs for different disease states |
| Ligand | Receptor | LRpair | Pathway | Tissue | Disease Stage |
| Page: 1 |
Top |
Single-cell gene regulatory network inference analysis |
| Find out the significant the regulons (TFs) and the target genes of each regulon across cell types for different disease states |
| TF | Cell Type | Tissue | Disease Stage | Target Gene | RSS | Regulon Activity |
| ∗The dot plots of a searched regulon are shown for all cell subpopulations in each disease state of each tissue based on the regulon specific score inferred using pySCENIC and by calculating the average expression. |
| Page: 1 |
Top |
Somatic mutation of malignant transformation related genes |
| Annotation of somatic variants for genes involved in malignant transformation |
| Hugo Symbol | Variant Class | Variant Classification | dbSNP RS | HGVSc | HGVSp | HGVSp Short | SWISSPROT | BIOTYPE | SIFT | PolyPhen | Tumor Sample Barcode | Tissue | Histology | Sex | Age | Stage | Therapy Types | Drugs | Outcome |
| TTLL4 | SNV | Missense_Mutation | c.1033N>T | p.Ala345Ser | p.A345S | Q14679 | protein_coding | tolerated(0.25) | benign(0.015) | TCGA-A7-A6VY-01 | Breast | breast invasive carcinoma | Female | <65 | I/II | Chemotherapy | cyclophosphamide | CR | |
| TTLL4 | SNV | Missense_Mutation | c.2874N>A | p.Ser958Arg | p.S958R | Q14679 | protein_coding | tolerated(0.09) | benign(0.294) | TCGA-AN-A0AK-01 | Breast | breast invasive carcinoma | Female | >=65 | I/II | Unknown | Unknown | SD | |
| TTLL4 | SNV | Missense_Mutation | rs377347204 | c.3023G>A | p.Arg1008Gln | p.R1008Q | Q14679 | protein_coding | deleterious(0.04) | possibly_damaging(0.451) | TCGA-AO-A0JM-01 | Breast | breast invasive carcinoma | Female | <65 | I/II | Chemotherapy | doxorubicin | SD |
| TTLL4 | SNV | Missense_Mutation | c.2165N>T | p.Pro722Leu | p.P722L | Q14679 | protein_coding | deleterious(0) | probably_damaging(1) | TCGA-AQ-A04H-01 | Breast | breast invasive carcinoma | Female | <65 | III/IV | Chemotherapy | taxotere | SD | |
| TTLL4 | SNV | Missense_Mutation | c.3571N>T | p.Ser1191Cys | p.S1191C | Q14679 | protein_coding | deleterious_low_confidence(0.03) | benign(0.257) | TCGA-BH-A0B0-01 | Breast | breast invasive carcinoma | Female | <65 | I/II | Chemotherapy | adriamycin | CR | |
| TTLL4 | SNV | Missense_Mutation | c.2138N>A | p.Ser713Asn | p.S713N | Q14679 | protein_coding | tolerated(0.14) | benign(0.014) | TCGA-BH-A0HF-01 | Breast | breast invasive carcinoma | Female | >=65 | I/II | Hormone Therapy | arimidex | SD | |
| TTLL4 | SNV | Missense_Mutation | c.1676N>C | p.Ile559Thr | p.I559T | Q14679 | protein_coding | tolerated(0.24) | benign(0.015) | TCGA-BH-A28Q-01 | Breast | breast invasive carcinoma | Female | <65 | I/II | Unknown | Unknown | SD | |
| TTLL4 | insertion | Nonsense_Mutation | novel | c.2726_2727insAATAGCGACGCCATCTGGGAGAAGATAAAGGATGTTGTTGTCAAAAC | p.Ser910IlefsTer9 | p.S910Ifs*9 | Q14679 | protein_coding | TCGA-A8-A06X-01 | Breast | breast invasive carcinoma | Female | >=65 | I/II | Unknown | Unknown | SD | ||
| TTLL4 | insertion | In_Frame_Ins | novel | c.1171_1172insTTCTGTTTTCTTTTTTCTCCTTTGTGTATTTTC | p.Glu391delinsValLeuPheSerPhePheSerPheValTyrPheGln | p.E391delinsVLFSFFSFVYFQ | Q14679 | protein_coding | TCGA-A8-A095-01 | Breast | breast invasive carcinoma | Female | <65 | I/II | Chemotherapy | 5-fluorouracil | CR | ||
| TTLL4 | deletion | Frame_Shift_Del | novel | c.1422delN | p.Gly475AlafsTer41 | p.G475Afs*41 | Q14679 | protein_coding | TCGA-EW-A2FV-01 | Breast | breast invasive carcinoma | Female | <65 | III/IV | Chemotherapy | docetaxel | SD |
| Page: 1 2 3 4 5 6 7 8 9 10 11 |
Top |
Related drugs of malignant transformation related genes |
| Identification of chemicals and drugs interact with genes involved in malignant transfromation |
| (DGIdb 4.0) |
| Entrez ID | Symbol | Category | Interaction Types | Drug Claim Name | Drug Name | PMIDs |
| Page: 1 |

Copyright 2023-Present -The University of Texas Health Science Center at Houston |