
|
|||||
|
 | |
| |
| |
| |
| |
| |
|
Gene: TTL |
Gene summary for TTL |
| Gene information | Species | Human | Gene symbol | TTL | Gene ID | 150465 |
| Gene name | tubulin tyrosine ligase | |
| Gene Alias | TTL | |
| Cytomap | 2q14.1 | |
| Gene Type | protein-coding | GO ID | GO:0000226 | UniProtAcc | Q8NG68 |
Top |
Malignant transformation analysis |
| Identification of the aberrant gene expression in precancerous and cancerous lesions by comparing the gene expression of stem-like cells in diseased tissues with normal stem cells |
| Entrez ID | Symbol | Replicates | Species | Organ | Tissue | Adj P-value | Log2FC | Malignancy |
| 150465 | TTL | HCC1_Meng | Human | Liver | HCC | 2.30e-18 | 1.76e-02 | 0.0246 |
| 150465 | TTL | HCC2 | Human | Liver | HCC | 9.58e-20 | 3.89e+00 | 0.5341 |
| 150465 | TTL | Pt14.a | Human | Liver | HCC | 2.24e-03 | 2.59e-01 | 0.0169 |
| 150465 | TTL | S014 | Human | Liver | HCC | 1.02e-03 | 2.53e-01 | 0.2254 |
| 150465 | TTL | S016 | Human | Liver | HCC | 1.25e-02 | 1.97e-01 | 0.2243 |
| 150465 | TTL | S028 | Human | Liver | HCC | 1.53e-16 | 5.89e-01 | 0.2503 |
| 150465 | TTL | S029 | Human | Liver | HCC | 2.40e-10 | 5.72e-01 | 0.2581 |
| 150465 | TTL | C04 | Human | Oral cavity | OSCC | 1.01e-08 | 6.21e-01 | 0.2633 |
| 150465 | TTL | C21 | Human | Oral cavity | OSCC | 4.49e-08 | 3.48e-01 | 0.2678 |
| 150465 | TTL | C30 | Human | Oral cavity | OSCC | 6.89e-11 | 5.60e-01 | 0.3055 |
| 150465 | TTL | C38 | Human | Oral cavity | OSCC | 8.98e-05 | 5.37e-01 | 0.172 |
| 150465 | TTL | C46 | Human | Oral cavity | OSCC | 2.38e-02 | 1.46e-01 | 0.1673 |
| 150465 | TTL | C51 | Human | Oral cavity | OSCC | 8.78e-04 | 2.58e-01 | 0.2674 |
| 150465 | TTL | C09 | Human | Oral cavity | OSCC | 3.48e-02 | 9.74e-02 | 0.1431 |
| 150465 | TTL | SYSMH1 | Human | Oral cavity | OSCC | 5.30e-08 | 2.88e-01 | 0.1127 |
| 150465 | TTL | SYSMH2 | Human | Oral cavity | OSCC | 3.78e-09 | 3.36e-01 | 0.2326 |
| 150465 | TTL | SYSMH3 | Human | Oral cavity | OSCC | 3.60e-23 | 5.98e-01 | 0.2442 |
| 150465 | TTL | male-WTA | Human | Thyroid | PTC | 2.21e-14 | 1.64e-01 | 0.1037 |
| 150465 | TTL | PTC01 | Human | Thyroid | PTC | 1.95e-02 | 3.73e-02 | 0.1899 |
| 150465 | TTL | PTC04 | Human | Thyroid | PTC | 1.89e-05 | 1.61e-01 | 0.1927 |
| Page: 1 2 |
| Tissue | Expression Dynamics | Abbreviation |
| Liver | 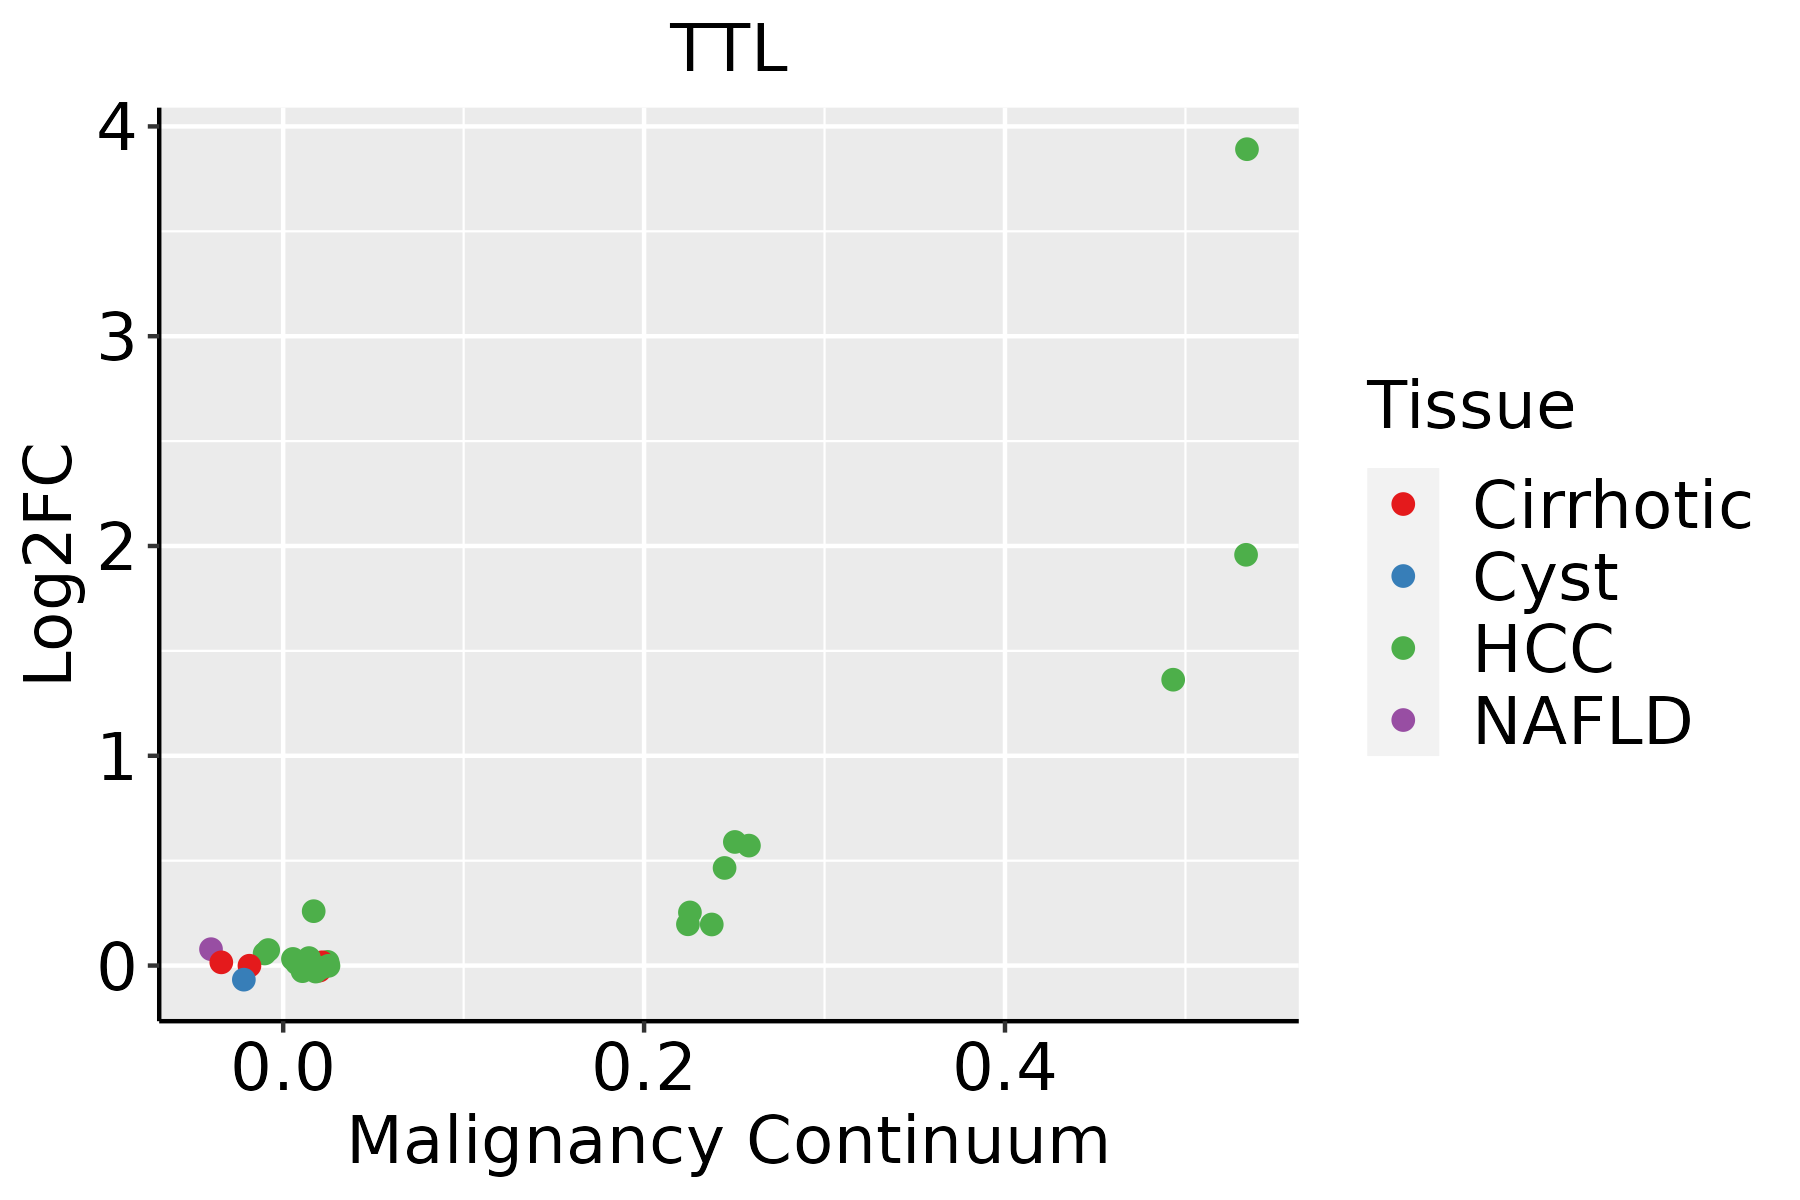 | HCC: Hepatocellular carcinoma |
| NAFLD: Non-alcoholic fatty liver disease | ||
| Oral Cavity | 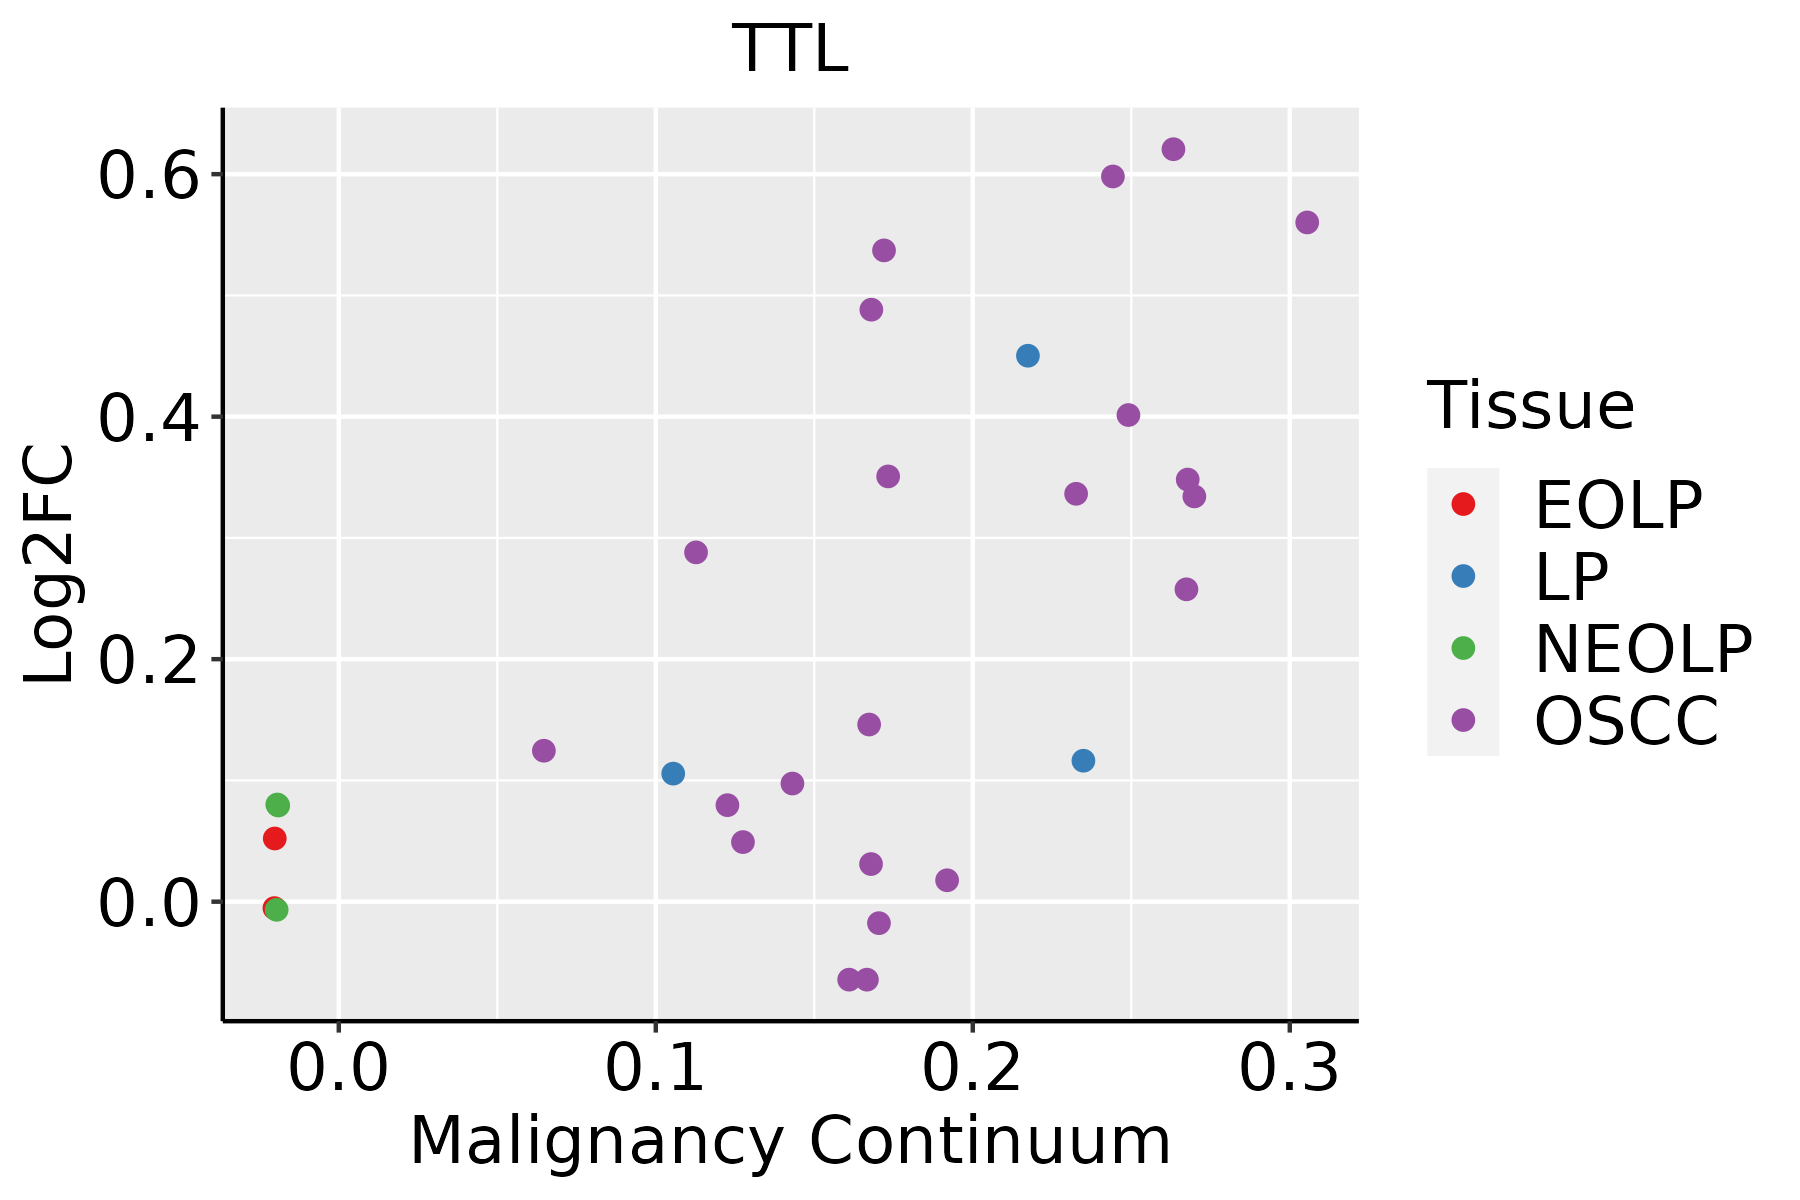 | EOLP: Erosive Oral lichen planus |
| LP: leukoplakia | ||
| NEOLP: Non-erosive oral lichen planus | ||
| OSCC: Oral squamous cell carcinoma | ||
| Thyroid |  | ATC: Anaplastic thyroid cancer |
| HT: Hashimoto's thyroiditis | ||
| PTC: Papillary thyroid cancer |
| ∗log2FC in expression of this searched gene in stem-like cells from each diseased tissue sample relative to stem-like cells in normal samples in each tissue plotted against the malignancy continuum. Samples are colored based on if they are from different disease stage. |
Top |
Malignant transformation related pathway analysis |
| Find out the enriched GO biological processes and KEGG pathways involved in transition from healthy to precancer to cancer |
| Tissue | Disease Stage | Enriched GO biological Processes |
| Colorectum | AD |  |
| Colorectum | SER |  |
| Colorectum | MSS |  |
| Colorectum | MSI-H |  |
| Colorectum | FAP |  |
| ∗Top 15 enriched GO BP terms are showed in the bar plot of each disease state in each tissue. Each row represents a significant GO biological process which is colored according to the -log10(p.adjust). |
| Page: 1 2 3 4 5 6 7 8 9 |
| GO ID | Tissue | Disease Stage | Description | Gene Ratio | Bg Ratio | pvalue | p.adjust | Count |
| GO:0150063 | Cervix | CC | visual system development | 63/2311 | 375/18723 | 6.58e-03 | 3.65e-02 | 63 |
| GO:0001654 | Cervix | CC | eye development | 62/2311 | 371/18723 | 7.83e-03 | 4.13e-02 | 62 |
| GO:0048880 | Cervix | CC | sensory system development | 63/2311 | 381/18723 | 9.29e-03 | 4.66e-02 | 63 |
| GO:0022613 | Colorectum | AD | ribonucleoprotein complex biogenesis | 151/3918 | 463/18723 | 1.96e-09 | 1.39e-07 | 151 |
| GO:0042254 | Colorectum | AD | ribosome biogenesis | 84/3918 | 299/18723 | 1.82e-03 | 1.50e-02 | 84 |
| GO:0034340 | Colorectum | AD | response to type I interferon | 22/3918 | 58/18723 | 2.23e-03 | 1.75e-02 | 22 |
| GO:0060337 | Colorectum | AD | type I interferon signaling pathway | 19/3918 | 50/18723 | 4.23e-03 | 2.91e-02 | 19 |
| GO:0007346 | Colorectum | AD | regulation of mitotic cell cycle | 119/3918 | 457/18723 | 4.60e-03 | 3.14e-02 | 119 |
| GO:0071357 | Colorectum | AD | cellular response to type I interferon | 19/3918 | 52/18723 | 6.92e-03 | 4.26e-02 | 19 |
| GO:00226131 | Colorectum | SER | ribonucleoprotein complex biogenesis | 112/2897 | 463/18723 | 5.01e-07 | 2.48e-05 | 112 |
| GO:00422541 | Colorectum | SER | ribosome biogenesis | 66/2897 | 299/18723 | 1.48e-03 | 1.60e-02 | 66 |
| GO:00343401 | Colorectum | SER | response to type I interferon | 17/2897 | 58/18723 | 5.50e-03 | 4.07e-02 | 17 |
| GO:00226132 | Colorectum | MSS | ribonucleoprotein complex biogenesis | 144/3467 | 463/18723 | 2.76e-11 | 3.67e-09 | 144 |
| GO:00422542 | Colorectum | MSS | ribosome biogenesis | 79/3467 | 299/18723 | 4.32e-04 | 5.23e-03 | 79 |
| GO:00343402 | Colorectum | MSS | response to type I interferon | 20/3467 | 58/18723 | 2.82e-03 | 2.20e-02 | 20 |
| GO:00073461 | Colorectum | MSS | regulation of mitotic cell cycle | 108/3467 | 457/18723 | 3.30e-03 | 2.50e-02 | 108 |
| GO:0006364 | Colorectum | MSS | rRNA processing | 58/3467 | 225/18723 | 4.17e-03 | 3.03e-02 | 58 |
| GO:0016072 | Colorectum | MSS | rRNA metabolic process | 60/3467 | 236/18723 | 5.01e-03 | 3.46e-02 | 60 |
| GO:00226134 | Colorectum | FAP | ribonucleoprotein complex biogenesis | 91/2622 | 463/18723 | 4.28e-04 | 5.12e-03 | 91 |
| GO:00226135 | Colorectum | CRC | ribonucleoprotein complex biogenesis | 76/2078 | 463/18723 | 3.04e-04 | 4.78e-03 | 76 |
| Page: 1 2 3 4 5 6 7 8 9 10 11 12 13 14 15 16 17 18 19 20 21 22 23 24 25 26 27 28 29 30 31 32 33 34 35 36 37 38 39 |
| Pathway ID | Tissue | Disease Stage | Description | Gene Ratio | Bg Ratio | pvalue | p.adjust | qvalue | Count |
| Page: 1 |
Top |
Cell-cell communication analysis |
| Identification of potential cell-cell interactions between two cell types and their ligand-receptor pairs for different disease states |
| Ligand | Receptor | LRpair | Pathway | Tissue | Disease Stage |
| Page: 1 |
Top |
Single-cell gene regulatory network inference analysis |
| Find out the significant the regulons (TFs) and the target genes of each regulon across cell types for different disease states |
| TF | Cell Type | Tissue | Disease Stage | Target Gene | RSS | Regulon Activity |
| ∗The dot plots of a searched regulon are shown for all cell subpopulations in each disease state of each tissue based on the regulon specific score inferred using pySCENIC and by calculating the average expression. |
| Page: 1 |
Top |
Somatic mutation of malignant transformation related genes |
| Annotation of somatic variants for genes involved in malignant transformation |
| Hugo Symbol | Variant Class | Variant Classification | dbSNP RS | HGVSc | HGVSp | HGVSp Short | SWISSPROT | BIOTYPE | SIFT | PolyPhen | Tumor Sample Barcode | Tissue | Histology | Sex | Age | Stage | Therapy Types | Drugs | Outcome |
| TTL | SNV | Missense_Mutation | c.971N>G | p.Glu324Gly | p.E324G | Q8NG68 | protein_coding | tolerated(0.16) | benign(0.026) | TCGA-B6-A0IC-01 | Breast | breast invasive carcinoma | Female | >=65 | I/II | Unknown | Unknown | SD | |
| TTL | SNV | Missense_Mutation | novel | c.131G>T | p.Arg44Met | p.R44M | Q8NG68 | protein_coding | deleterious(0) | probably_damaging(0.909) | TCGA-2W-A8YY-01 | Cervix | cervical & endocervical cancer | Female | <65 | I/II | Chemotherapy | cisplatin | CR |
| TTL | SNV | Missense_Mutation | novel | c.968A>G | p.Glu323Gly | p.E323G | Q8NG68 | protein_coding | deleterious(0.04) | benign(0.093) | TCGA-2W-A8YY-01 | Cervix | cervical & endocervical cancer | Female | <65 | I/II | Chemotherapy | cisplatin | CR |
| TTL | SNV | Missense_Mutation | rs746535633 | c.279N>T | p.Trp93Cys | p.W93C | Q8NG68 | protein_coding | deleterious(0) | probably_damaging(0.989) | TCGA-DG-A2KK-01 | Cervix | cervical & endocervical cancer | Female | <65 | III/IV | Chemotherapy | cisplatin | SD |
| TTL | SNV | Missense_Mutation | c.217N>T | p.Arg73Cys | p.R73C | Q8NG68 | protein_coding | deleterious(0) | probably_damaging(0.965) | TCGA-WS-AB45-01 | Colorectum | colon adenocarcinoma | Female | <65 | I/II | Unknown | Unknown | SD | |
| TTL | SNV | Missense_Mutation | c.414G>T | p.Lys138Asn | p.K138N | Q8NG68 | protein_coding | tolerated(0.13) | benign(0.163) | TCGA-AG-3892-01 | Colorectum | rectum adenocarcinoma | Female | <65 | I/II | Unknown | Unknown | SD | |
| TTL | SNV | Missense_Mutation | novel | c.661N>A | p.Leu221Ile | p.L221I | Q8NG68 | protein_coding | deleterious(0.03) | possibly_damaging(0.883) | TCGA-F5-6814-01 | Colorectum | rectum adenocarcinoma | Male | <65 | I/II | Unknown | Unknown | SD |
| TTL | SNV | Missense_Mutation | c.170N>T | p.Gly57Val | p.G57V | Q8NG68 | protein_coding | deleterious(0) | probably_damaging(0.999) | TCGA-AP-A051-01 | Endometrium | uterine corpus endometrioid carcinoma | Female | >=65 | I/II | Unknown | Unknown | SD | |
| TTL | SNV | Missense_Mutation | c.679C>A | p.Pro227Thr | p.P227T | Q8NG68 | protein_coding | deleterious(0.02) | possibly_damaging(0.575) | TCGA-AP-A059-01 | Endometrium | uterine corpus endometrioid carcinoma | Female | >=65 | I/II | Unknown | Unknown | SD | |
| TTL | SNV | Missense_Mutation | rs780073175 | c.218N>A | p.Arg73His | p.R73H | Q8NG68 | protein_coding | deleterious(0.02) | probably_damaging(0.925) | TCGA-AP-A1DV-01 | Endometrium | uterine corpus endometrioid carcinoma | Female | <65 | I/II | Unknown | Unknown | SD |
| Page: 1 2 3 |
Top |
Related drugs of malignant transformation related genes |
| Identification of chemicals and drugs interact with genes involved in malignant transfromation |
| (DGIdb 4.0) |
| Entrez ID | Symbol | Category | Interaction Types | Drug Claim Name | Drug Name | PMIDs |
| Page: 1 |

Copyright 2023-Present -The University of Texas Health Science Center at Houston |