
|
|||||
|
 | |
| |
| |
| |
| |
| |
|
Gene: TTI1 |
Gene summary for TTI1 |
| Gene information | Species | Human | Gene symbol | TTI1 | Gene ID | 9675 |
| Gene name | TELO2 interacting protein 1 | |
| Gene Alias | KIAA0406 | |
| Cytomap | 20q11.23 | |
| Gene Type | protein-coding | GO ID | GO:0006325 | UniProtAcc | O43156 |
Top |
Malignant transformation analysis |
| Identification of the aberrant gene expression in precancerous and cancerous lesions by comparing the gene expression of stem-like cells in diseased tissues with normal stem cells |
| Entrez ID | Symbol | Replicates | Species | Organ | Tissue | Adj P-value | Log2FC | Malignancy |
| 9675 | TTI1 | LZE7T | Human | Esophagus | ESCC | 4.54e-09 | 3.40e-01 | 0.0667 |
| 9675 | TTI1 | LZE24T | Human | Esophagus | ESCC | 1.17e-16 | 3.40e-01 | 0.0596 |
| 9675 | TTI1 | P2T-E | Human | Esophagus | ESCC | 8.50e-16 | 2.25e-01 | 0.1177 |
| 9675 | TTI1 | P4T-E | Human | Esophagus | ESCC | 1.19e-05 | 1.82e-01 | 0.1323 |
| 9675 | TTI1 | P5T-E | Human | Esophagus | ESCC | 1.24e-06 | 9.94e-02 | 0.1327 |
| 9675 | TTI1 | P8T-E | Human | Esophagus | ESCC | 3.31e-09 | 2.62e-01 | 0.0889 |
| 9675 | TTI1 | P9T-E | Human | Esophagus | ESCC | 1.02e-03 | 5.26e-02 | 0.1131 |
| 9675 | TTI1 | P10T-E | Human | Esophagus | ESCC | 2.54e-11 | 2.63e-01 | 0.116 |
| 9675 | TTI1 | P11T-E | Human | Esophagus | ESCC | 2.53e-06 | 2.53e-01 | 0.1426 |
| 9675 | TTI1 | P12T-E | Human | Esophagus | ESCC | 7.68e-14 | 2.77e-01 | 0.1122 |
| 9675 | TTI1 | P15T-E | Human | Esophagus | ESCC | 3.70e-13 | 2.25e-01 | 0.1149 |
| 9675 | TTI1 | P16T-E | Human | Esophagus | ESCC | 2.54e-12 | 2.91e-01 | 0.1153 |
| 9675 | TTI1 | P17T-E | Human | Esophagus | ESCC | 2.13e-08 | 3.02e-01 | 0.1278 |
| 9675 | TTI1 | P20T-E | Human | Esophagus | ESCC | 3.38e-11 | 2.69e-01 | 0.1124 |
| 9675 | TTI1 | P21T-E | Human | Esophagus | ESCC | 6.58e-22 | 3.84e-01 | 0.1617 |
| 9675 | TTI1 | P22T-E | Human | Esophagus | ESCC | 1.46e-05 | 1.13e-01 | 0.1236 |
| 9675 | TTI1 | P23T-E | Human | Esophagus | ESCC | 1.43e-11 | 2.43e-01 | 0.108 |
| 9675 | TTI1 | P24T-E | Human | Esophagus | ESCC | 5.52e-07 | 2.18e-01 | 0.1287 |
| 9675 | TTI1 | P26T-E | Human | Esophagus | ESCC | 2.61e-17 | 3.87e-01 | 0.1276 |
| 9675 | TTI1 | P27T-E | Human | Esophagus | ESCC | 1.05e-09 | 1.16e-01 | 0.1055 |
| Page: 1 2 3 |
| Tissue | Expression Dynamics | Abbreviation |
| Esophagus | 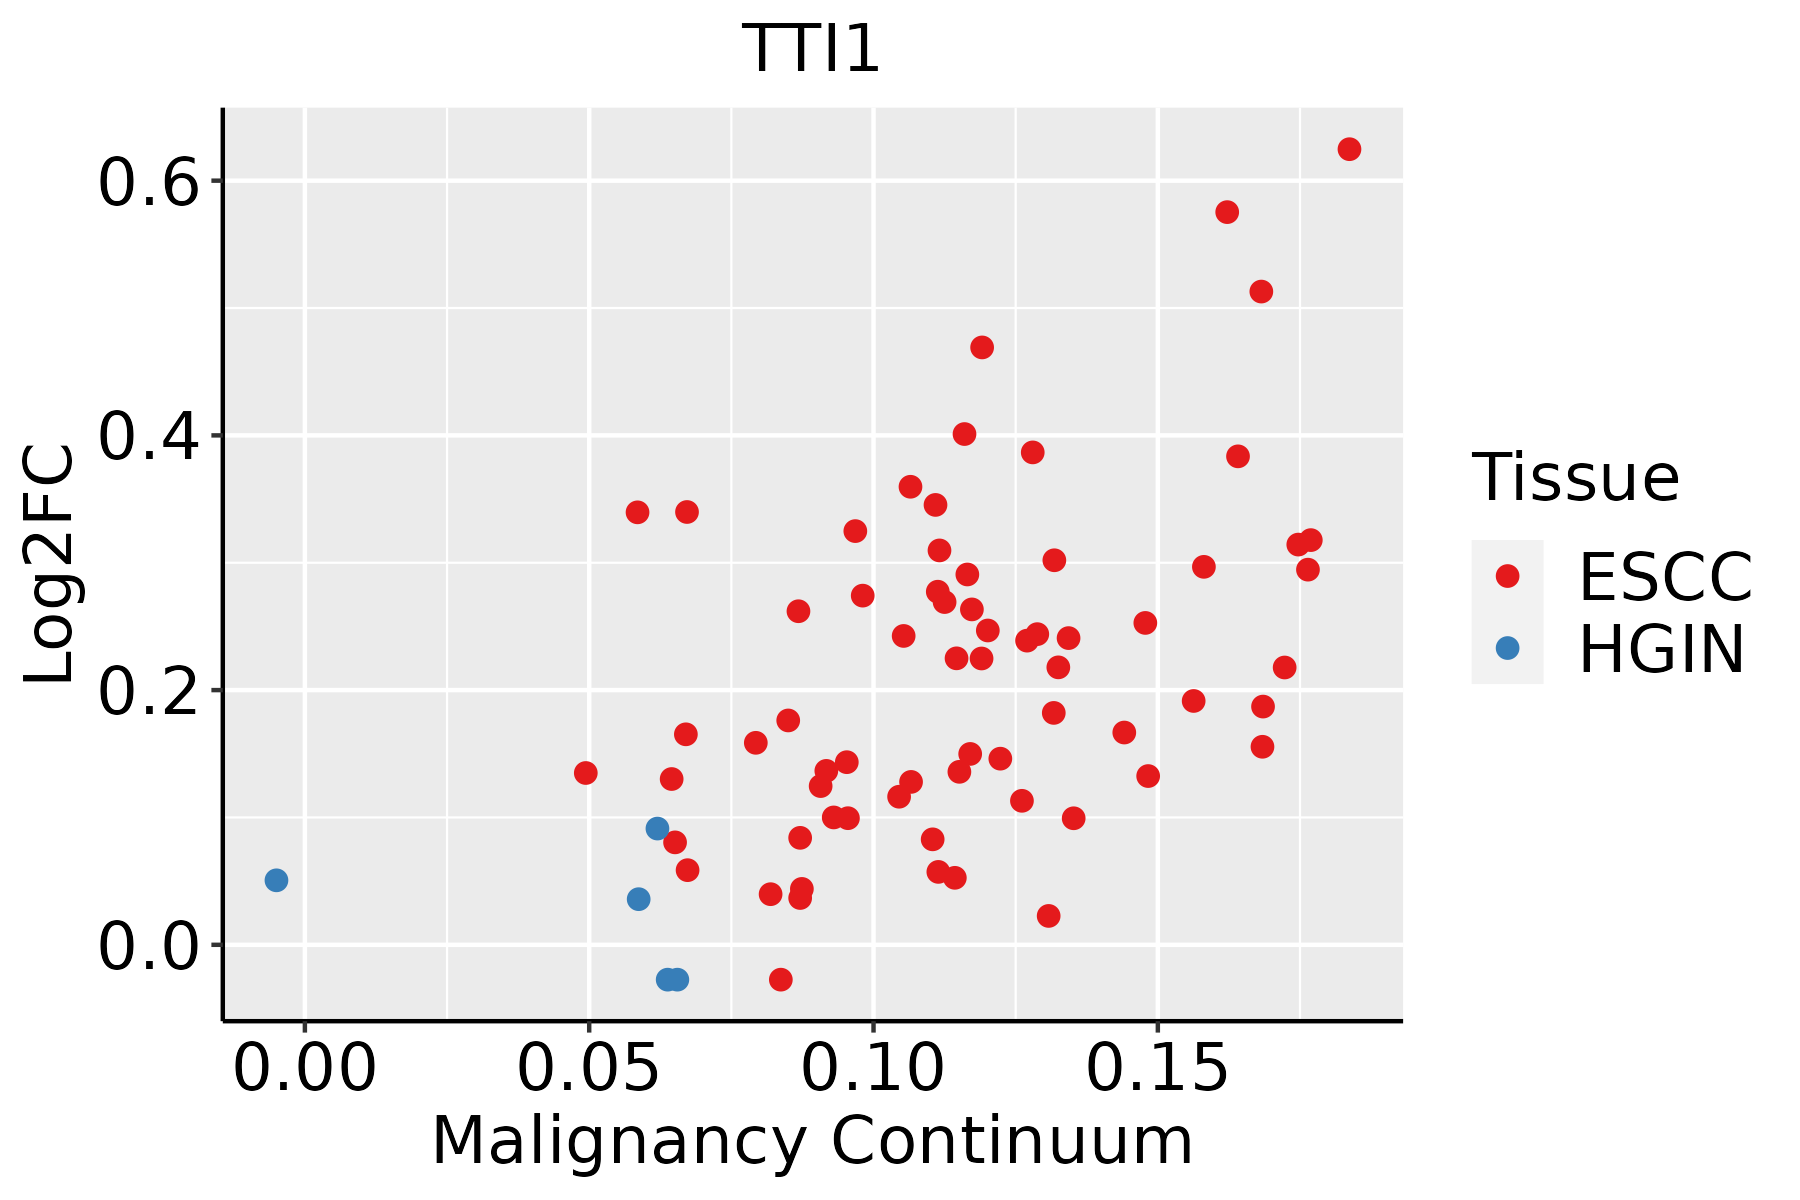 | ESCC: Esophageal squamous cell carcinoma |
| HGIN: High-grade intraepithelial neoplasias | ||
| LGIN: Low-grade intraepithelial neoplasias |
| ∗log2FC in expression of this searched gene in stem-like cells from each diseased tissue sample relative to stem-like cells in normal samples in each tissue plotted against the malignancy continuum. Samples are colored based on if they are from different disease stage. |
Top |
Malignant transformation related pathway analysis |
| Find out the enriched GO biological processes and KEGG pathways involved in transition from healthy to precancer to cancer |
| Tissue | Disease Stage | Enriched GO biological Processes |
| Colorectum | AD |  |
| Colorectum | SER |  |
| Colorectum | MSS |  |
| Colorectum | MSI-H |  |
| Colorectum | FAP |  |
| ∗Top 15 enriched GO BP terms are showed in the bar plot of each disease state in each tissue. Each row represents a significant GO biological process which is colored according to the -log10(p.adjust). |
| Page: 1 2 3 4 5 6 7 8 9 |
| GO ID | Tissue | Disease Stage | Description | Gene Ratio | Bg Ratio | pvalue | p.adjust | Count |
| GO:000632517 | Esophagus | ESCC | chromatin organization | 240/8552 | 409/18723 | 6.52e-08 | 1.14e-06 | 240 |
| GO:00319294 | Esophagus | ESCC | TOR signaling | 79/8552 | 126/18723 | 8.57e-05 | 6.21e-04 | 79 |
| GO:00320061 | Esophagus | ESCC | regulation of TOR signaling | 63/8552 | 104/18723 | 1.55e-03 | 7.29e-03 | 63 |
| Page: 1 |
| Pathway ID | Tissue | Disease Stage | Description | Gene Ratio | Bg Ratio | pvalue | p.adjust | qvalue | Count |
| hsa041505 | Esophagus | ESCC | mTOR signaling pathway | 98/4205 | 156/8465 | 5.81e-04 | 1.95e-03 | 9.97e-04 | 98 |
| hsa0415013 | Esophagus | ESCC | mTOR signaling pathway | 98/4205 | 156/8465 | 5.81e-04 | 1.95e-03 | 9.97e-04 | 98 |
| Page: 1 |
Top |
Cell-cell communication analysis |
| Identification of potential cell-cell interactions between two cell types and their ligand-receptor pairs for different disease states |
| Ligand | Receptor | LRpair | Pathway | Tissue | Disease Stage |
| Page: 1 |
Top |
Single-cell gene regulatory network inference analysis |
| Find out the significant the regulons (TFs) and the target genes of each regulon across cell types for different disease states |
| TF | Cell Type | Tissue | Disease Stage | Target Gene | RSS | Regulon Activity |
| ∗The dot plots of a searched regulon are shown for all cell subpopulations in each disease state of each tissue based on the regulon specific score inferred using pySCENIC and by calculating the average expression. |
| Page: 1 |
Top |
Somatic mutation of malignant transformation related genes |
| Annotation of somatic variants for genes involved in malignant transformation |
| Hugo Symbol | Variant Class | Variant Classification | dbSNP RS | HGVSc | HGVSp | HGVSp Short | SWISSPROT | BIOTYPE | SIFT | PolyPhen | Tumor Sample Barcode | Tissue | Histology | Sex | Age | Stage | Therapy Types | Drugs | Outcome |
| TTI1 | SNV | Missense_Mutation | c.783N>T | p.Lys261Asn | p.K261N | O43156 | protein_coding | tolerated(0.16) | benign(0.107) | TCGA-BH-A1EO-01 | Breast | breast invasive carcinoma | Female | >=65 | I/II | Unknown | Unknown | SD | |
| TTI1 | SNV | Missense_Mutation | c.2408C>T | p.Thr803Ile | p.T803I | O43156 | protein_coding | tolerated(0.1) | benign(0) | TCGA-D8-A145-01 | Breast | breast invasive carcinoma | Female | >=65 | I/II | Hormone Therapy | tamoxiphen | SD | |
| TTI1 | SNV | Missense_Mutation | rs139243887 | c.2902N>A | p.Ala968Thr | p.A968T | O43156 | protein_coding | tolerated(0.06) | benign(0.056) | TCGA-D8-A1JN-01 | Breast | breast invasive carcinoma | Female | >=65 | III/IV | Hormone Therapy | anastrozolum | SD |
| TTI1 | insertion | Frame_Shift_Ins | novel | c.1093_1094insCACC | p.Val365AlafsTer9 | p.V365Afs*9 | O43156 | protein_coding | TCGA-A8-A09D-01 | Breast | breast invasive carcinoma | Female | <65 | I/II | Chemotherapy | doxorubicin | CR | ||
| TTI1 | insertion | Nonsense_Mutation | novel | c.1092_1093insAGGAAATGGGAGAGGAGCTGATGATGGA | p.Val365ArgfsTer7 | p.V365Rfs*7 | O43156 | protein_coding | TCGA-A8-A09D-01 | Breast | breast invasive carcinoma | Female | <65 | I/II | Chemotherapy | doxorubicin | CR | ||
| TTI1 | insertion | Nonsense_Mutation | novel | c.1850_1851insGTAGCTAG | p.Ile617MetfsTer2 | p.I617Mfs*2 | O43156 | protein_coding | TCGA-A8-A09M-01 | Breast | breast invasive carcinoma | Female | >=65 | III/IV | Chemotherapy | paclitaxel | CR | ||
| TTI1 | insertion | In_Frame_Ins | novel | c.1848_1849insGAATTCTATATTTTACTTAATTTTAATAGCCAC | p.Thr616_Ile617insGluPheTyrIleLeuLeuAsnPheAsnSerHis | p.T616_I617insEFYILLNFNSH | O43156 | protein_coding | TCGA-A8-A09M-01 | Breast | breast invasive carcinoma | Female | >=65 | III/IV | Chemotherapy | paclitaxel | CR | ||
| TTI1 | insertion | In_Frame_Ins | novel | c.2133_2134insATT | p.Leu711_His712insIle | p.L711_H712insI | O43156 | protein_coding | TCGA-B6-A0I5-01 | Breast | breast invasive carcinoma | Female | <65 | I/II | Unknown | Unknown | SD | ||
| TTI1 | insertion | Frame_Shift_Ins | novel | c.2132_2133insTTTCACTCCTCTCCTTAAGCAGAAGAAAG | p.His712PhefsTer62 | p.H712Ffs*62 | O43156 | protein_coding | TCGA-B6-A0I5-01 | Breast | breast invasive carcinoma | Female | <65 | I/II | Unknown | Unknown | SD | ||
| TTI1 | insertion | Frame_Shift_Ins | novel | c.820_821insCCAAAGCACTC | p.Tyr274SerfsTer11 | p.Y274Sfs*11 | O43156 | protein_coding | TCGA-B6-A0RE-01 | Breast | breast invasive carcinoma | Female | <65 | I/II | Unknown | Unknown | SD |
| Page: 1 2 3 4 5 6 7 8 9 10 11 12 |
Top |
Related drugs of malignant transformation related genes |
| Identification of chemicals and drugs interact with genes involved in malignant transfromation |
| (DGIdb 4.0) |
| Entrez ID | Symbol | Category | Interaction Types | Drug Claim Name | Drug Name | PMIDs |
| Page: 1 |

Copyright 2023-Present -The University of Texas Health Science Center at Houston |