
|
|||||
|
 | |
| |
| |
| |
| |
| |
|
Gene: TTF1 |
Gene summary for TTF1 |
| Gene information | Species | Human | Gene symbol | TTF1 | Gene ID | 7270 |
| Gene name | transcription termination factor 1 | |
| Gene Alias | TTF-1 | |
| Cytomap | 9q34.13 | |
| Gene Type | protein-coding | GO ID | GO:0006139 | UniProtAcc | A0A087WY09 |
Top |
Malignant transformation analysis |
| Identification of the aberrant gene expression in precancerous and cancerous lesions by comparing the gene expression of stem-like cells in diseased tissues with normal stem cells |
| Entrez ID | Symbol | Replicates | Species | Organ | Tissue | Adj P-value | Log2FC | Malignancy |
| 7270 | TTF1 | LZE4T | Human | Esophagus | ESCC | 1.24e-09 | 3.21e-01 | 0.0811 |
| 7270 | TTF1 | LZE7T | Human | Esophagus | ESCC | 2.12e-15 | 4.61e-01 | 0.0667 |
| 7270 | TTF1 | LZE20T | Human | Esophagus | ESCC | 1.25e-13 | 3.49e-01 | 0.0662 |
| 7270 | TTF1 | LZE24T | Human | Esophagus | ESCC | 5.78e-13 | 1.86e-01 | 0.0596 |
| 7270 | TTF1 | LZE21T | Human | Esophagus | ESCC | 7.06e-03 | 2.62e-01 | 0.0655 |
| 7270 | TTF1 | LZE6T | Human | Esophagus | ESCC | 3.20e-03 | 9.62e-02 | 0.0845 |
| 7270 | TTF1 | P1T-E | Human | Esophagus | ESCC | 3.41e-12 | 3.72e-01 | 0.0875 |
| 7270 | TTF1 | P2T-E | Human | Esophagus | ESCC | 8.04e-25 | 3.54e-01 | 0.1177 |
| 7270 | TTF1 | P4T-E | Human | Esophagus | ESCC | 1.01e-16 | 3.44e-01 | 0.1323 |
| 7270 | TTF1 | P5T-E | Human | Esophagus | ESCC | 6.11e-19 | 3.19e-01 | 0.1327 |
| 7270 | TTF1 | P8T-E | Human | Esophagus | ESCC | 1.37e-29 | 5.01e-01 | 0.0889 |
| 7270 | TTF1 | P9T-E | Human | Esophagus | ESCC | 7.66e-13 | 2.37e-01 | 0.1131 |
| 7270 | TTF1 | P10T-E | Human | Esophagus | ESCC | 1.11e-17 | 3.22e-01 | 0.116 |
| 7270 | TTF1 | P11T-E | Human | Esophagus | ESCC | 3.94e-13 | 3.68e-01 | 0.1426 |
| 7270 | TTF1 | P12T-E | Human | Esophagus | ESCC | 8.45e-15 | 2.06e-01 | 0.1122 |
| 7270 | TTF1 | P15T-E | Human | Esophagus | ESCC | 3.39e-17 | 3.22e-01 | 0.1149 |
| 7270 | TTF1 | P16T-E | Human | Esophagus | ESCC | 1.00e-17 | 1.92e-01 | 0.1153 |
| 7270 | TTF1 | P17T-E | Human | Esophagus | ESCC | 1.29e-07 | 1.63e-01 | 0.1278 |
| 7270 | TTF1 | P20T-E | Human | Esophagus | ESCC | 4.66e-17 | 1.85e-01 | 0.1124 |
| 7270 | TTF1 | P21T-E | Human | Esophagus | ESCC | 2.36e-23 | 3.94e-01 | 0.1617 |
| Page: 1 2 3 4 5 |
| Tissue | Expression Dynamics | Abbreviation |
| Esophagus |  | ESCC: Esophageal squamous cell carcinoma |
| HGIN: High-grade intraepithelial neoplasias | ||
| LGIN: Low-grade intraepithelial neoplasias | ||
| Oral Cavity |  | EOLP: Erosive Oral lichen planus |
| LP: leukoplakia | ||
| NEOLP: Non-erosive oral lichen planus | ||
| OSCC: Oral squamous cell carcinoma | ||
| Skin | 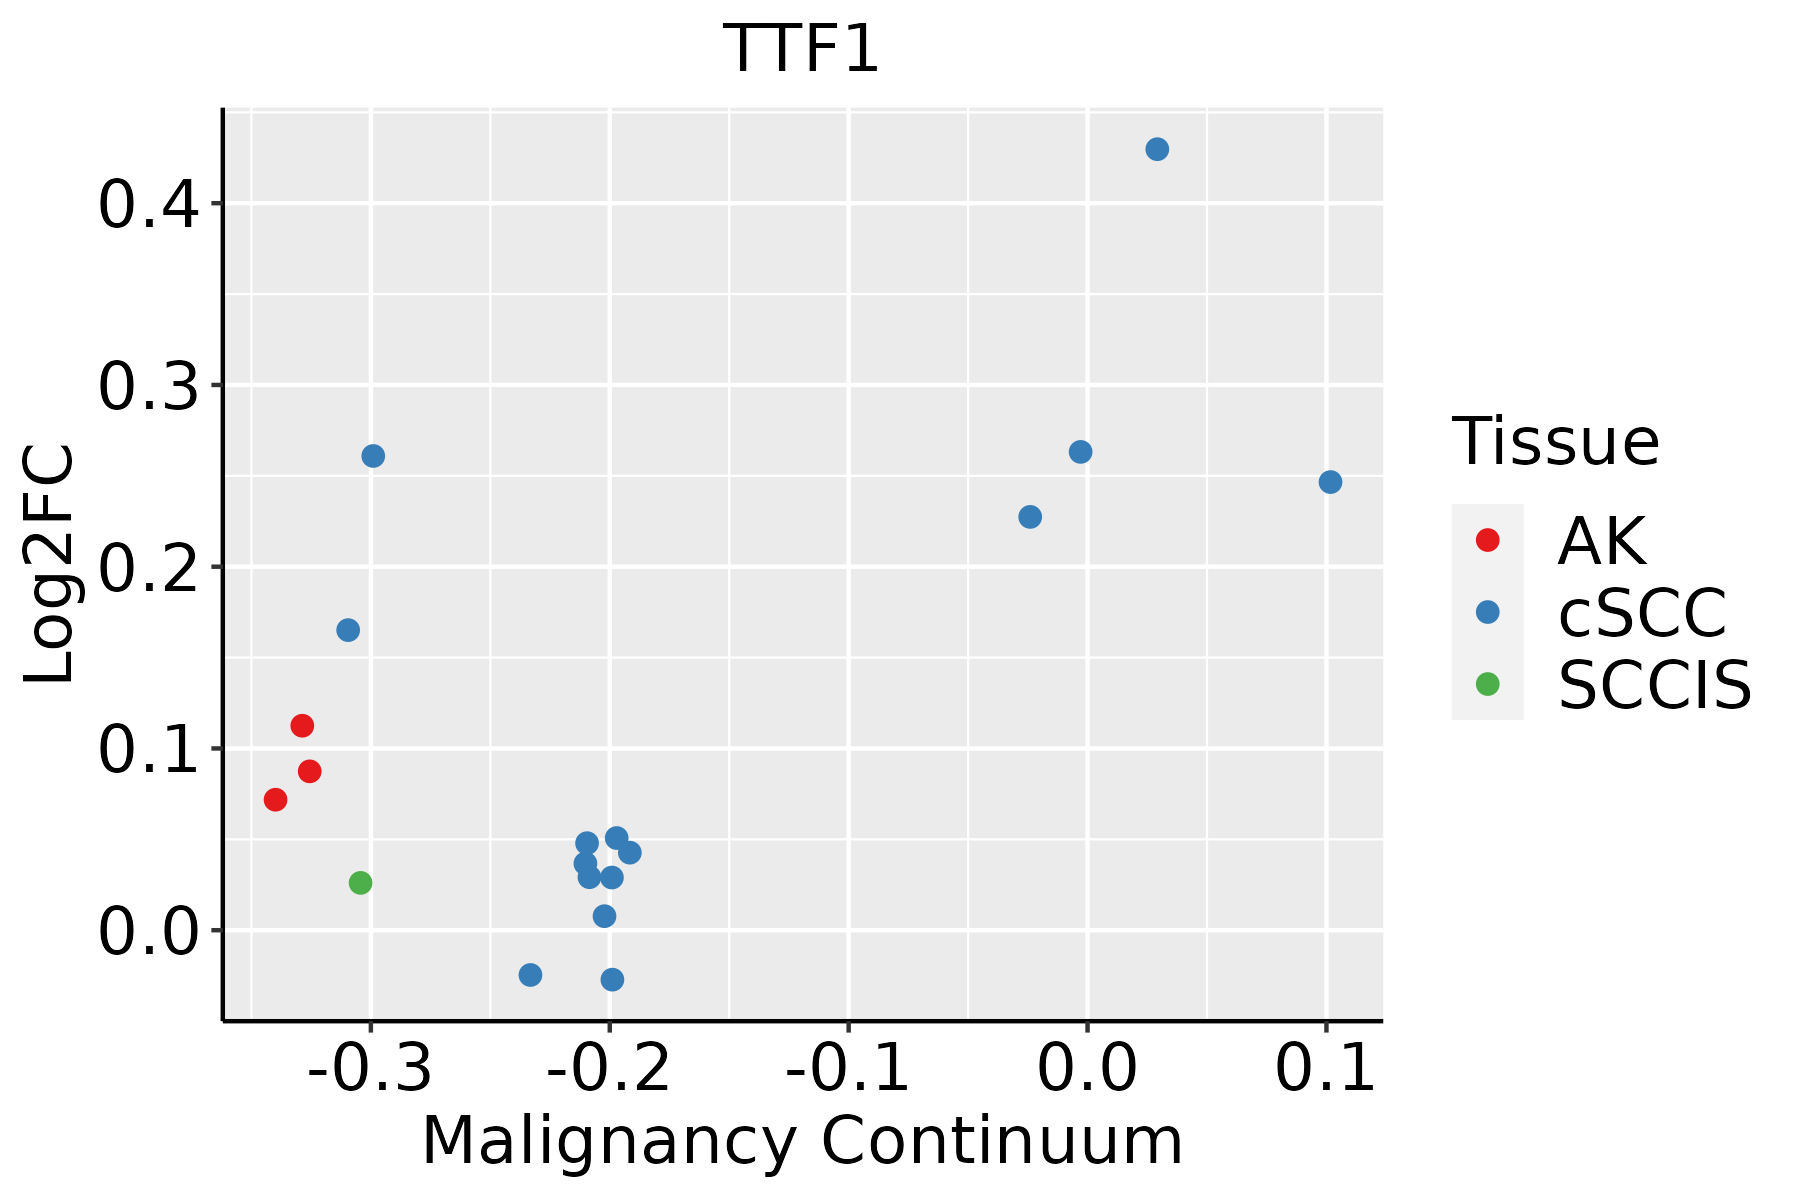 | AK: Actinic keratosis |
| cSCC: Cutaneous squamous cell carcinoma | ||
| SCCIS:squamous cell carcinoma in situ | ||
| Thyroid | 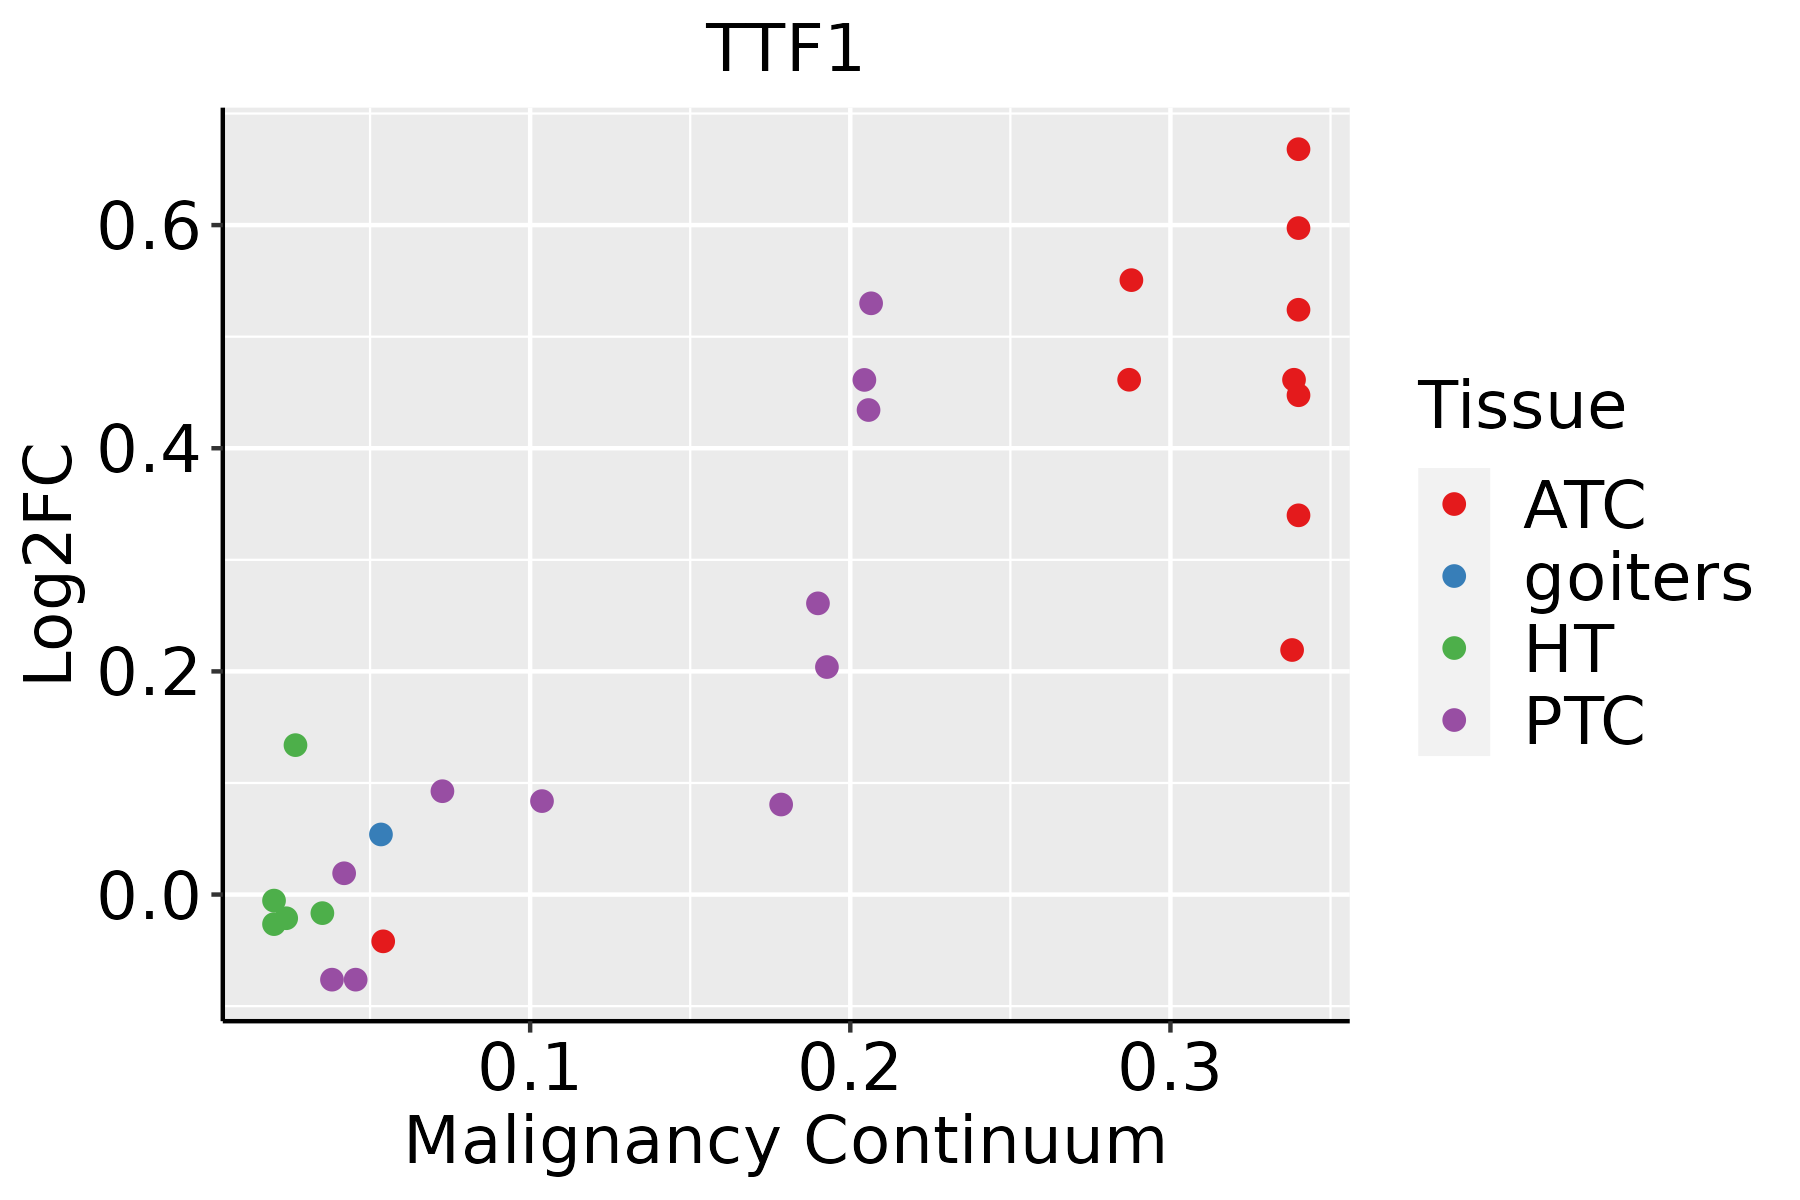 | ATC: Anaplastic thyroid cancer |
| HT: Hashimoto's thyroiditis | ||
| PTC: Papillary thyroid cancer |
| ∗log2FC in expression of this searched gene in stem-like cells from each diseased tissue sample relative to stem-like cells in normal samples in each tissue plotted against the malignancy continuum. Samples are colored based on if they are from different disease stage. |
Top |
Malignant transformation related pathway analysis |
| Find out the enriched GO biological processes and KEGG pathways involved in transition from healthy to precancer to cancer |
| Tissue | Disease Stage | Enriched GO biological Processes |
| Colorectum | AD |  |
| Colorectum | SER |  |
| Colorectum | MSS |  |
| Colorectum | MSI-H |  |
| Colorectum | FAP |  |
| ∗Top 15 enriched GO BP terms are showed in the bar plot of each disease state in each tissue. Each row represents a significant GO biological process which is colored according to the -log10(p.adjust). |
| Page: 1 2 3 4 5 6 7 8 9 |
| GO ID | Tissue | Disease Stage | Description | Gene Ratio | Bg Ratio | pvalue | p.adjust | Count |
| GO:00062604 | Esophagus | ESCC | DNA replication | 181/8552 | 260/18723 | 3.55e-15 | 2.05e-13 | 181 |
| GO:00062754 | Esophagus | ESCC | regulation of DNA replication | 73/8552 | 107/18723 | 1.97e-06 | 2.28e-05 | 73 |
| GO:00063602 | Esophagus | ESCC | transcription by RNA polymerase I | 42/8552 | 55/18723 | 3.41e-06 | 3.78e-05 | 42 |
| GO:00063532 | Esophagus | ESCC | DNA-templated transcription, termination | 15/8552 | 21/18723 | 1.54e-02 | 4.96e-02 | 15 |
| GO:00062603 | Oral cavity | OSCC | DNA replication | 159/7305 | 260/18723 | 3.25e-13 | 1.59e-11 | 159 |
| GO:00062753 | Oral cavity | OSCC | regulation of DNA replication | 62/7305 | 107/18723 | 5.49e-05 | 4.54e-04 | 62 |
| GO:00063601 | Oral cavity | OSCC | transcription by RNA polymerase I | 36/7305 | 55/18723 | 6.42e-05 | 5.22e-04 | 36 |
| GO:000626012 | Skin | cSCC | DNA replication | 106/4864 | 260/18723 | 1.18e-07 | 2.77e-06 | 106 |
| GO:00063603 | Skin | cSCC | transcription by RNA polymerase I | 30/4864 | 55/18723 | 6.13e-06 | 8.70e-05 | 30 |
| GO:00062755 | Skin | cSCC | regulation of DNA replication | 44/4864 | 107/18723 | 4.41e-04 | 3.39e-03 | 44 |
| GO:00063533 | Skin | cSCC | DNA-templated transcription, termination | 12/4864 | 21/18723 | 2.40e-03 | 1.38e-02 | 12 |
| GO:00062606 | Thyroid | PTC | DNA replication | 114/5968 | 260/18723 | 3.09e-05 | 2.95e-04 | 114 |
| GO:00063604 | Thyroid | PTC | transcription by RNA polymerase I | 28/5968 | 55/18723 | 2.55e-03 | 1.31e-02 | 28 |
| GO:000626013 | Thyroid | ATC | DNA replication | 124/6293 | 260/18723 | 1.58e-06 | 1.93e-05 | 124 |
| GO:00062756 | Thyroid | ATC | regulation of DNA replication | 50/6293 | 107/18723 | 3.25e-03 | 1.46e-02 | 50 |
| GO:000636011 | Thyroid | ATC | transcription by RNA polymerase I | 28/6293 | 55/18723 | 5.94e-03 | 2.39e-02 | 28 |
| Page: 1 |
| Pathway ID | Tissue | Disease Stage | Description | Gene Ratio | Bg Ratio | pvalue | p.adjust | qvalue | Count |
| Page: 1 |
Top |
Cell-cell communication analysis |
| Identification of potential cell-cell interactions between two cell types and their ligand-receptor pairs for different disease states |
| Ligand | Receptor | LRpair | Pathway | Tissue | Disease Stage |
| Page: 1 |
Top |
Single-cell gene regulatory network inference analysis |
| Find out the significant the regulons (TFs) and the target genes of each regulon across cell types for different disease states |
| TF | Cell Type | Tissue | Disease Stage | Target Gene | RSS | Regulon Activity |
| ∗The dot plots of a searched regulon are shown for all cell subpopulations in each disease state of each tissue based on the regulon specific score inferred using pySCENIC and by calculating the average expression. |
| Page: 1 |
Top |
Somatic mutation of malignant transformation related genes |
| Annotation of somatic variants for genes involved in malignant transformation |
| Hugo Symbol | Variant Class | Variant Classification | dbSNP RS | HGVSc | HGVSp | HGVSp Short | SWISSPROT | BIOTYPE | SIFT | PolyPhen | Tumor Sample Barcode | Tissue | Histology | Sex | Age | Stage | Therapy Types | Drugs | Outcome |
| TTF1 | SNV | Missense_Mutation | c.1258N>C | p.Asp420His | p.D420H | Q15361 | protein_coding | deleterious(0.04) | benign(0.046) | TCGA-AC-A23H-01 | Breast | breast invasive carcinoma | Female | >=65 | I/II | Unknown | Unknown | PD | |
| TTF1 | SNV | Missense_Mutation | novel | c.627N>C | p.Glu209Asp | p.E209D | Q15361 | protein_coding | tolerated(0.1) | benign(0.031) | TCGA-D8-A1XK-01 | Breast | breast invasive carcinoma | Female | <65 | I/II | Chemotherapy | doxorubicine+cyclophosphamide | SD |
| TTF1 | SNV | Missense_Mutation | rs763134689 | c.1279N>A | p.Ala427Thr | p.A427T | Q15361 | protein_coding | tolerated(1) | benign(0) | TCGA-2W-A8YY-01 | Cervix | cervical & endocervical cancer | Female | <65 | I/II | Chemotherapy | cisplatin | CR |
| TTF1 | SNV | Missense_Mutation | c.2064G>T | p.Lys688Asn | p.K688N | Q15361 | protein_coding | deleterious(0) | possibly_damaging(0.838) | TCGA-Q1-A73O-01 | Cervix | cervical & endocervical cancer | Female | <65 | I/II | Chemotherapy | cisplatin | CR | |
| TTF1 | SNV | Missense_Mutation | novel | c.731N>T | p.Arg244Ile | p.R244I | Q15361 | protein_coding | tolerated_low_confidence(0.15) | benign(0) | TCGA-VS-A8EL-01 | Cervix | cervical & endocervical cancer | Female | <65 | I/II | Chemotherapy | cisplatin | CR |
| TTF1 | SNV | Missense_Mutation | c.2647G>T | p.Gly883Cys | p.G883C | Q15361 | protein_coding | deleterious_low_confidence(0.03) | possibly_damaging(0.809) | TCGA-A6-2686-01 | Colorectum | colon adenocarcinoma | Female | >=65 | I/II | Unknown | Unknown | SD | |
| TTF1 | SNV | Missense_Mutation | rs200157893 | c.1313G>A | p.Arg438Gln | p.R438Q | Q15361 | protein_coding | tolerated(0.71) | benign(0) | TCGA-A6-2686-01 | Colorectum | colon adenocarcinoma | Female | >=65 | I/II | Unknown | Unknown | SD |
| TTF1 | SNV | Missense_Mutation | c.914N>T | p.Ala305Val | p.A305V | Q15361 | protein_coding | tolerated_low_confidence(0.18) | benign(0) | TCGA-A6-5661-01 | Colorectum | colon adenocarcinoma | Female | >=65 | I/II | Unknown | Unknown | SD | |
| TTF1 | SNV | Missense_Mutation | rs199931383 | c.1996N>T | p.Arg666Cys | p.R666C | Q15361 | protein_coding | deleterious(0.01) | probably_damaging(0.971) | TCGA-A6-6141-01 | Colorectum | colon adenocarcinoma | Male | <65 | I/II | Chemotherapy | 5-fu | SD |
| TTF1 | SNV | Missense_Mutation | c.1158N>T | p.Lys386Asn | p.K386N | Q15361 | protein_coding | deleterious(0) | benign(0.18) | TCGA-AA-3510-01 | Colorectum | colon adenocarcinoma | Male | >=65 | I/II | Unknown | Unknown | SD |
| Page: 1 2 3 4 5 6 7 8 9 10 11 |
Top |
Related drugs of malignant transformation related genes |
| Identification of chemicals and drugs interact with genes involved in malignant transfromation |
| (DGIdb 4.0) |
| Entrez ID | Symbol | Category | Interaction Types | Drug Claim Name | Drug Name | PMIDs |
| Page: 1 |

Copyright 2023-Present -The University of Texas Health Science Center at Houston |