
|
|||||
|
 | |
| |
| |
| |
| |
| |
|
Gene: TTC9 |
Gene summary for TTC9 |
| Gene information | Species | Human | Gene symbol | TTC9 | Gene ID | 23508 |
| Gene name | tetratricopeptide repeat domain 9 | |
| Gene Alias | TTC9A | |
| Cytomap | 14q24.2 | |
| Gene Type | protein-coding | GO ID | NA | UniProtAcc | A0A024R6B1 |
Top |
Malignant transformation analysis |
| Identification of the aberrant gene expression in precancerous and cancerous lesions by comparing the gene expression of stem-like cells in diseased tissues with normal stem cells |
| Entrez ID | Symbol | Replicates | Species | Organ | Tissue | Adj P-value | Log2FC | Malignancy |
| 23508 | TTC9 | LZE20T | Human | Esophagus | ESCC | 1.47e-02 | 2.94e-01 | 0.0662 |
| 23508 | TTC9 | LZE24T | Human | Esophagus | ESCC | 4.27e-02 | 1.99e-01 | 0.0596 |
| 23508 | TTC9 | P8T-E | Human | Esophagus | ESCC | 2.35e-03 | 9.02e-02 | 0.0889 |
| 23508 | TTC9 | P23T-E | Human | Esophagus | ESCC | 2.76e-05 | 3.96e-01 | 0.108 |
| 23508 | TTC9 | P27T-E | Human | Esophagus | ESCC | 1.83e-08 | 1.32e-01 | 0.1055 |
| 23508 | TTC9 | P39T-E | Human | Esophagus | ESCC | 6.17e-20 | 5.46e-01 | 0.0894 |
| 23508 | TTC9 | P54T-E | Human | Esophagus | ESCC | 1.21e-02 | 1.50e-01 | 0.0975 |
| 23508 | TTC9 | P56T-E | Human | Esophagus | ESCC | 5.72e-07 | 7.52e-01 | 0.1613 |
| 23508 | TTC9 | P57T-E | Human | Esophagus | ESCC | 1.54e-04 | 1.06e-01 | 0.0926 |
| 23508 | TTC9 | P75T-E | Human | Esophagus | ESCC | 1.32e-15 | 4.39e-01 | 0.1125 |
| 23508 | TTC9 | P83T-E | Human | Esophagus | ESCC | 1.89e-09 | 4.27e-01 | 0.1738 |
| 23508 | TTC9 | P89T-E | Human | Esophagus | ESCC | 2.07e-14 | 8.43e-01 | 0.1752 |
| 23508 | TTC9 | P127T-E | Human | Esophagus | ESCC | 5.20e-11 | 4.55e-01 | 0.0826 |
| 23508 | TTC9 | P128T-E | Human | Esophagus | ESCC | 1.06e-04 | 3.15e-01 | 0.1241 |
| 23508 | TTC9 | P130T-E | Human | Esophagus | ESCC | 1.61e-10 | 1.40e-01 | 0.1676 |
| 23508 | TTC9 | C46 | Human | Oral cavity | OSCC | 1.48e-03 | 1.71e-01 | 0.1673 |
| 23508 | TTC9 | C57 | Human | Oral cavity | OSCC | 2.21e-38 | 1.17e+00 | 0.1679 |
| 23508 | TTC9 | C08 | Human | Oral cavity | OSCC | 6.35e-13 | 5.74e-01 | 0.1919 |
| 23508 | TTC9 | LN46 | Human | Oral cavity | OSCC | 6.53e-03 | 3.32e-01 | 0.1666 |
| Page: 1 |
| Tissue | Expression Dynamics | Abbreviation |
| Esophagus | 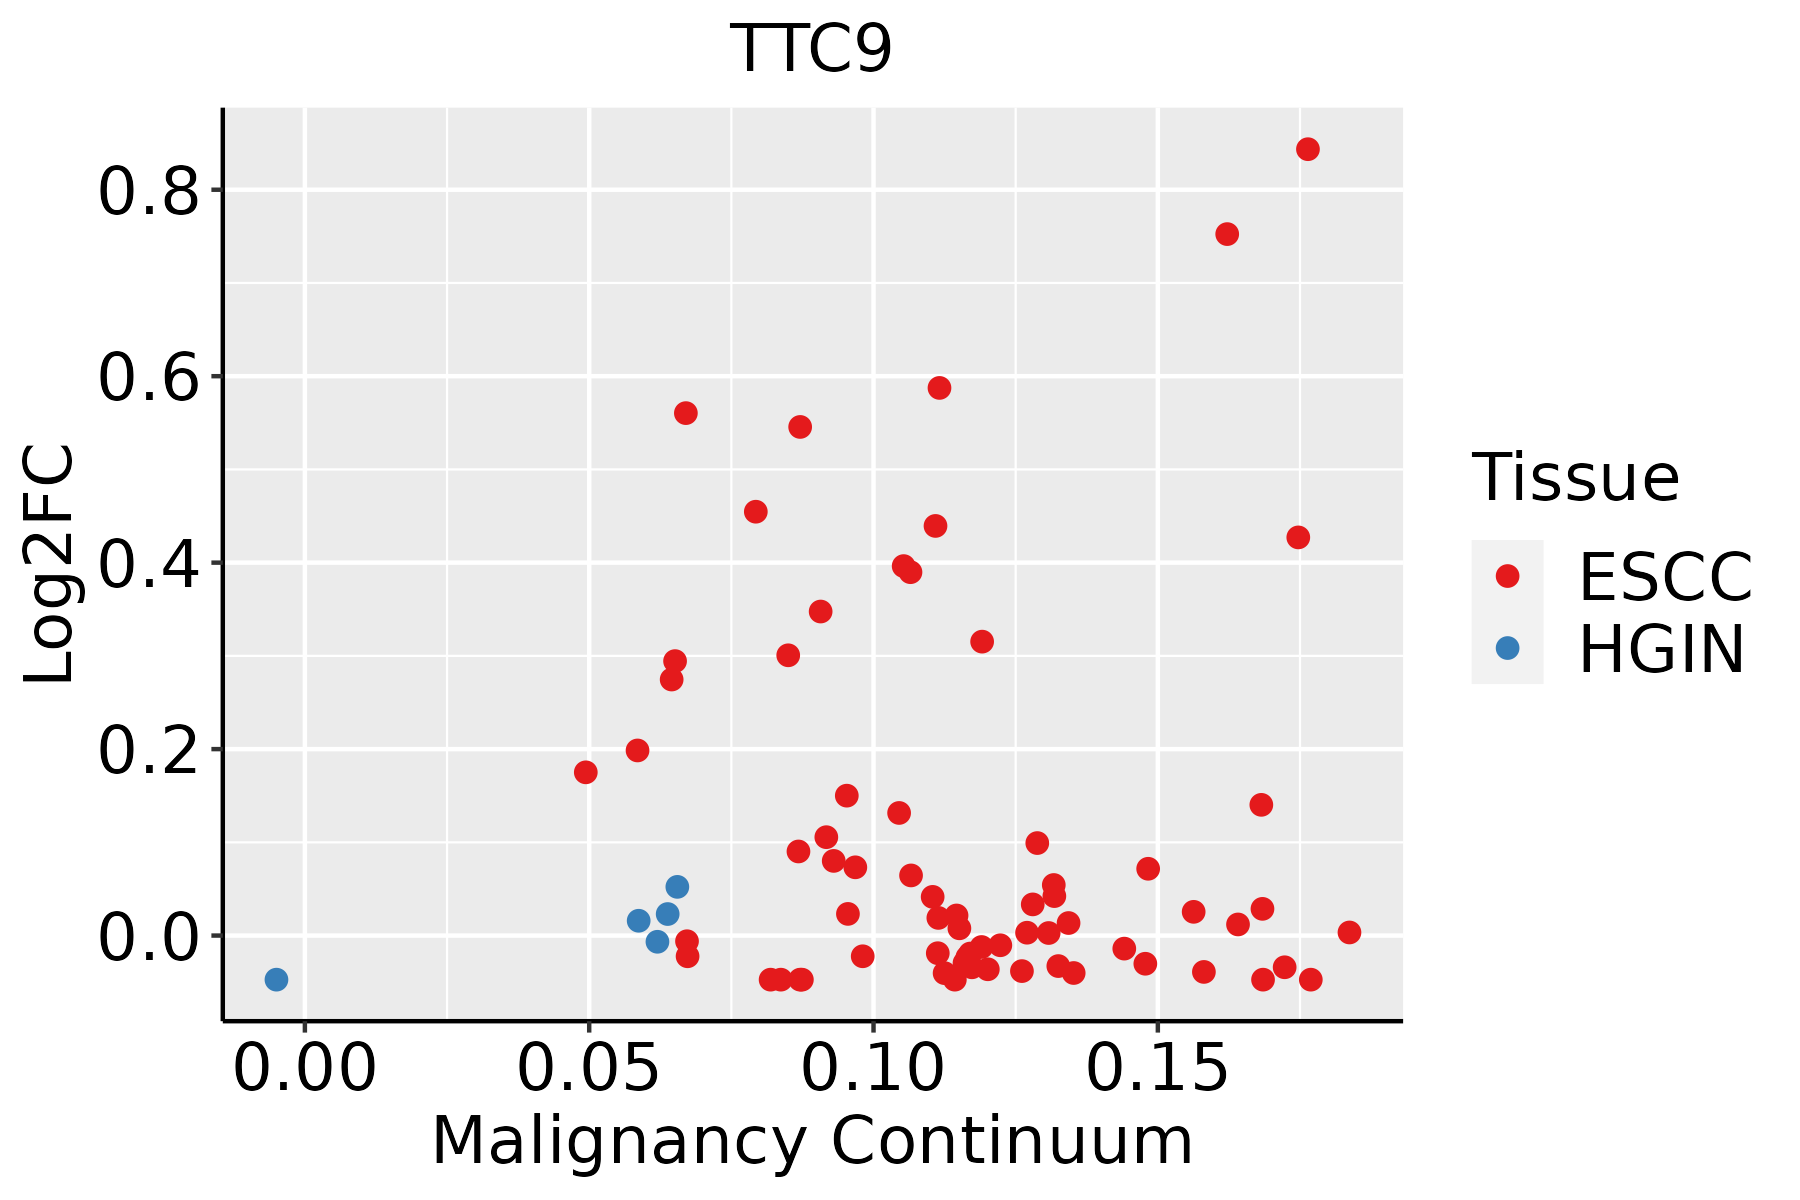 | ESCC: Esophageal squamous cell carcinoma |
| HGIN: High-grade intraepithelial neoplasias | ||
| LGIN: Low-grade intraepithelial neoplasias | ||
| Oral Cavity | 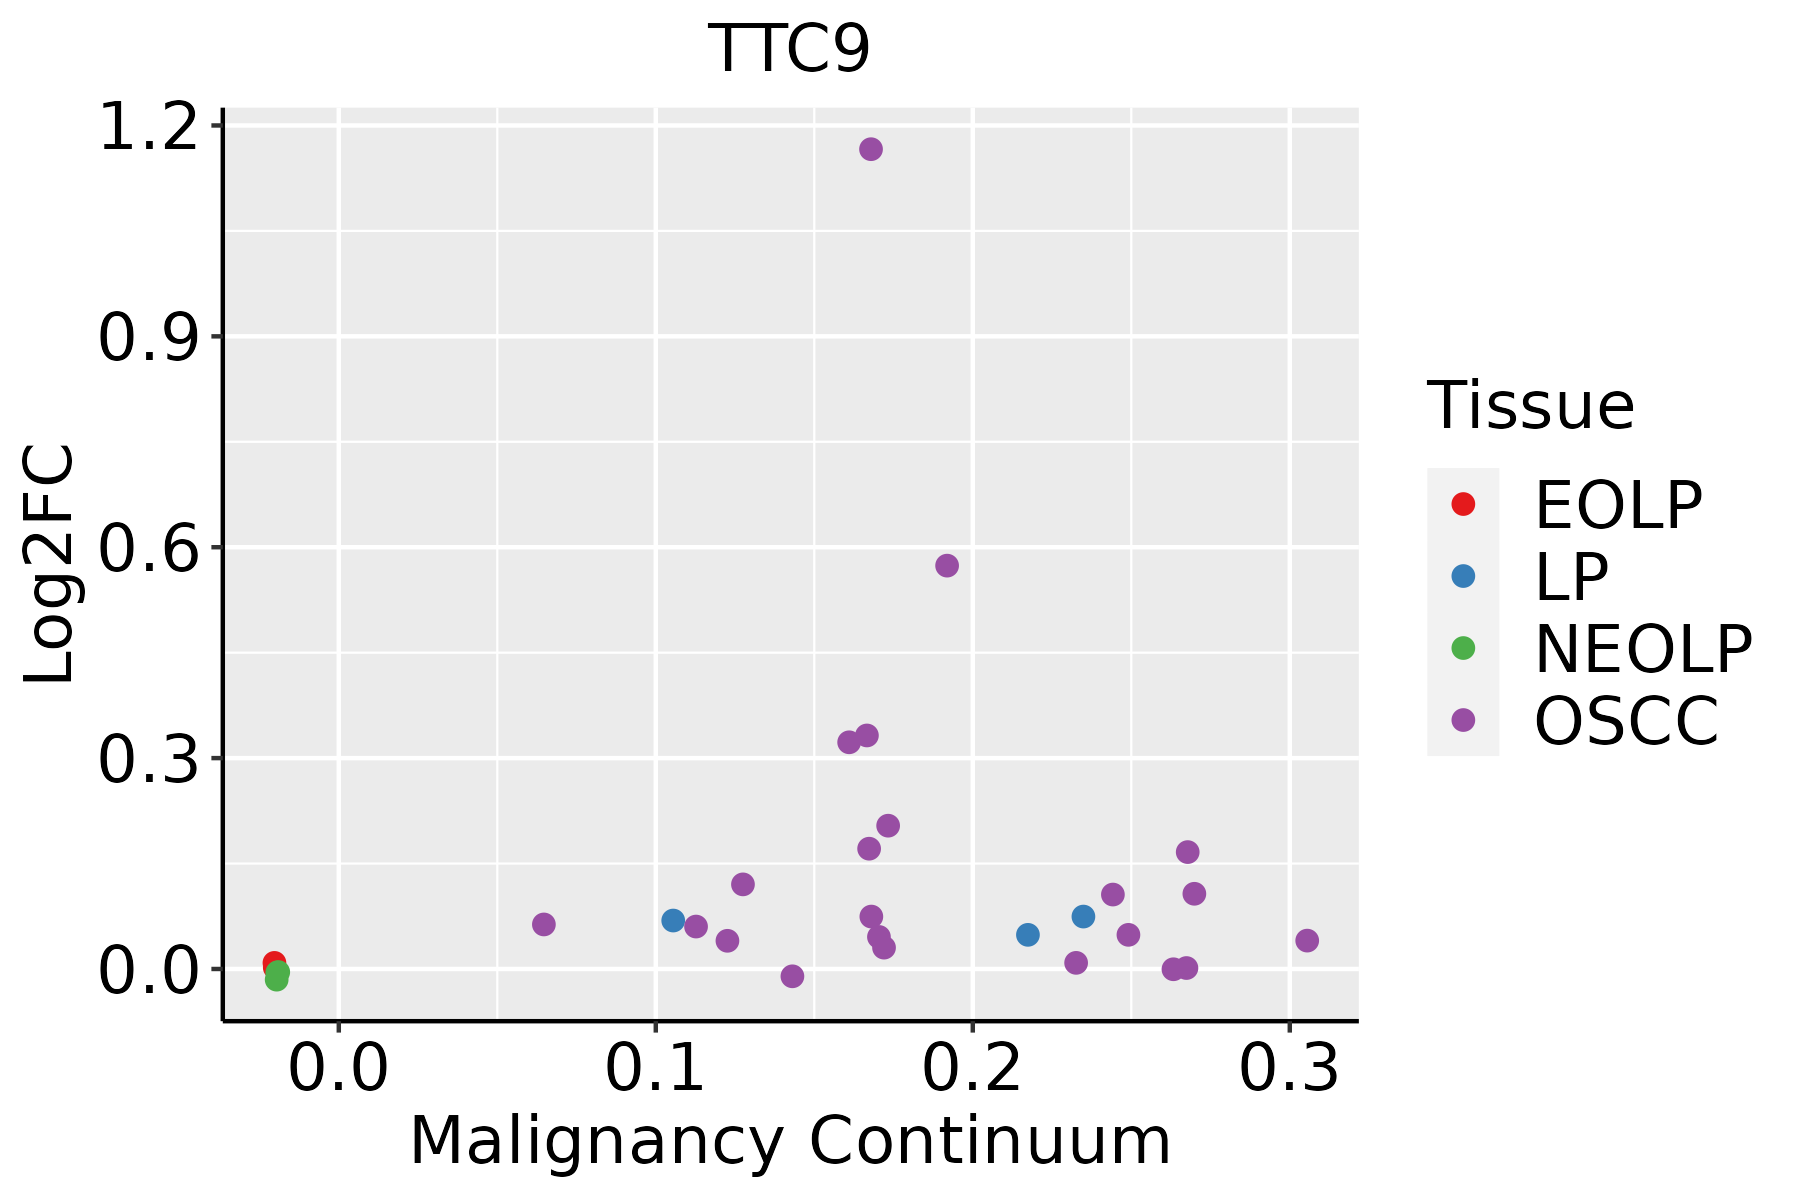 | EOLP: Erosive Oral lichen planus |
| LP: leukoplakia | ||
| NEOLP: Non-erosive oral lichen planus | ||
| OSCC: Oral squamous cell carcinoma |
| ∗log2FC in expression of this searched gene in stem-like cells from each diseased tissue sample relative to stem-like cells in normal samples in each tissue plotted against the malignancy continuum. Samples are colored based on if they are from different disease stage. |
Top |
Malignant transformation related pathway analysis |
| Find out the enriched GO biological processes and KEGG pathways involved in transition from healthy to precancer to cancer |
| Tissue | Disease Stage | Enriched GO biological Processes |
| Colorectum | AD |  |
| Colorectum | SER |  |
| Colorectum | MSS |  |
| Colorectum | MSI-H |  |
| Colorectum | FAP |  |
| ∗Top 15 enriched GO BP terms are showed in the bar plot of each disease state in each tissue. Each row represents a significant GO biological process which is colored according to the -log10(p.adjust). |
| Page: 1 2 3 4 5 6 7 8 9 |
| GO ID | Tissue | Disease Stage | Description | Gene Ratio | Bg Ratio | pvalue | p.adjust | Count |
| Page: 1 |
| Pathway ID | Tissue | Disease Stage | Description | Gene Ratio | Bg Ratio | pvalue | p.adjust | qvalue | Count |
| Page: 1 |
Top |
Cell-cell communication analysis |
| Identification of potential cell-cell interactions between two cell types and their ligand-receptor pairs for different disease states |
| Ligand | Receptor | LRpair | Pathway | Tissue | Disease Stage |
| Page: 1 |
Top |
Single-cell gene regulatory network inference analysis |
| Find out the significant the regulons (TFs) and the target genes of each regulon across cell types for different disease states |
| TF | Cell Type | Tissue | Disease Stage | Target Gene | RSS | Regulon Activity |
| ∗The dot plots of a searched regulon are shown for all cell subpopulations in each disease state of each tissue based on the regulon specific score inferred using pySCENIC and by calculating the average expression. |
| Page: 1 |
Top |
Somatic mutation of malignant transformation related genes |
| Annotation of somatic variants for genes involved in malignant transformation |
| Hugo Symbol | Variant Class | Variant Classification | dbSNP RS | HGVSc | HGVSp | HGVSp Short | SWISSPROT | BIOTYPE | SIFT | PolyPhen | Tumor Sample Barcode | Tissue | Histology | Sex | Age | Stage | Therapy Types | Drugs | Outcome |
| TTC9 | SNV | Missense_Mutation | c.213N>T | p.Lys71Asn | p.K71N | Q92623 | protein_coding | deleterious(0.02) | probably_damaging(0.991) | TCGA-C8-A134-01 | Breast | breast invasive carcinoma | Female | <65 | I/II | Chemotherapy | 5-fluorouracil | CR | |
| TTC9 | SNV | Missense_Mutation | novel | c.415N>T | p.Leu139Phe | p.L139F | Q92623 | protein_coding | deleterious(0) | probably_damaging(0.999) | TCGA-AA-3984-01 | Colorectum | colon adenocarcinoma | Female | <65 | I/II | Unknown | Unknown | SD |
| TTC9 | SNV | Missense_Mutation | novel | c.604N>T | p.Arg202Trp | p.R202W | Q92623 | protein_coding | deleterious(0) | probably_damaging(0.999) | TCGA-AA-3984-01 | Colorectum | colon adenocarcinoma | Female | <65 | I/II | Unknown | Unknown | SD |
| TTC9 | SNV | Missense_Mutation | rs776992939 | c.443N>A | p.Arg148Gln | p.R148Q | Q92623 | protein_coding | deleterious(0.02) | probably_damaging(0.997) | TCGA-CA-6718-01 | Colorectum | colon adenocarcinoma | Male | <65 | I/II | Unknown | Unknown | PD |
| TTC9 | SNV | Missense_Mutation | novel | c.550N>A | p.Leu184Ile | p.L184I | Q92623 | protein_coding | deleterious(0.03) | probably_damaging(0.999) | TCGA-AX-A06F-01 | Endometrium | uterine corpus endometrioid carcinoma | Female | <65 | III/IV | Chemotherapy | carboplatin | SD |
| TTC9 | SNV | Missense_Mutation | c.535N>T | p.Asp179Tyr | p.D179Y | Q92623 | protein_coding | deleterious(0) | probably_damaging(1) | TCGA-B5-A11E-01 | Endometrium | uterine corpus endometrioid carcinoma | Female | <65 | I/II | Unknown | Unknown | SD | |
| TTC9 | SNV | Missense_Mutation | c.505N>T | p.Arg169Trp | p.R169W | Q92623 | protein_coding | deleterious(0) | probably_damaging(1) | TCGA-D1-A103-01 | Endometrium | uterine corpus endometrioid carcinoma | Female | >=65 | I/II | Unknown | Unknown | SD | |
| TTC9 | SNV | Missense_Mutation | rs776992939 | c.443N>A | p.Arg148Gln | p.R148Q | Q92623 | protein_coding | deleterious(0.02) | probably_damaging(0.997) | TCGA-EO-A3B0-01 | Endometrium | uterine corpus endometrioid carcinoma | Female | <65 | III/IV | Unknown | Unknown | SD |
| TTC9 | insertion | Frame_Shift_Ins | novel | c.276_277insA | p.Pro93ThrfsTer50 | p.P93Tfs*50 | Q92623 | protein_coding | TCGA-DD-A3A7-01 | Liver | liver hepatocellular carcinoma | Male | >=65 | III/IV | Chemotherapy | unknown | PD | ||
| TTC9 | SNV | Missense_Mutation | rs771231172 | c.605G>A | p.Arg202Gln | p.R202Q | Q92623 | protein_coding | deleterious(0) | probably_damaging(0.997) | TCGA-78-8640-01 | Lung | lung adenocarcinoma | Male | <65 | I/II | Unknown | Unknown | SD |
| Page: 1 |
Top |
Related drugs of malignant transformation related genes |
| Identification of chemicals and drugs interact with genes involved in malignant transfromation |
| (DGIdb 4.0) |
| Entrez ID | Symbol | Category | Interaction Types | Drug Claim Name | Drug Name | PMIDs |
| Page: 1 |

Copyright 2023-Present -The University of Texas Health Science Center at Houston |