
|
|||||
|
 | |
| |
| |
| |
| |
| |
|
Gene: TTC6 |
Gene summary for TTC6 |
| Gene information | Species | Human | Gene symbol | TTC6 | Gene ID | 319089 |
| Gene name | tetratricopeptide repeat domain 6 | |
| Gene Alias | C14orf25 | |
| Cytomap | 14q21.1 | |
| Gene Type | protein-coding | GO ID | NA | UniProtAcc | NA |
Top |
Malignant transformation analysis |
| Identification of the aberrant gene expression in precancerous and cancerous lesions by comparing the gene expression of stem-like cells in diseased tissues with normal stem cells |
| Entrez ID | Symbol | Replicates | Species | Organ | Tissue | Adj P-value | Log2FC | Malignancy |
| 319089 | TTC6 | CCI_2 | Human | Cervix | CC | 6.66e-14 | 7.98e-01 | 0.5249 |
| 319089 | TTC6 | CCI_3 | Human | Cervix | CC | 2.02e-12 | 3.99e-01 | 0.516 |
| 319089 | TTC6 | AEH-subject1 | Human | Endometrium | AEH | 1.75e-35 | 6.84e-01 | -0.3059 |
| 319089 | TTC6 | AEH-subject2 | Human | Endometrium | AEH | 1.79e-06 | 2.15e-01 | -0.2525 |
| 319089 | TTC6 | AEH-subject3 | Human | Endometrium | AEH | 3.50e-22 | 5.06e-01 | -0.2576 |
| 319089 | TTC6 | AEH-subject5 | Human | Endometrium | AEH | 2.66e-23 | 4.60e-01 | -0.2953 |
| 319089 | TTC6 | EEC-subject1 | Human | Endometrium | EEC | 4.01e-09 | 2.90e-01 | -0.2682 |
| 319089 | TTC6 | EEC-subject4 | Human | Endometrium | EEC | 7.69e-12 | 3.09e-01 | -0.2571 |
| 319089 | TTC6 | RNA-P17T-P17T-2 | Human | Lung | IAC | 6.80e-05 | 6.91e-01 | 0.3371 |
| 319089 | TTC6 | RNA-P17T-P17T-4 | Human | Lung | IAC | 1.48e-03 | 5.72e-01 | 0.343 |
| 319089 | TTC6 | RNA-P17T-P17T-6 | Human | Lung | IAC | 2.66e-08 | 8.72e-01 | 0.3385 |
| 319089 | TTC6 | RNA-P17T-P17T-8 | Human | Lung | IAC | 1.77e-07 | 8.00e-01 | 0.3329 |
| 319089 | TTC6 | RNA-P23T2-P23T2-2 | Human | Lung | MIAC | 4.97e-07 | 9.11e-01 | -0.028 |
| 319089 | TTC6 | RNA-P23T2-P23T2-4 | Human | Lung | MIAC | 3.47e-02 | 6.93e-01 | -0.0272 |
| 319089 | TTC6 | RNA-P25T1-P25T1-1 | Human | Lung | AIS | 1.55e-07 | 4.48e-01 | -0.2116 |
| 319089 | TTC6 | RNA-P25T1-P25T1-4 | Human | Lung | AIS | 3.10e-04 | 3.43e-01 | -0.2119 |
| 319089 | TTC6 | RNA-P6T2-P6T2-1 | Human | Lung | IAC | 1.39e-03 | 1.89e-01 | -0.0166 |
| 319089 | TTC6 | RNA-P6T2-P6T2-3 | Human | Lung | IAC | 2.63e-07 | 2.62e-01 | -0.013 |
| 319089 | TTC6 | RNA-P6T2-P6T2-4 | Human | Lung | IAC | 6.25e-03 | 1.72e-01 | -0.0121 |
| 319089 | TTC6 | RNA-P7T1-P7T1-1 | Human | Lung | AIS | 7.48e-05 | 5.11e-01 | -0.0961 |
| Page: 1 2 |
| Tissue | Expression Dynamics | Abbreviation |
| Cervix | 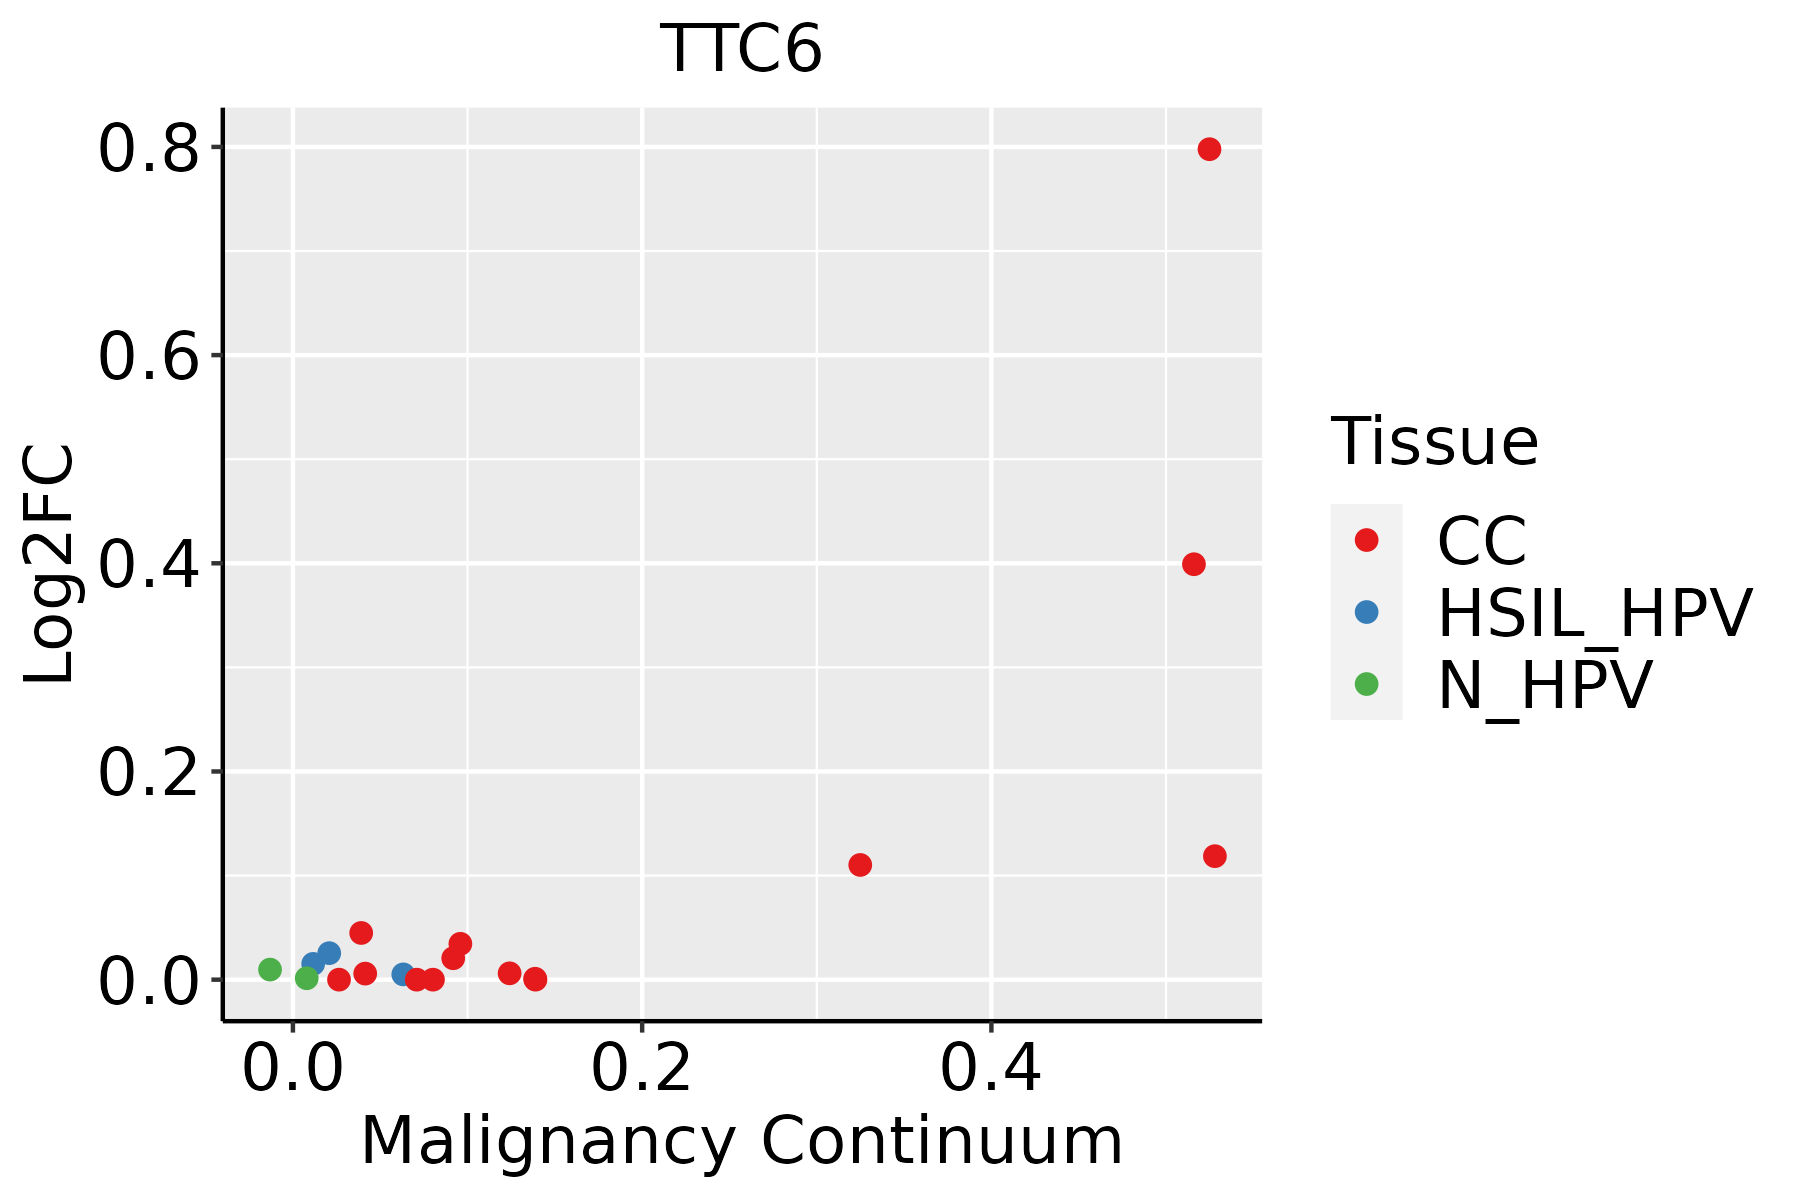 | CC: Cervix cancer |
| HSIL_HPV: HPV-infected high-grade squamous intraepithelial lesions | ||
| N_HPV: HPV-infected normal cervix | ||
| Endometrium | 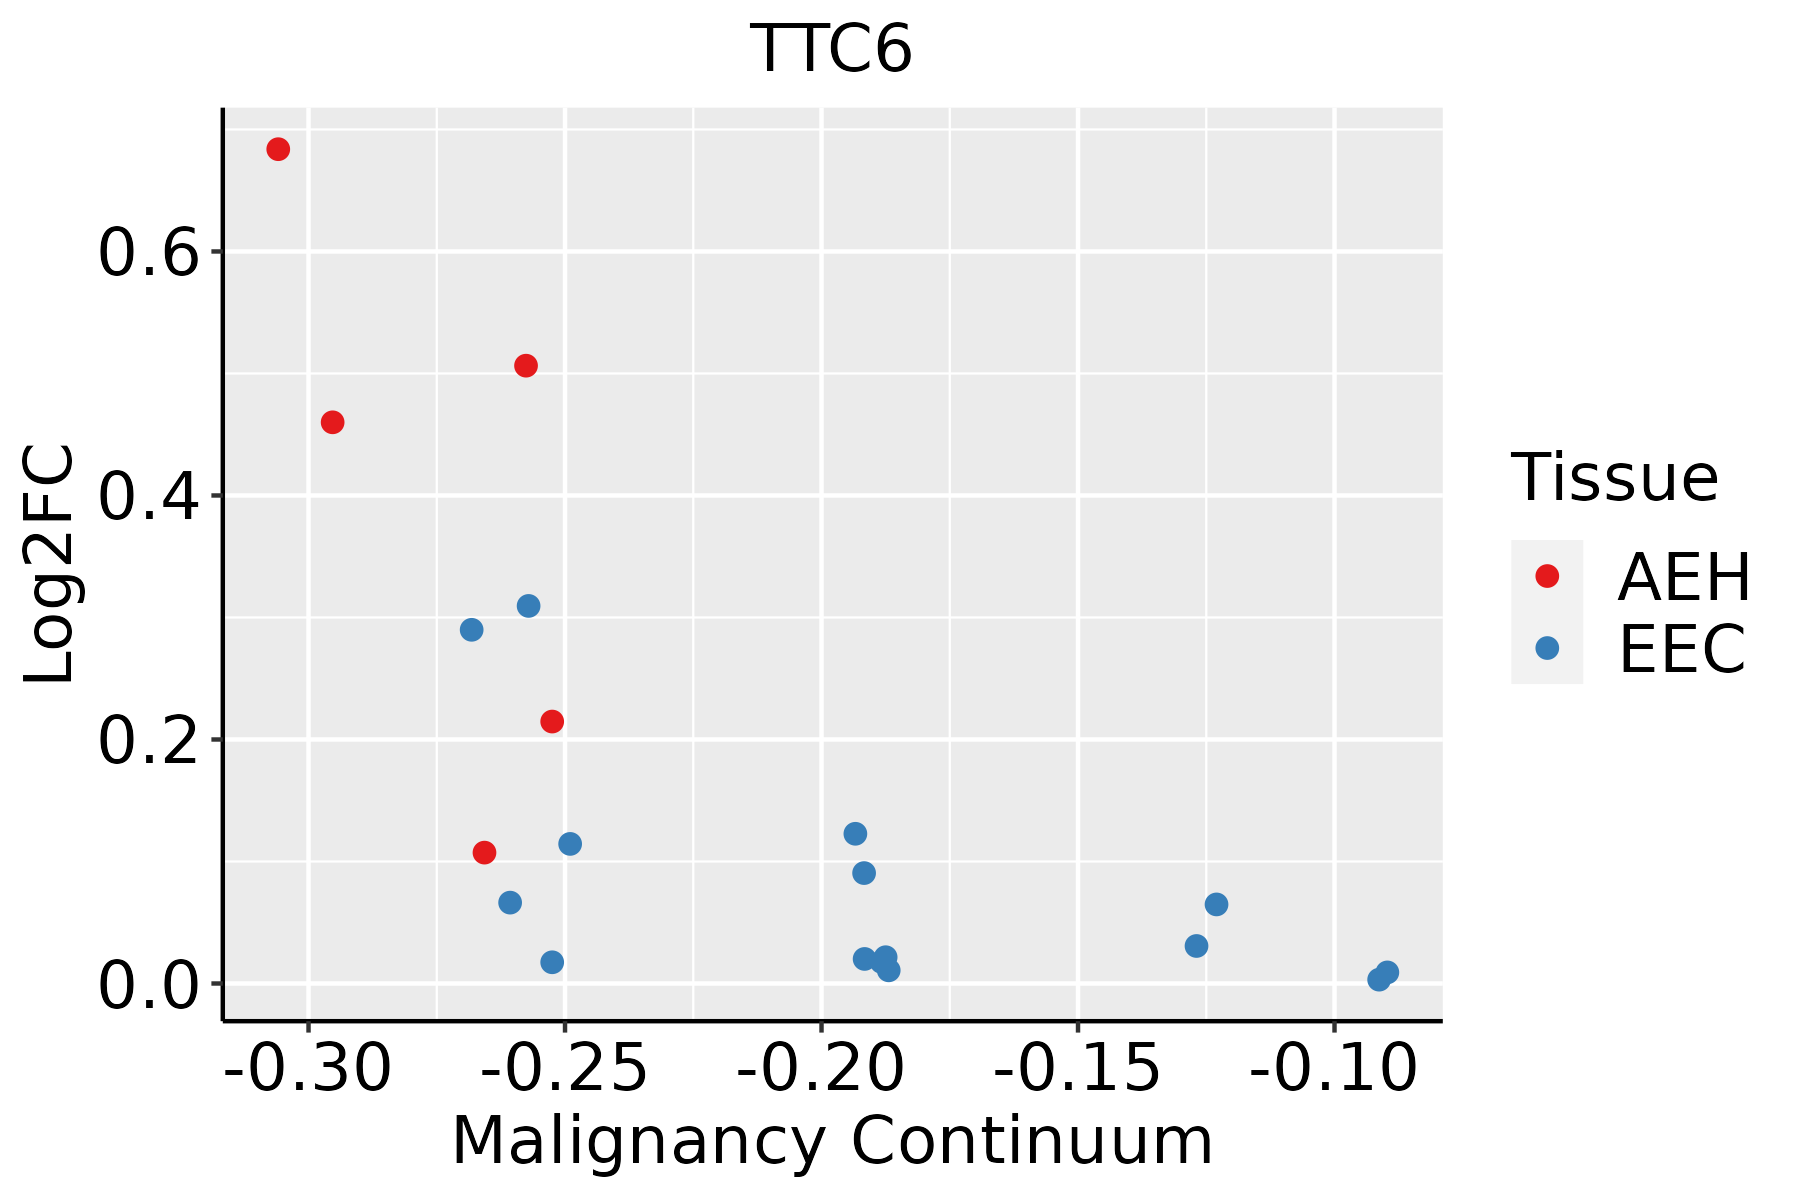 | AEH: Atypical endometrial hyperplasia |
| EEC: Endometrioid Cancer | ||
| Lung |  | AAH: Atypical adenomatous hyperplasia |
| AIS: Adenocarcinoma in situ | ||
| IAC: Invasive lung adenocarcinoma | ||
| MIA: Minimally invasive adenocarcinoma | ||
| Prostate | 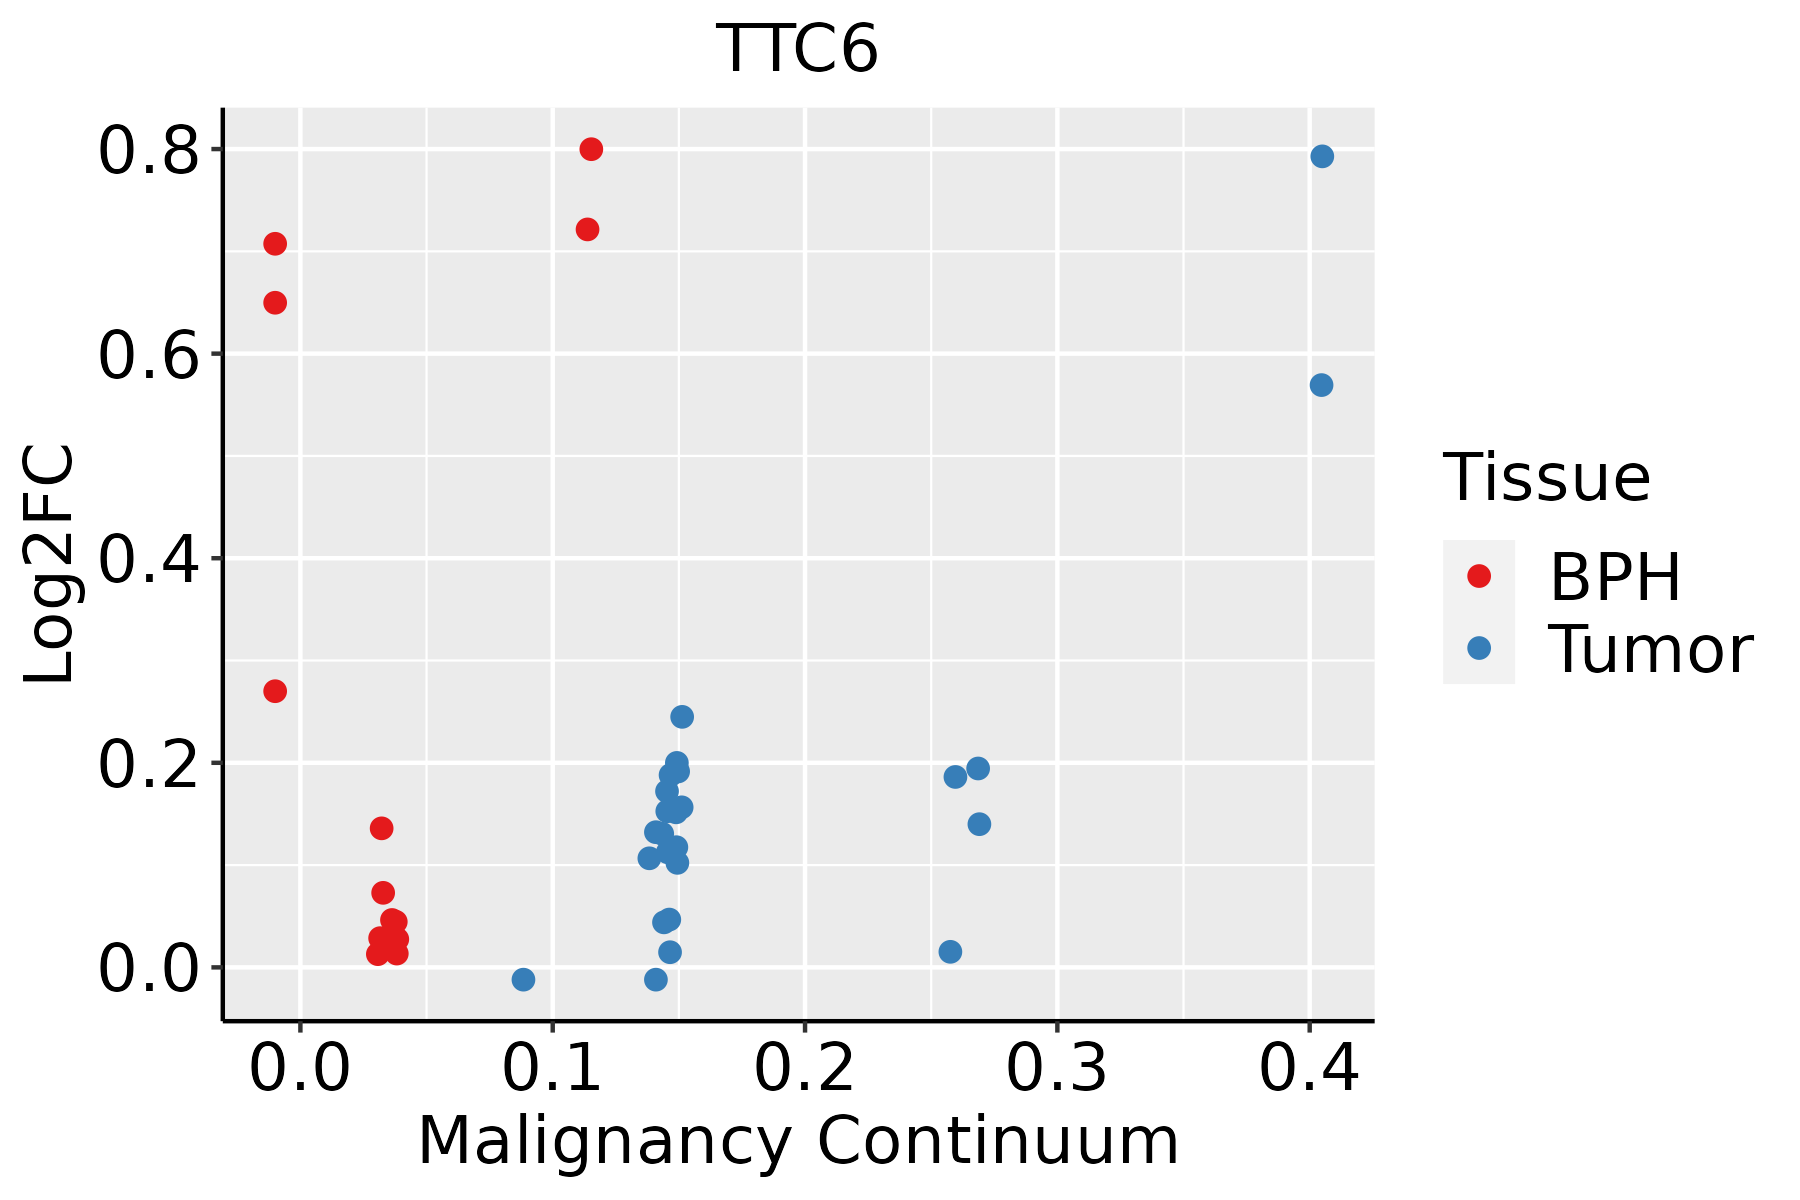 | BPH: Benign Prostatic Hyperplasia |
| ∗log2FC in expression of this searched gene in stem-like cells from each diseased tissue sample relative to stem-like cells in normal samples in each tissue plotted against the malignancy continuum. Samples are colored based on if they are from different disease stage. |
Top |
Malignant transformation related pathway analysis |
| Find out the enriched GO biological processes and KEGG pathways involved in transition from healthy to precancer to cancer |
| Tissue | Disease Stage | Enriched GO biological Processes |
| Colorectum | AD |  |
| Colorectum | SER |  |
| Colorectum | MSS |  |
| Colorectum | MSI-H |  |
| Colorectum | FAP |  |
| ∗Top 15 enriched GO BP terms are showed in the bar plot of each disease state in each tissue. Each row represents a significant GO biological process which is colored according to the -log10(p.adjust). |
| Page: 1 2 3 4 5 6 7 8 9 |
| GO ID | Tissue | Disease Stage | Description | Gene Ratio | Bg Ratio | pvalue | p.adjust | Count |
| Page: 1 |
| Pathway ID | Tissue | Disease Stage | Description | Gene Ratio | Bg Ratio | pvalue | p.adjust | qvalue | Count |
| Page: 1 |
Top |
Cell-cell communication analysis |
| Identification of potential cell-cell interactions between two cell types and their ligand-receptor pairs for different disease states |
| Ligand | Receptor | LRpair | Pathway | Tissue | Disease Stage |
| Page: 1 |
Top |
Single-cell gene regulatory network inference analysis |
| Find out the significant the regulons (TFs) and the target genes of each regulon across cell types for different disease states |
| TF | Cell Type | Tissue | Disease Stage | Target Gene | RSS | Regulon Activity |
| ∗The dot plots of a searched regulon are shown for all cell subpopulations in each disease state of each tissue based on the regulon specific score inferred using pySCENIC and by calculating the average expression. |
| Page: 1 |
Top |
Somatic mutation of malignant transformation related genes |
| Annotation of somatic variants for genes involved in malignant transformation |
| Hugo Symbol | Variant Class | Variant Classification | dbSNP RS | HGVSc | HGVSp | HGVSp Short | SWISSPROT | BIOTYPE | SIFT | PolyPhen | Tumor Sample Barcode | Tissue | Histology | Sex | Age | Stage | Therapy Types | Drugs | Outcome |
| TTC6 | SNV | Missense_Mutation | c.967N>C | p.Phe323Leu | p.F323L | nonsense_mediated_decay | tolerated(0.66) | benign(0.023) | TCGA-D8-A147-01 | Breast | breast invasive carcinoma | Female | <65 | I/II | Chemotherapy | doxorubicine | SD | ||
| TTC6 | SNV | Missense_Mutation | novel | c.2665N>A | p.Asp889Asn | p.D889N | protein_coding | tolerated(0.6) | benign(0) | TCGA-OL-A5RW-01 | Breast | breast invasive carcinoma | Female | <65 | I/II | Chemotherapy | adriamycin | CR | |
| TTC6 | SNV | Missense_Mutation | rs746600797 | c.1214N>C | p.Ile405Thr | p.I405T | nonsense_mediated_decay | deleterious(0.03) | benign(0.057) | TCGA-OL-A5RW-01 | Breast | breast invasive carcinoma | Female | <65 | I/II | Chemotherapy | adriamycin | CR | |
| TTC6 | SNV | Missense_Mutation | novel | c.382N>A | p.Val128Met | p.V128M | nonsense_mediated_decay | deleterious(0) | probably_damaging(0.912) | TCGA-2W-A8YY-01 | Cervix | cervical & endocervical cancer | Female | <65 | I/II | Chemotherapy | cisplatin | CR | |
| TTC6 | SNV | Missense_Mutation | rs533775542 | c.47N>T | p.Pro16Leu | p.P16L | protein_coding | unknown(0) | TCGA-C5-A1BQ-01 | Cervix | cervical & endocervical cancer | Female | >=65 | III/IV | Chemotherapy | cisplatin | CR | ||
| TTC6 | SNV | Missense_Mutation | novel | c.793N>T | p.Leu265Phe | p.L265F | nonsense_mediated_decay | deleterious(0.01) | probably_damaging(0.979) | TCGA-MA-AA42-01 | Cervix | cervical & endocervical cancer | Female | >=65 | I/II | Unknown | Unknown | SD | |
| TTC6 | SNV | Missense_Mutation | novel | c.854N>G | p.Glu285Gly | p.E285G | nonsense_mediated_decay | deleterious(0.01) | benign(0.117) | TCGA-ZJ-A8QR-01 | Cervix | cervical & endocervical cancer | Female | <65 | I/II | Unknown | Unknown | SD | |
| TTC6 | SNV | Missense_Mutation | c.325N>A | p.Leu109Ile | p.L109I | nonsense_mediated_decay | tolerated(0.09) | possibly_damaging(0.61) | TCGA-AA-3854-01 | Colorectum | colon adenocarcinoma | Female | >=65 | I/II | Unknown | Unknown | SD | ||
| TTC6 | SNV | Missense_Mutation | novel | c.1283A>C | p.Asn428Thr | p.N428T | nonsense_mediated_decay | tolerated(1) | benign(0.01) | TCGA-CA-6717-01 | Colorectum | colon adenocarcinoma | Male | <65 | I/II | Chemotherapy | oxaliplatin | CR | |
| TTC6 | SNV | Missense_Mutation | c.1374N>A | p.Met458Ile | p.M458I | nonsense_mediated_decay | deleterious(0.01) | possibly_damaging(0.748) | TCGA-G4-6588-01 | Colorectum | colon adenocarcinoma | Female | <65 | I/II | Unknown | Unknown | SD |
| Page: 1 2 3 4 5 6 7 8 9 10 11 |
Top |
Related drugs of malignant transformation related genes |
| Identification of chemicals and drugs interact with genes involved in malignant transfromation |
| (DGIdb 4.0) |
| Entrez ID | Symbol | Category | Interaction Types | Drug Claim Name | Drug Name | PMIDs |
| Page: 1 |

Copyright 2023-Present -The University of Texas Health Science Center at Houston |