
|
|||||
|
 | |
| |
| |
| |
| |
| |
|
Gene: TTC39B |
Gene summary for TTC39B |
| Gene information | Species | Human | Gene symbol | TTC39B | Gene ID | 158219 |
| Gene name | tetratricopeptide repeat domain 39B | |
| Gene Alias | C9orf52 | |
| Cytomap | 9p22.3 | |
| Gene Type | protein-coding | GO ID | GO:0006066 | UniProtAcc | Q5VTQ0 |
Top |
Malignant transformation analysis |
| Identification of the aberrant gene expression in precancerous and cancerous lesions by comparing the gene expression of stem-like cells in diseased tissues with normal stem cells |
| Entrez ID | Symbol | Replicates | Species | Organ | Tissue | Adj P-value | Log2FC | Malignancy |
| 158219 | TTC39B | CA_HPV_1 | Human | Cervix | CC | 7.99e-03 | -1.59e-01 | 0.0264 |
| 158219 | TTC39B | CCI_1 | Human | Cervix | CC | 1.11e-03 | 5.92e-01 | 0.528 |
| 158219 | TTC39B | CCI_2 | Human | Cervix | CC | 5.41e-08 | 9.41e-01 | 0.5249 |
| 158219 | TTC39B | HTA11_3410_2000001011 | Human | Colorectum | AD | 7.83e-11 | -5.13e-01 | 0.0155 |
| 158219 | TTC39B | HTA11_866_3004761011 | Human | Colorectum | AD | 1.26e-05 | -4.95e-01 | 0.096 |
| 158219 | TTC39B | HTA11_10711_2000001011 | Human | Colorectum | AD | 1.87e-03 | -4.38e-01 | 0.0338 |
| 158219 | TTC39B | HTA11_7696_3000711011 | Human | Colorectum | AD | 5.76e-13 | -4.61e-01 | 0.0674 |
| 158219 | TTC39B | HTA11_99999970781_79442 | Human | Colorectum | MSS | 1.02e-04 | -3.21e-01 | 0.294 |
| 158219 | TTC39B | HTA11_99999974143_84620 | Human | Colorectum | MSS | 7.98e-11 | -4.65e-01 | 0.3005 |
| 158219 | TTC39B | A002-C-010 | Human | Colorectum | FAP | 6.76e-07 | -3.53e-01 | 0.242 |
| 158219 | TTC39B | A001-C-207 | Human | Colorectum | FAP | 2.41e-02 | -3.64e-01 | 0.1278 |
| 158219 | TTC39B | A015-C-203 | Human | Colorectum | FAP | 6.43e-19 | -3.75e-01 | -0.1294 |
| 158219 | TTC39B | A015-C-204 | Human | Colorectum | FAP | 4.89e-03 | -3.37e-01 | -0.0228 |
| 158219 | TTC39B | A002-C-201 | Human | Colorectum | FAP | 2.30e-10 | -4.21e-01 | 0.0324 |
| 158219 | TTC39B | A002-C-203 | Human | Colorectum | FAP | 5.33e-03 | -1.95e-01 | 0.2786 |
| 158219 | TTC39B | A001-C-119 | Human | Colorectum | FAP | 2.79e-03 | -4.64e-01 | -0.1557 |
| 158219 | TTC39B | A001-C-108 | Human | Colorectum | FAP | 1.42e-14 | -3.75e-01 | -0.0272 |
| 158219 | TTC39B | A002-C-205 | Human | Colorectum | FAP | 6.63e-18 | -5.79e-01 | -0.1236 |
| 158219 | TTC39B | A001-C-104 | Human | Colorectum | FAP | 9.47e-05 | -3.19e-01 | 0.0184 |
| 158219 | TTC39B | A015-C-005 | Human | Colorectum | FAP | 1.10e-08 | -5.28e-01 | -0.0336 |
| Page: 1 2 3 4 5 6 |
| Tissue | Expression Dynamics | Abbreviation |
| Cervix | 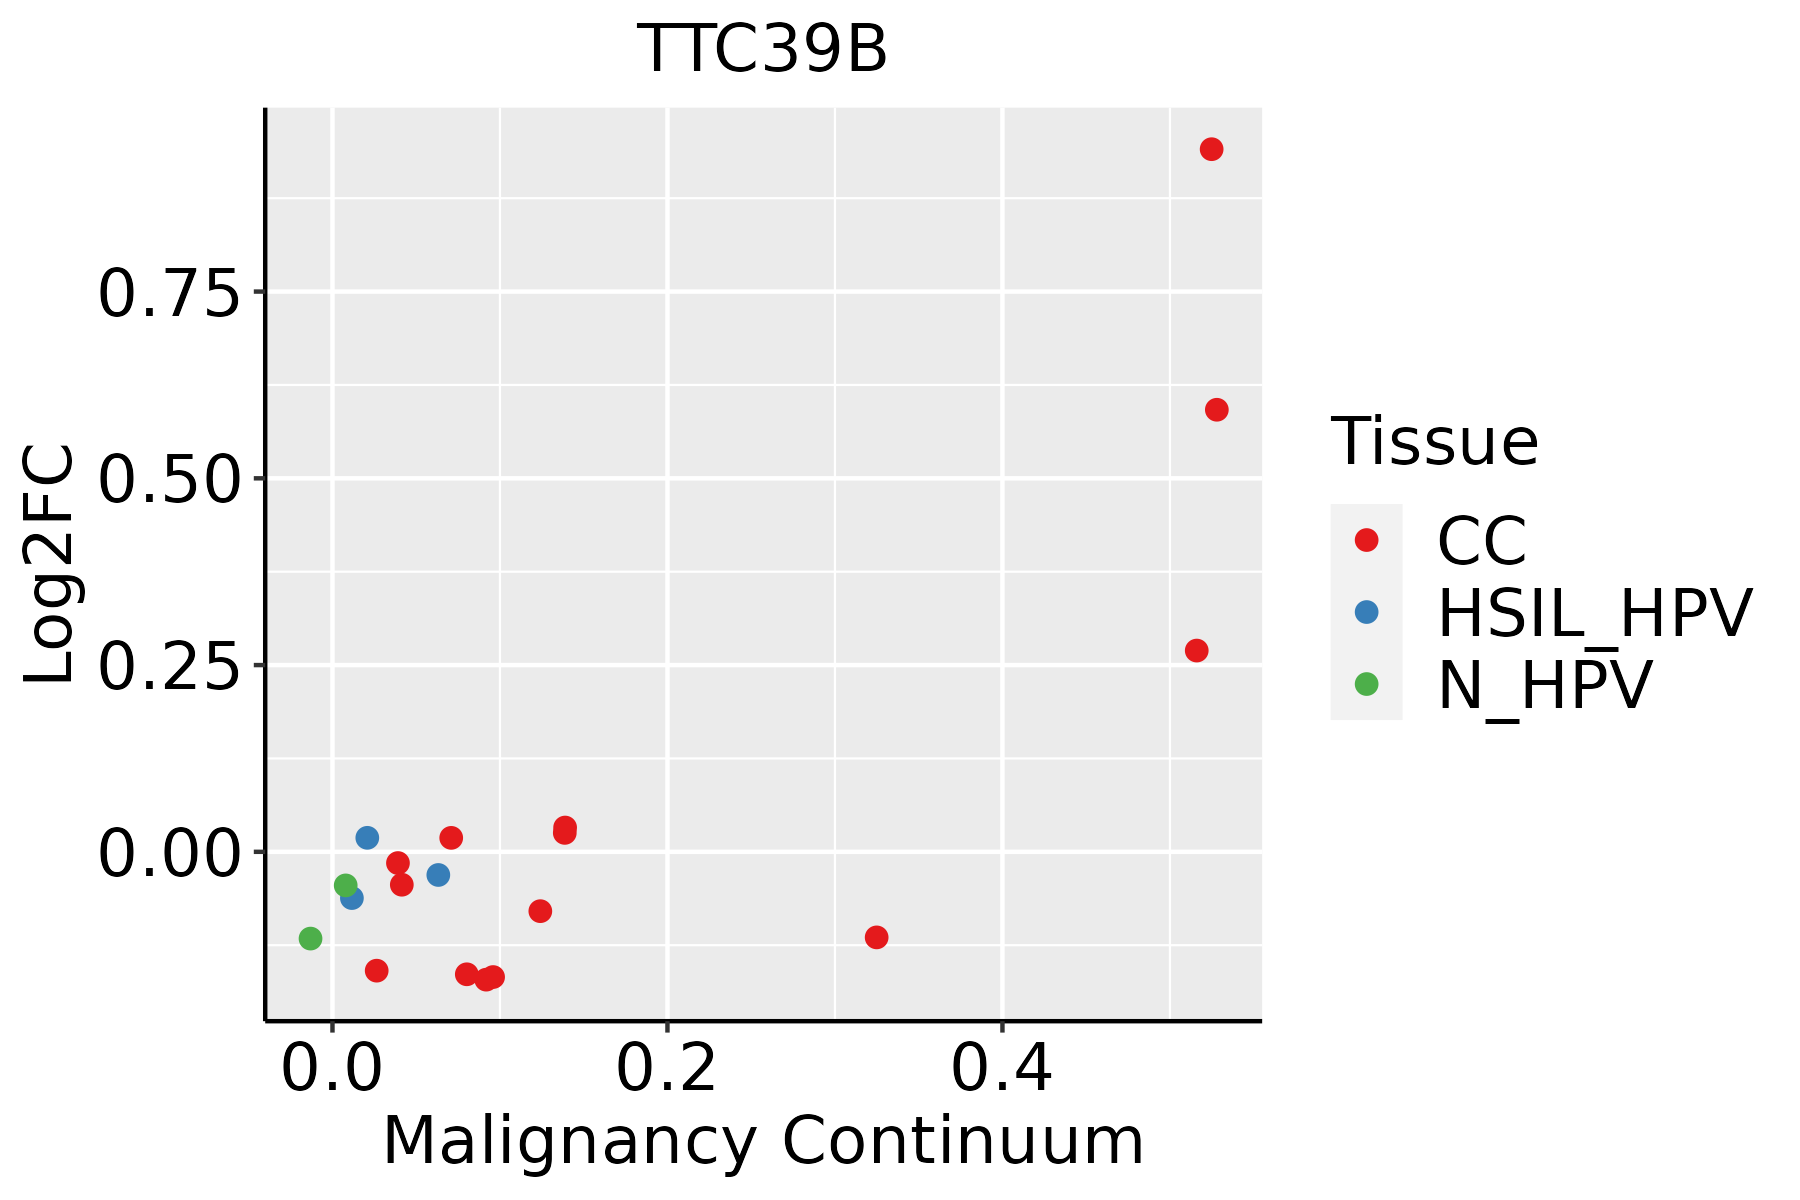 | CC: Cervix cancer |
| HSIL_HPV: HPV-infected high-grade squamous intraepithelial lesions | ||
| N_HPV: HPV-infected normal cervix | ||
| Colorectum (GSE201348) |  | FAP: Familial adenomatous polyposis |
| CRC: Colorectal cancer | ||
| Colorectum (HTA11) |  | AD: Adenomas |
| SER: Sessile serrated lesions | ||
| MSI-H: Microsatellite-high colorectal cancer | ||
| MSS: Microsatellite stable colorectal cancer | ||
| Esophagus | 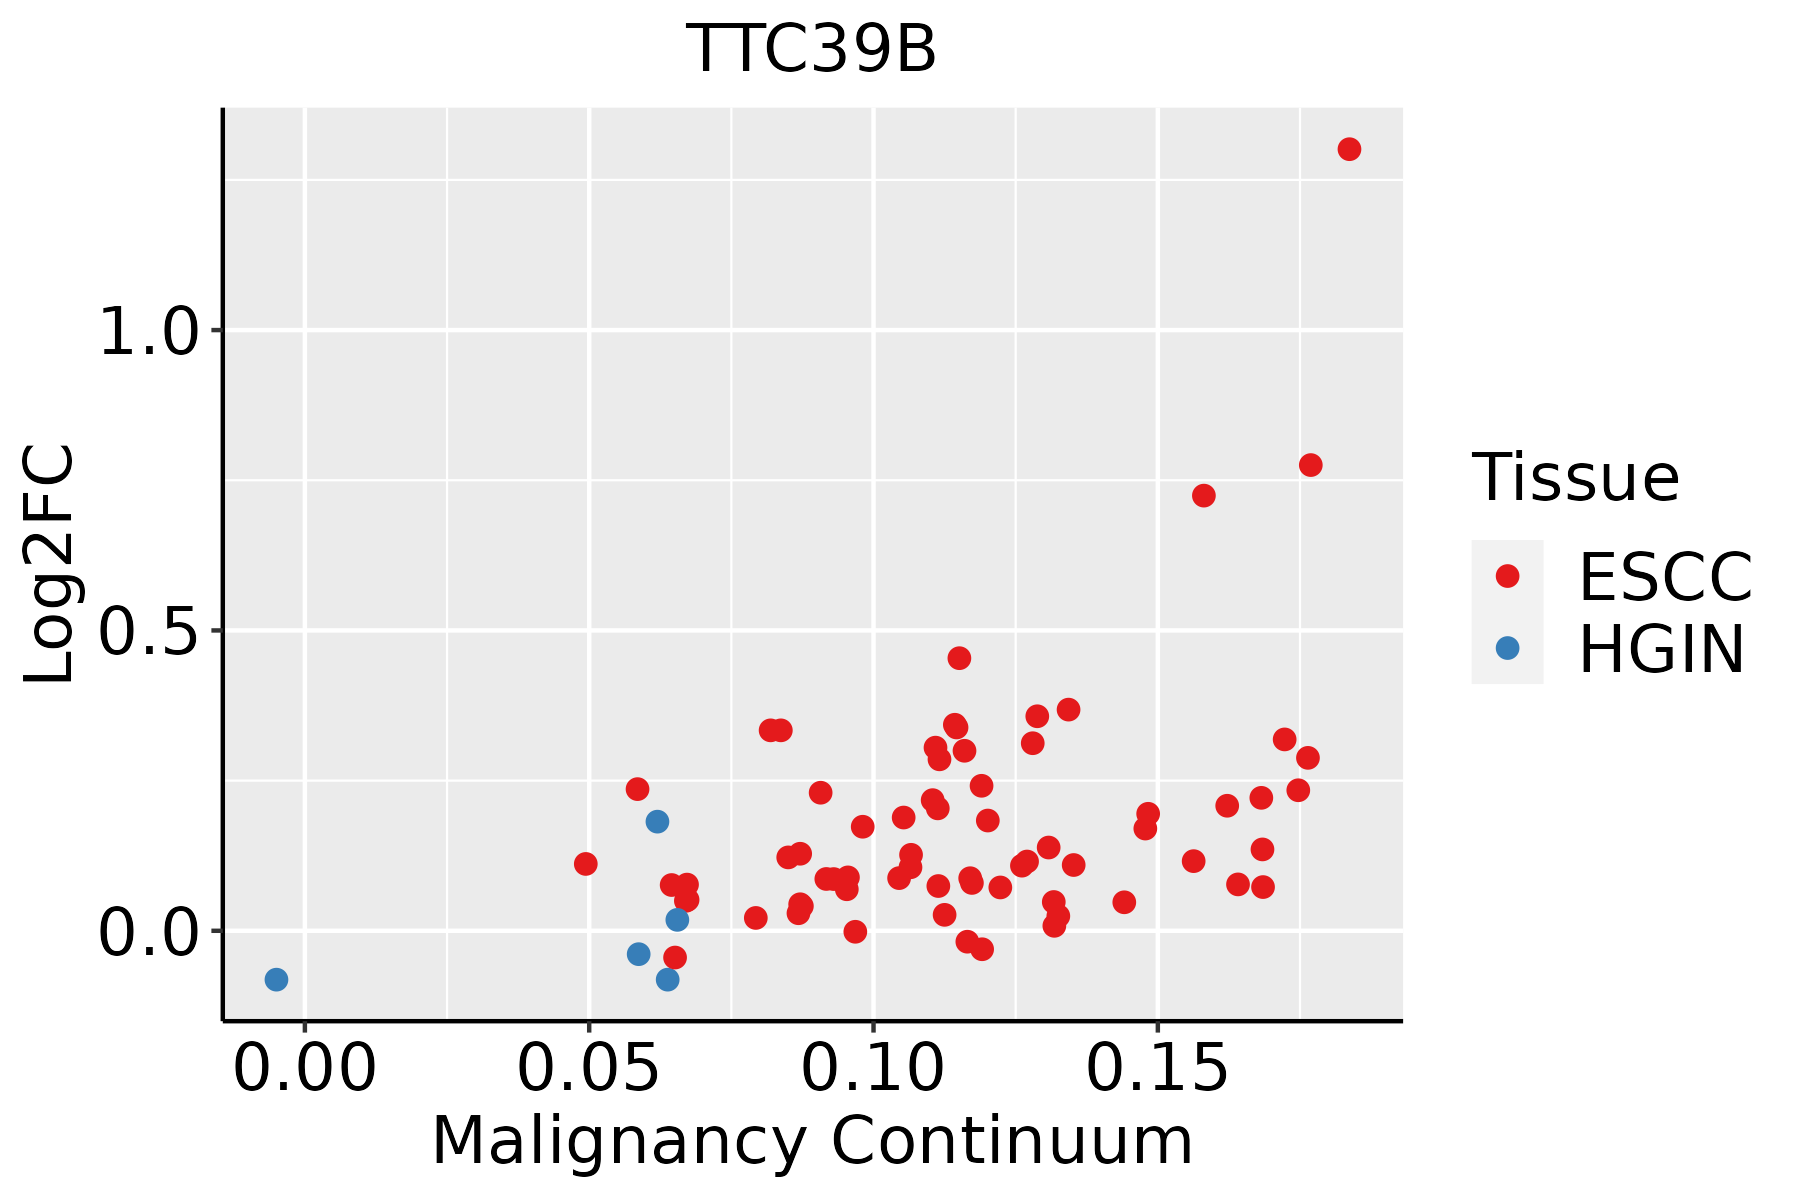 | ESCC: Esophageal squamous cell carcinoma |
| HGIN: High-grade intraepithelial neoplasias | ||
| LGIN: Low-grade intraepithelial neoplasias | ||
| Oral Cavity | 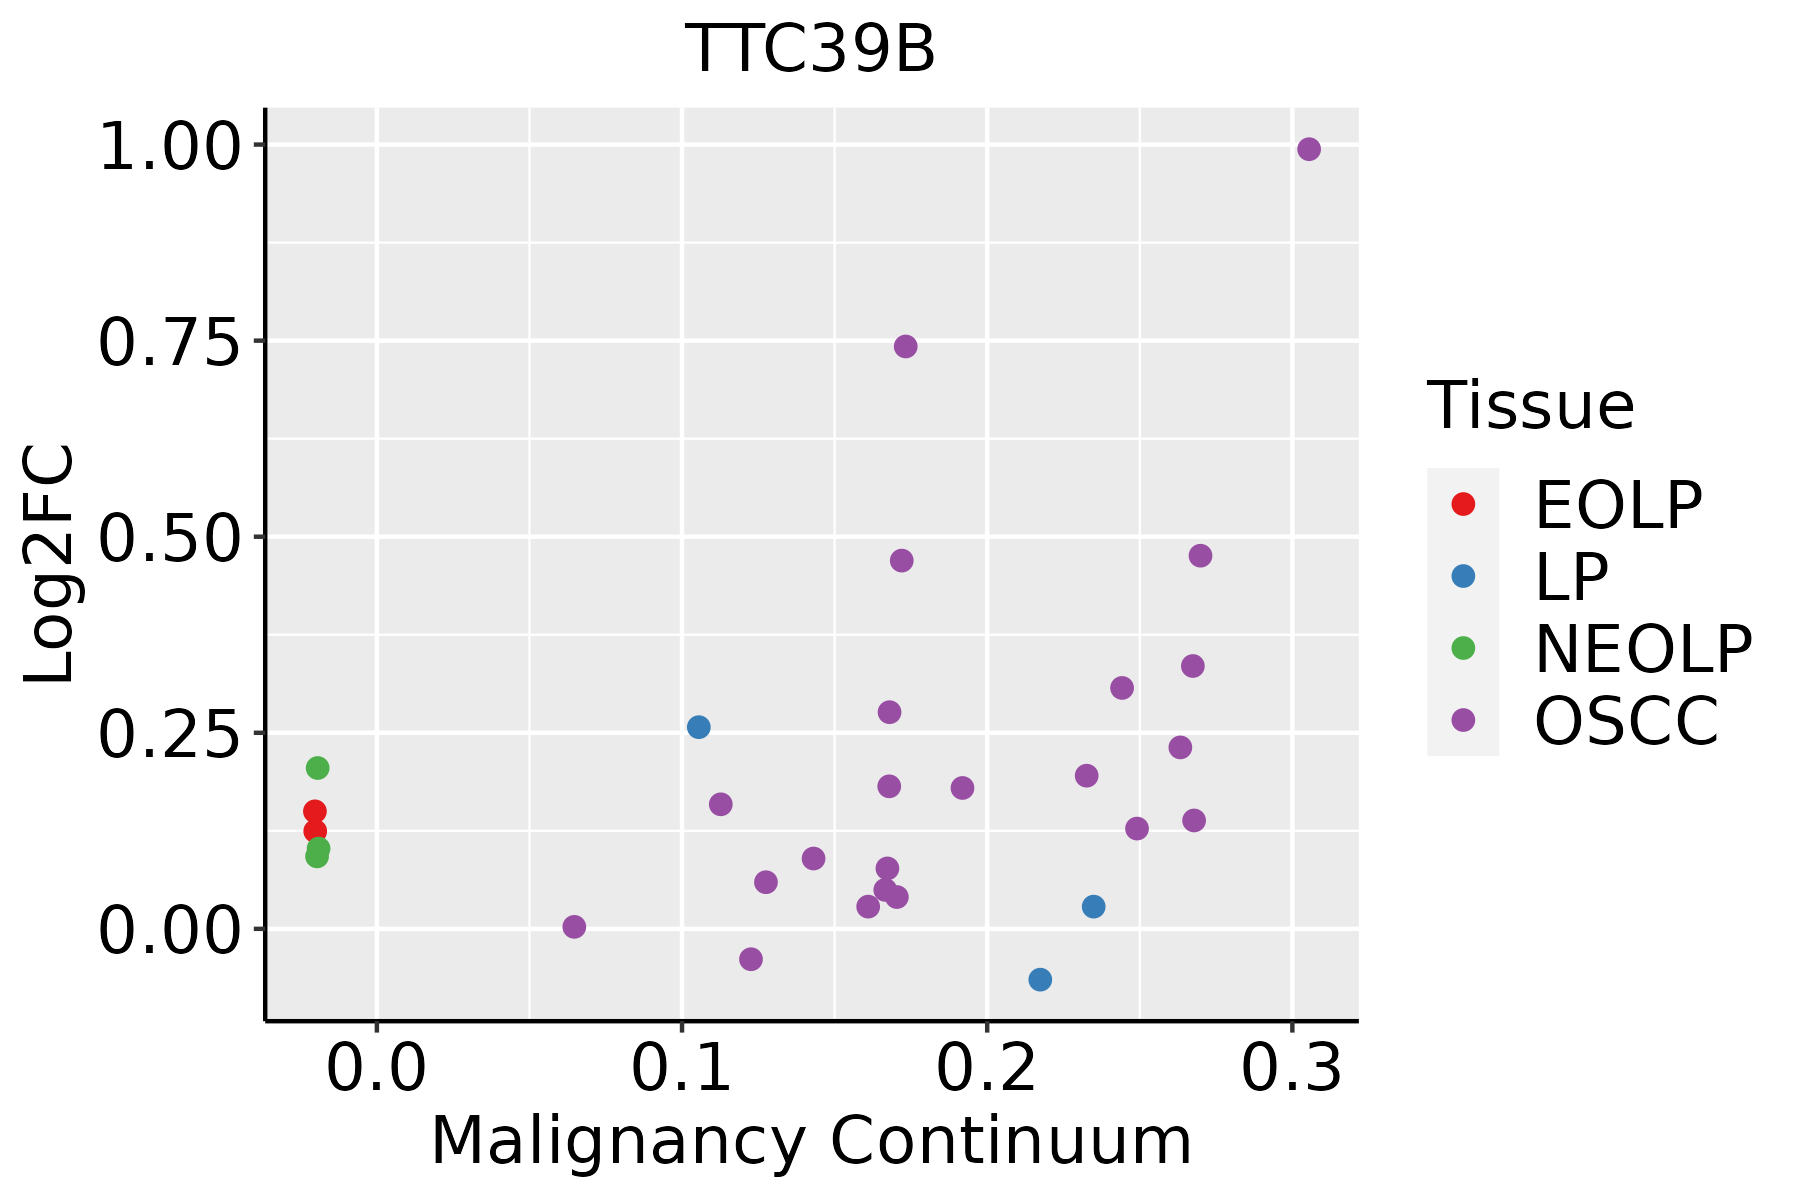 | EOLP: Erosive Oral lichen planus |
| LP: leukoplakia | ||
| NEOLP: Non-erosive oral lichen planus | ||
| OSCC: Oral squamous cell carcinoma | ||
| Thyroid |  | ATC: Anaplastic thyroid cancer |
| HT: Hashimoto's thyroiditis | ||
| PTC: Papillary thyroid cancer |
| ∗log2FC in expression of this searched gene in stem-like cells from each diseased tissue sample relative to stem-like cells in normal samples in each tissue plotted against the malignancy continuum. Samples are colored based on if they are from different disease stage. |
Top |
Malignant transformation related pathway analysis |
| Find out the enriched GO biological processes and KEGG pathways involved in transition from healthy to precancer to cancer |
| Tissue | Disease Stage | Enriched GO biological Processes |
| Colorectum | AD |  |
| Colorectum | SER |  |
| Colorectum | MSS |  |
| Colorectum | MSI-H |  |
| Colorectum | FAP |  |
| ∗Top 15 enriched GO BP terms are showed in the bar plot of each disease state in each tissue. Each row represents a significant GO biological process which is colored according to the -log10(p.adjust). |
| Page: 1 2 3 4 5 6 7 8 9 |
| GO ID | Tissue | Disease Stage | Description | Gene Ratio | Bg Ratio | pvalue | p.adjust | Count |
| GO:00512359 | Cervix | CC | maintenance of location | 78/2311 | 327/18723 | 5.18e-09 | 4.92e-07 | 78 |
| GO:00108834 | Cervix | CC | regulation of lipid storage | 15/2311 | 57/18723 | 3.13e-03 | 2.05e-02 | 15 |
| GO:0006066 | Colorectum | AD | alcohol metabolic process | 106/3918 | 353/18723 | 3.02e-05 | 5.57e-04 | 106 |
| GO:0062012 | Colorectum | AD | regulation of small molecule metabolic process | 93/3918 | 334/18723 | 1.46e-03 | 1.24e-02 | 93 |
| GO:0010876 | Colorectum | AD | lipid localization | 120/3918 | 448/18723 | 1.59e-03 | 1.33e-02 | 120 |
| GO:0006869 | Colorectum | AD | lipid transport | 108/3918 | 398/18723 | 1.67e-03 | 1.39e-02 | 108 |
| GO:0008202 | Colorectum | AD | steroid metabolic process | 85/3918 | 319/18723 | 8.07e-03 | 4.75e-02 | 85 |
| GO:00060662 | Colorectum | MSS | alcohol metabolic process | 92/3467 | 353/18723 | 2.57e-04 | 3.46e-03 | 92 |
| GO:00620121 | Colorectum | MSS | regulation of small molecule metabolic process | 83/3467 | 334/18723 | 2.25e-03 | 1.85e-02 | 83 |
| GO:00108761 | Colorectum | MSS | lipid localization | 104/3467 | 448/18723 | 6.76e-03 | 4.38e-02 | 104 |
| GO:00620122 | Colorectum | FAP | regulation of small molecule metabolic process | 74/2622 | 334/18723 | 3.15e-05 | 7.13e-04 | 74 |
| GO:00068691 | Colorectum | FAP | lipid transport | 81/2622 | 398/18723 | 2.84e-04 | 3.76e-03 | 81 |
| GO:00108762 | Colorectum | FAP | lipid localization | 85/2622 | 448/18723 | 1.92e-03 | 1.63e-02 | 85 |
| GO:00060663 | Colorectum | FAP | alcohol metabolic process | 69/2622 | 353/18723 | 2.29e-03 | 1.85e-02 | 69 |
| GO:00068692 | Colorectum | CRC | lipid transport | 63/2078 | 398/18723 | 2.36e-03 | 2.26e-02 | 63 |
| GO:00060664 | Colorectum | CRC | alcohol metabolic process | 57/2078 | 353/18723 | 2.37e-03 | 2.27e-02 | 57 |
| GO:00108763 | Colorectum | CRC | lipid localization | 68/2078 | 448/18723 | 4.60e-03 | 3.58e-02 | 68 |
| GO:0051235110 | Esophagus | ESCC | maintenance of location | 200/8552 | 327/18723 | 1.01e-08 | 2.02e-07 | 200 |
| GO:00060668 | Esophagus | ESCC | alcohol metabolic process | 202/8552 | 353/18723 | 7.32e-06 | 7.26e-05 | 202 |
| GO:00199155 | Esophagus | ESCC | lipid storage | 58/8552 | 87/18723 | 6.15e-05 | 4.72e-04 | 58 |
| Page: 1 2 |
| Pathway ID | Tissue | Disease Stage | Description | Gene Ratio | Bg Ratio | pvalue | p.adjust | qvalue | Count |
| Page: 1 |
Top |
Cell-cell communication analysis |
| Identification of potential cell-cell interactions between two cell types and their ligand-receptor pairs for different disease states |
| Ligand | Receptor | LRpair | Pathway | Tissue | Disease Stage |
| Page: 1 |
Top |
Single-cell gene regulatory network inference analysis |
| Find out the significant the regulons (TFs) and the target genes of each regulon across cell types for different disease states |
| TF | Cell Type | Tissue | Disease Stage | Target Gene | RSS | Regulon Activity |
| ∗The dot plots of a searched regulon are shown for all cell subpopulations in each disease state of each tissue based on the regulon specific score inferred using pySCENIC and by calculating the average expression. |
| Page: 1 |
Top |
Somatic mutation of malignant transformation related genes |
| Annotation of somatic variants for genes involved in malignant transformation |
| Hugo Symbol | Variant Class | Variant Classification | dbSNP RS | HGVSc | HGVSp | HGVSp Short | SWISSPROT | BIOTYPE | SIFT | PolyPhen | Tumor Sample Barcode | Tissue | Histology | Sex | Age | Stage | Therapy Types | Drugs | Outcome |
| TTC39B | SNV | Missense_Mutation | novel | c.570N>T | p.Gln190His | p.Q190H | Q5VTQ0 | protein_coding | tolerated(0.15) | probably_damaging(0.972) | TCGA-AN-A046-01 | Breast | breast invasive carcinoma | Female | >=65 | I/II | Unknown | Unknown | SD |
| TTC39B | SNV | Missense_Mutation | rs753898694 | c.466N>A | p.Glu156Lys | p.E156K | Q5VTQ0 | protein_coding | tolerated(0.25) | possibly_damaging(0.815) | TCGA-D8-A145-01 | Breast | breast invasive carcinoma | Female | >=65 | I/II | Hormone Therapy | tamoxiphen | SD |
| TTC39B | SNV | Missense_Mutation | novel | c.1781N>C | p.Cys594Ser | p.C594S | Q5VTQ0 | protein_coding | deleterious(0.01) | probably_damaging(0.998) | TCGA-LL-A6FR-01 | Breast | breast invasive carcinoma | Female | <65 | I/II | Chemotherapy | adriamycin | SD |
| TTC39B | SNV | Missense_Mutation | rs192520168 | c.476N>A | p.Arg159His | p.R159H | Q5VTQ0 | protein_coding | tolerated(0.18) | possibly_damaging(0.883) | TCGA-2W-A8YY-01 | Cervix | cervical & endocervical cancer | Female | <65 | I/II | Chemotherapy | cisplatin | CR |
| TTC39B | SNV | Missense_Mutation | c.218G>C | p.Arg73Pro | p.R73P | Q5VTQ0 | protein_coding | tolerated_low_confidence(0.29) | benign(0.033) | TCGA-C5-A1BQ-01 | Cervix | cervical & endocervical cancer | Female | >=65 | III/IV | Chemotherapy | cisplatin | CR | |
| TTC39B | SNV | Missense_Mutation | novel | c.118G>T | p.Gly40Trp | p.G40W | Q5VTQ0 | protein_coding | deleterious_low_confidence(0) | probably_damaging(0.966) | TCGA-C5-A1BQ-01 | Cervix | cervical & endocervical cancer | Female | >=65 | III/IV | Chemotherapy | cisplatin | CR |
| TTC39B | SNV | Missense_Mutation | novel | c.1344G>A | p.Met448Ile | p.M448I | Q5VTQ0 | protein_coding | tolerated(0.17) | benign(0.015) | TCGA-A6-2672-01 | Colorectum | colon adenocarcinoma | Female | >=65 | III/IV | Unknown | Unknown | SD |
| TTC39B | SNV | Missense_Mutation | c.1198N>A | p.Ala400Thr | p.A400T | Q5VTQ0 | protein_coding | deleterious(0) | possibly_damaging(0.875) | TCGA-AA-3977-01 | Colorectum | colon adenocarcinoma | Male | >=65 | I/II | Unknown | Unknown | SD | |
| TTC39B | SNV | Missense_Mutation | rs546349081 | c.170T>G | p.Phe57Cys | p.F57C | Q5VTQ0 | protein_coding | deleterious_low_confidence(0.02) | benign(0.072) | TCGA-AA-A010-01 | Colorectum | colon adenocarcinoma | Female | <65 | I/II | Chemotherapy | folinic | CR |
| TTC39B | SNV | Missense_Mutation | rs769080516 | c.295N>A | p.Ala99Thr | p.A99T | Q5VTQ0 | protein_coding | deleterious_low_confidence(0.02) | benign(0.087) | TCGA-AA-A01R-01 | Colorectum | colon adenocarcinoma | Male | <65 | III/IV | Chemotherapy | 5-fluorouracil | PD |
| Page: 1 2 3 4 5 6 |
Top |
Related drugs of malignant transformation related genes |
| Identification of chemicals and drugs interact with genes involved in malignant transfromation |
| (DGIdb 4.0) |
| Entrez ID | Symbol | Category | Interaction Types | Drug Claim Name | Drug Name | PMIDs |
| Page: 1 |

Copyright 2023-Present -The University of Texas Health Science Center at Houston |