
|
|||||
|
 | |
| |
| |
| |
| |
| |
|
Gene: TTC39A |
Gene summary for TTC39A |
| Gene information | Species | Human | Gene symbol | TTC39A | Gene ID | 22996 |
| Gene name | tetratricopeptide repeat domain 39A | |
| Gene Alias | C1orf34 | |
| Cytomap | 1p32.3 | |
| Gene Type | protein-coding | GO ID | GO:0008150 | UniProtAcc | A0A140VJY6 |
Top |
Malignant transformation analysis |
| Identification of the aberrant gene expression in precancerous and cancerous lesions by comparing the gene expression of stem-like cells in diseased tissues with normal stem cells |
| Entrez ID | Symbol | Replicates | Species | Organ | Tissue | Adj P-value | Log2FC | Malignancy |
| 22996 | TTC39A | GSM4909281 | Human | Breast | IDC | 3.76e-07 | 2.32e-01 | 0.21 |
| 22996 | TTC39A | GSM4909293 | Human | Breast | IDC | 3.32e-02 | 1.73e-01 | 0.1581 |
| 22996 | TTC39A | GSM4909298 | Human | Breast | IDC | 1.91e-17 | 3.90e-01 | 0.1551 |
| 22996 | TTC39A | GSM4909303 | Human | Breast | IDC | 3.99e-05 | 3.99e-01 | 0.0438 |
| 22996 | TTC39A | GSM4909304 | Human | Breast | IDC | 3.71e-03 | 1.90e-01 | 0.1636 |
| 22996 | TTC39A | GSM4909305 | Human | Breast | IDC | 7.99e-03 | 2.34e-01 | 0.0436 |
| 22996 | TTC39A | GSM4909306 | Human | Breast | IDC | 1.54e-05 | 2.93e-01 | 0.1564 |
| 22996 | TTC39A | GSM4909312 | Human | Breast | IDC | 6.60e-08 | 3.88e-01 | 0.1552 |
| 22996 | TTC39A | GSM4909317 | Human | Breast | IDC | 2.03e-05 | 2.51e-01 | 0.1355 |
| 22996 | TTC39A | brca2 | Human | Breast | Precancer | 1.38e-10 | 2.53e-01 | -0.024 |
| 22996 | TTC39A | NCCBC11 | Human | Breast | DCIS | 1.03e-05 | 5.53e-01 | 0.1232 |
| 22996 | TTC39A | DCIS2 | Human | Breast | DCIS | 3.20e-02 | -4.23e-02 | 0.0085 |
| 22996 | TTC39A | HTA11_2487_2000001011 | Human | Colorectum | SER | 7.14e-06 | 5.01e-01 | -0.1808 |
| 22996 | TTC39A | HTA11_78_2000001011 | Human | Colorectum | AD | 9.15e-03 | 3.18e-01 | -0.1088 |
| 22996 | TTC39A | HTA11_347_2000001011 | Human | Colorectum | AD | 5.71e-17 | 5.97e-01 | -0.1954 |
| 22996 | TTC39A | HTA11_411_2000001011 | Human | Colorectum | SER | 3.14e-03 | 6.87e-01 | -0.2602 |
| 22996 | TTC39A | HTA11_2112_2000001011 | Human | Colorectum | SER | 9.81e-03 | 8.09e-01 | -0.2196 |
| 22996 | TTC39A | HTA11_696_2000001011 | Human | Colorectum | AD | 1.90e-06 | 4.94e-01 | -0.1464 |
| 22996 | TTC39A | HTA11_1391_2000001011 | Human | Colorectum | AD | 2.16e-04 | 3.57e-01 | -0.059 |
| 22996 | TTC39A | A002-C-201 | Human | Colorectum | FAP | 7.36e-03 | -1.83e-01 | 0.0324 |
| Page: 1 2 3 |
| Tissue | Expression Dynamics | Abbreviation |
| Breast | 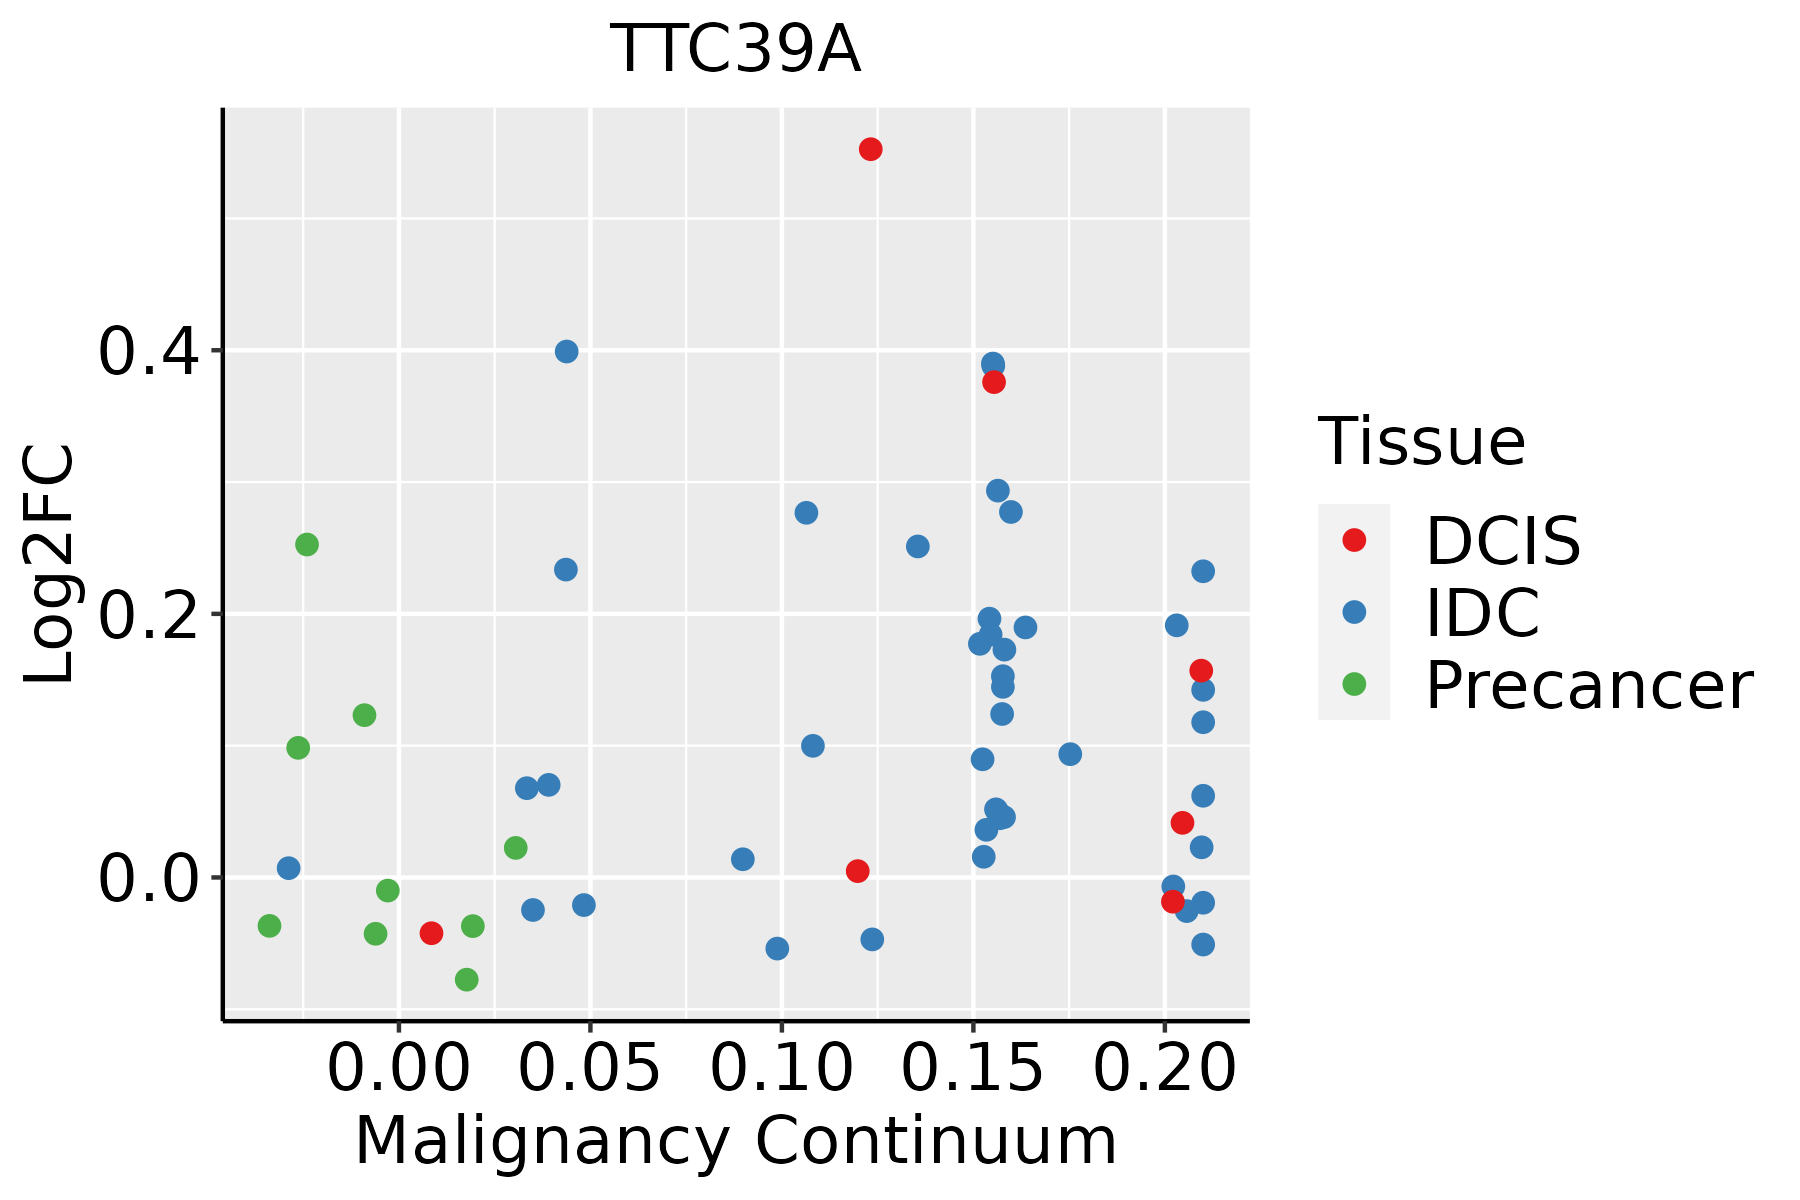 | IDC: Invasive ductal carcinoma |
| DCIS: Ductal carcinoma in situ | ||
| Precancer(BRCA1-mut): Precancerous lesion from BRCA1 mutation carriers | ||
| Colorectum (GSE201348) |  | FAP: Familial adenomatous polyposis |
| CRC: Colorectal cancer | ||
| Colorectum (HTA11) |  | AD: Adenomas |
| SER: Sessile serrated lesions | ||
| MSI-H: Microsatellite-high colorectal cancer | ||
| MSS: Microsatellite stable colorectal cancer | ||
| Esophagus | 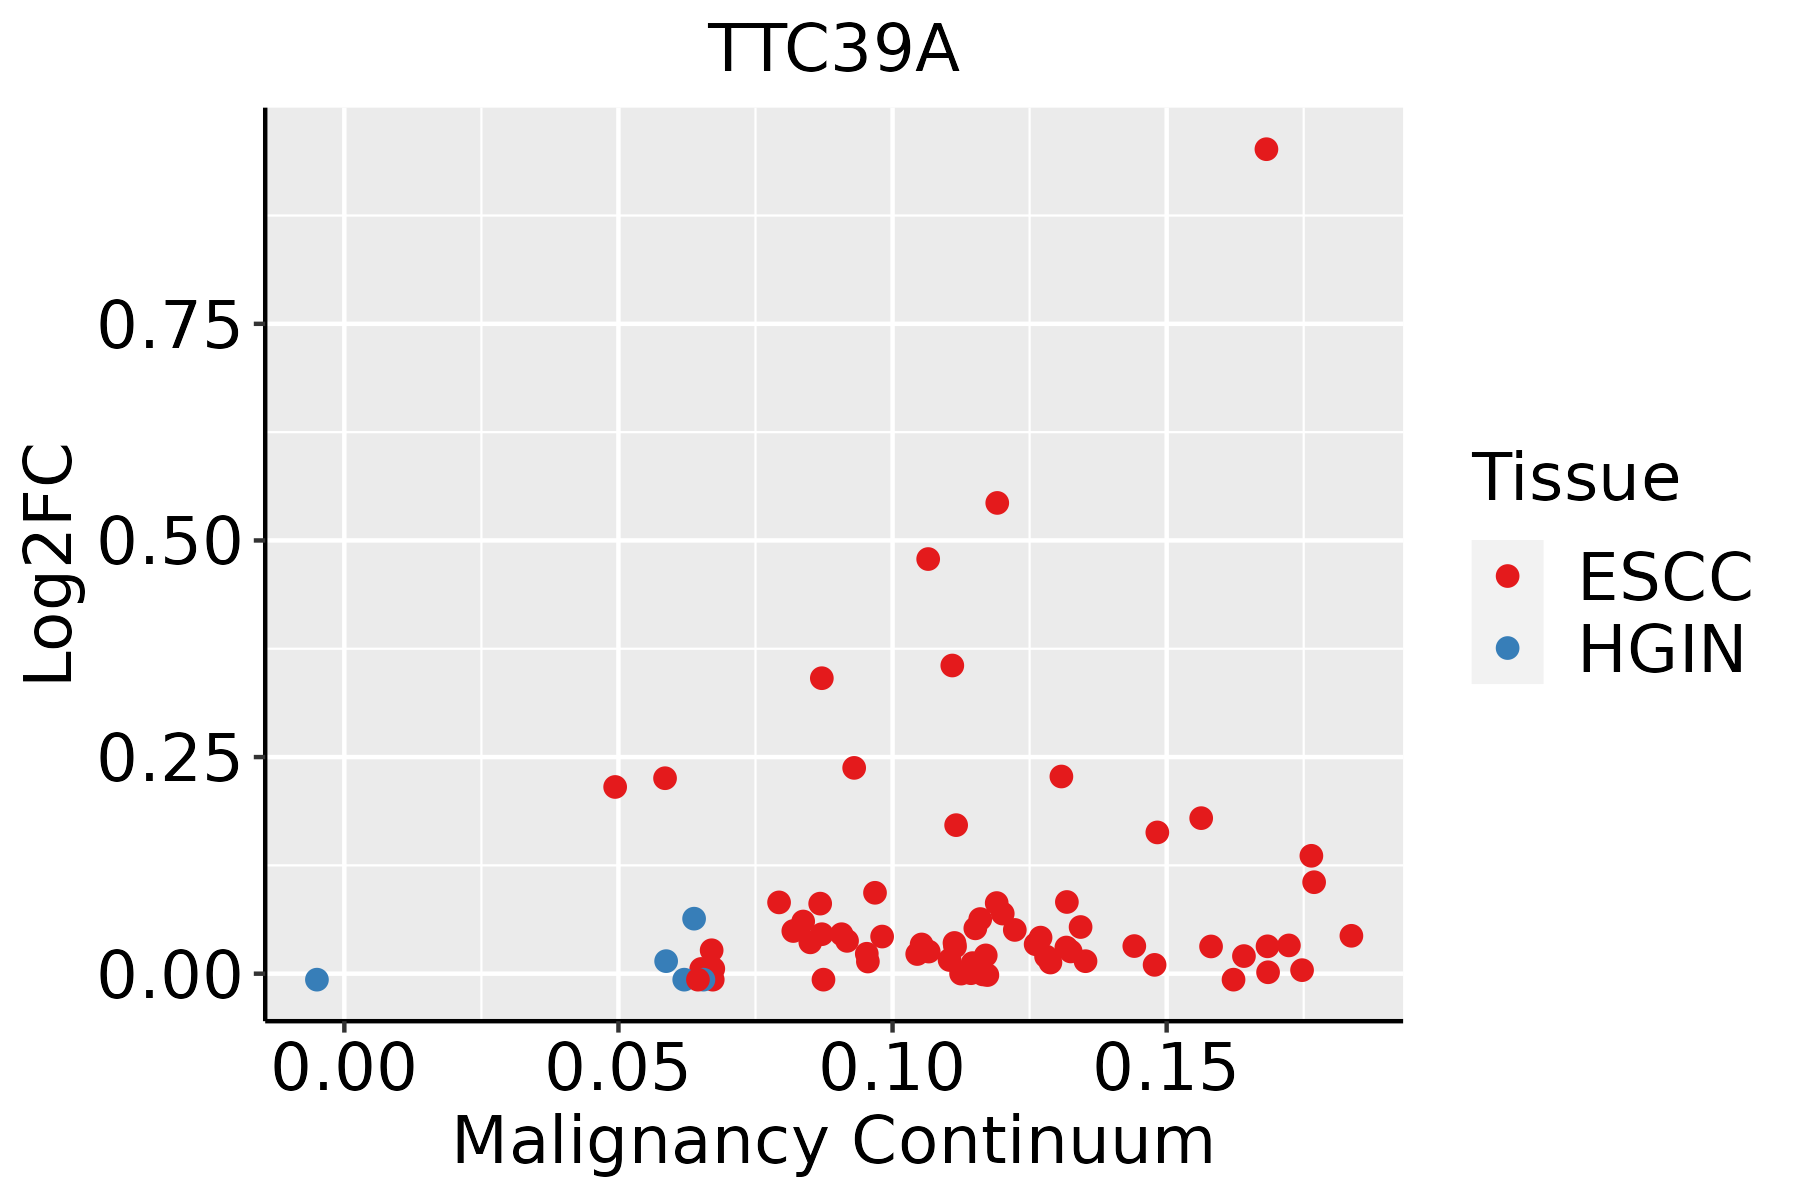 | ESCC: Esophageal squamous cell carcinoma |
| HGIN: High-grade intraepithelial neoplasias | ||
| LGIN: Low-grade intraepithelial neoplasias | ||
| Liver | 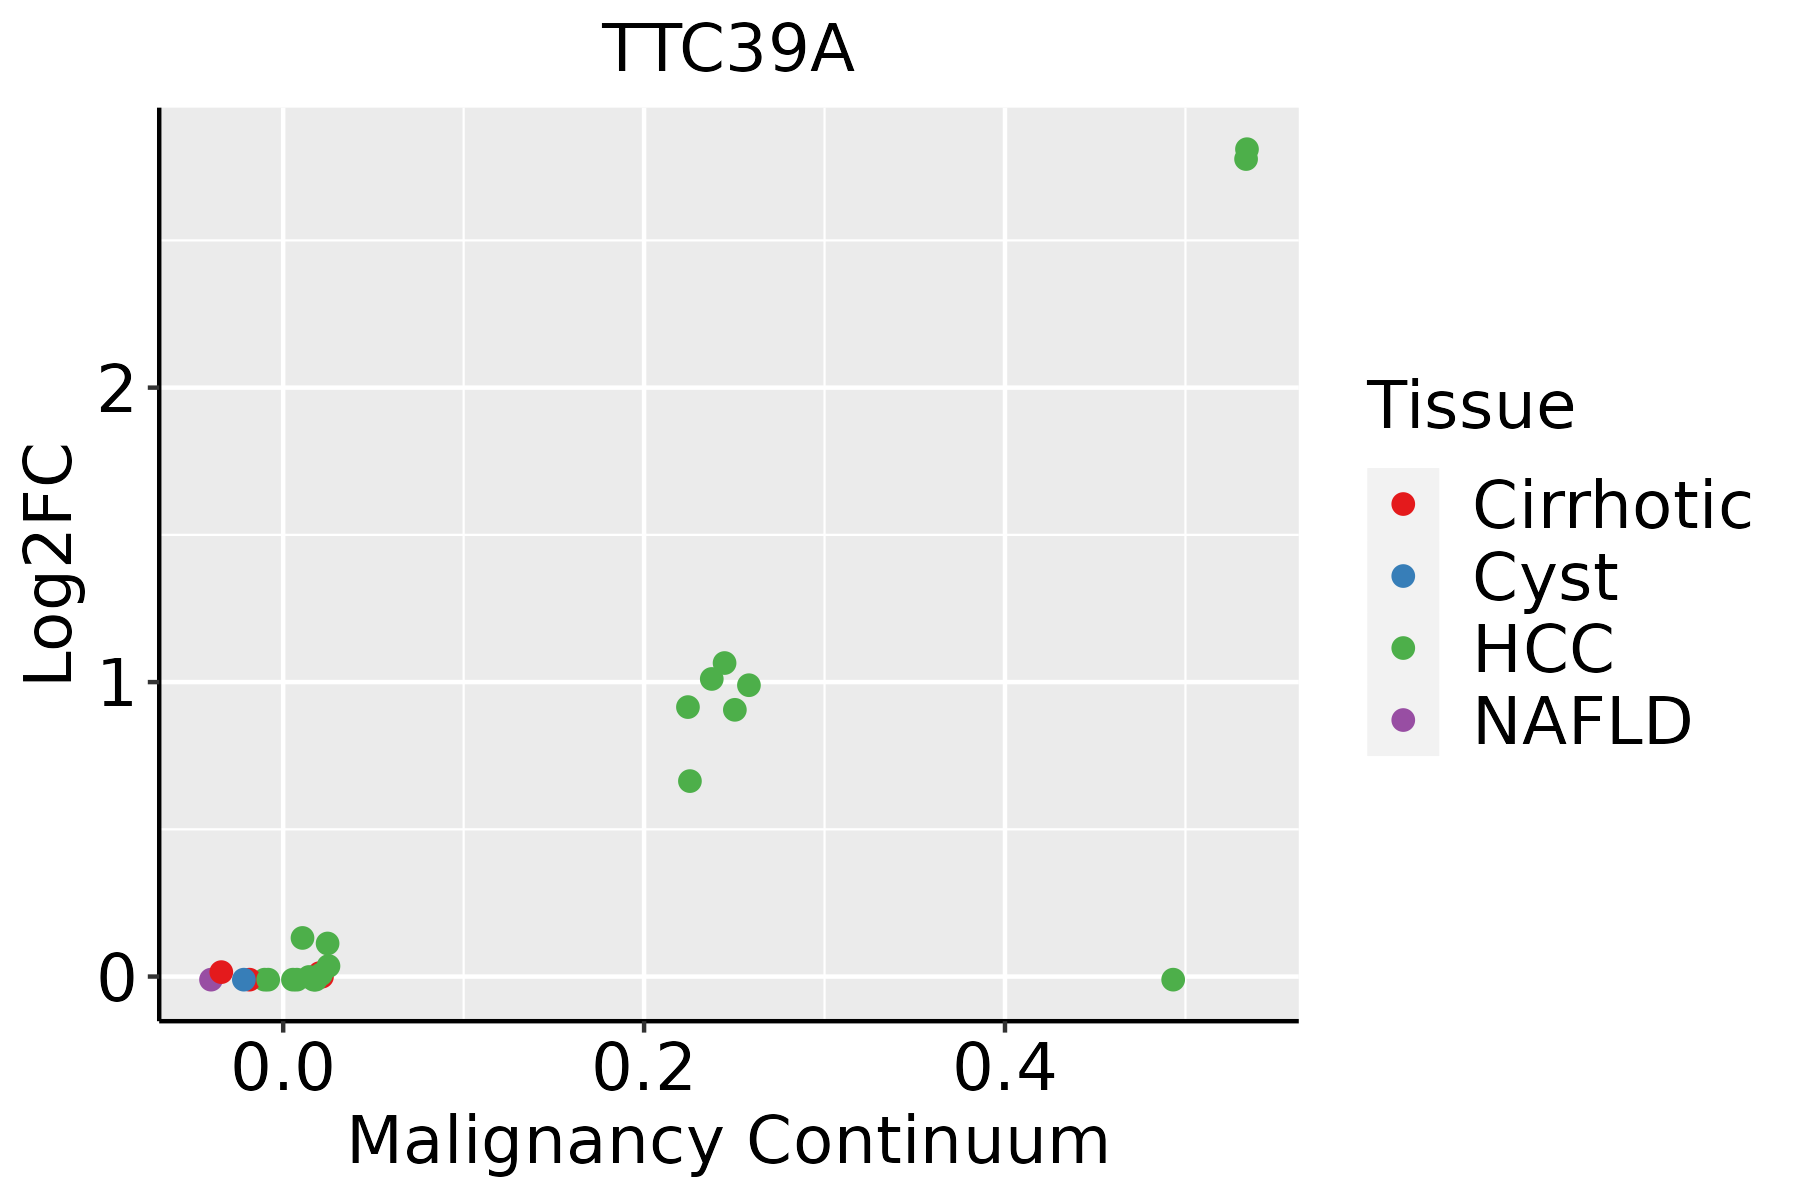 | HCC: Hepatocellular carcinoma |
| NAFLD: Non-alcoholic fatty liver disease |
| ∗log2FC in expression of this searched gene in stem-like cells from each diseased tissue sample relative to stem-like cells in normal samples in each tissue plotted against the malignancy continuum. Samples are colored based on if they are from different disease stage. |
Top |
Malignant transformation related pathway analysis |
| Find out the enriched GO biological processes and KEGG pathways involved in transition from healthy to precancer to cancer |
| Tissue | Disease Stage | Enriched GO biological Processes |
| Colorectum | AD |  |
| Colorectum | SER |  |
| Colorectum | MSS |  |
| Colorectum | MSI-H |  |
| Colorectum | FAP |  |
| ∗Top 15 enriched GO BP terms are showed in the bar plot of each disease state in each tissue. Each row represents a significant GO biological process which is colored according to the -log10(p.adjust). |
| Page: 1 2 3 4 5 6 7 8 9 |
| GO ID | Tissue | Disease Stage | Description | Gene Ratio | Bg Ratio | pvalue | p.adjust | Count |
| Page: 1 |
| Pathway ID | Tissue | Disease Stage | Description | Gene Ratio | Bg Ratio | pvalue | p.adjust | qvalue | Count |
| Page: 1 |
Top |
Cell-cell communication analysis |
| Identification of potential cell-cell interactions between two cell types and their ligand-receptor pairs for different disease states |
| Ligand | Receptor | LRpair | Pathway | Tissue | Disease Stage |
| Page: 1 |
Top |
Single-cell gene regulatory network inference analysis |
| Find out the significant the regulons (TFs) and the target genes of each regulon across cell types for different disease states |
| TF | Cell Type | Tissue | Disease Stage | Target Gene | RSS | Regulon Activity |
| ∗The dot plots of a searched regulon are shown for all cell subpopulations in each disease state of each tissue based on the regulon specific score inferred using pySCENIC and by calculating the average expression. |
| Page: 1 |
Top |
Somatic mutation of malignant transformation related genes |
| Annotation of somatic variants for genes involved in malignant transformation |
| Hugo Symbol | Variant Class | Variant Classification | dbSNP RS | HGVSc | HGVSp | HGVSp Short | SWISSPROT | BIOTYPE | SIFT | PolyPhen | Tumor Sample Barcode | Tissue | Histology | Sex | Age | Stage | Therapy Types | Drugs | Outcome |
| TTC39A | SNV | Missense_Mutation | novel | c.1658C>G | p.Ala553Gly | p.A553G | Q5SRH9 | protein_coding | tolerated(0.77) | benign(0.013) | TCGA-A1-A0SH-01 | Breast | breast invasive carcinoma | Female | <65 | I/II | Chemotherapy | tc | SD |
| TTC39A | SNV | Missense_Mutation | c.1382N>C | p.Met461Thr | p.M461T | Q5SRH9 | protein_coding | deleterious(0) | possibly_damaging(0.771) | TCGA-A8-A0A1-01 | Breast | breast invasive carcinoma | Female | >=65 | I/II | Hormone Therapy | tamoxiphen | SD | |
| TTC39A | SNV | Missense_Mutation | c.1338C>G | p.Phe446Leu | p.F446L | Q5SRH9 | protein_coding | tolerated(0.49) | benign(0.001) | TCGA-C8-A26Y-01 | Breast | breast invasive carcinoma | Female | >=65 | I/II | Unknown | Unknown | SD | |
| TTC39A | SNV | Missense_Mutation | rs774585007 | c.1171N>G | p.Ile391Val | p.I391V | Q5SRH9 | protein_coding | tolerated(1) | benign(0.006) | TCGA-D8-A1XL-01 | Breast | breast invasive carcinoma | Female | <65 | I/II | Chemotherapy | doxorubicine+cyclophosphamide+tamoxifen | SD |
| TTC39A | insertion | Frame_Shift_Ins | novel | c.239_240insAAGTGGTGTGGGT | p.Ala81SerfsTer43 | p.A81Sfs*43 | Q5SRH9 | protein_coding | TCGA-BH-A0BJ-01 | Breast | breast invasive carcinoma | Female | <65 | I/II | Chemotherapy | doxorubicin | SD | ||
| TTC39A | insertion | Nonsense_Mutation | novel | c.237_238insTGATATTTCCGTTGGTTTTGAGCTTC | p.Leu80Ter | p.L80* | Q5SRH9 | protein_coding | TCGA-BH-A0BJ-01 | Breast | breast invasive carcinoma | Female | <65 | I/II | Chemotherapy | doxorubicin | SD | ||
| TTC39A | SNV | Missense_Mutation | c.567N>G | p.Ile189Met | p.I189M | Q5SRH9 | protein_coding | tolerated(0.3) | benign(0.201) | TCGA-EK-A3GK-01 | Cervix | cervical & endocervical cancer | Female | <65 | I/II | Unknown | Unknown | SD | |
| TTC39A | SNV | Missense_Mutation | rs746175223 | c.1573N>A | p.Glu525Lys | p.E525K | Q5SRH9 | protein_coding | deleterious(0) | probably_damaging(0.922) | TCGA-VS-A8EL-01 | Cervix | cervical & endocervical cancer | Female | <65 | I/II | Chemotherapy | cisplatin | CR |
| TTC39A | SNV | Missense_Mutation | c.789G>T | p.Glu263Asp | p.E263D | Q5SRH9 | protein_coding | tolerated(0.12) | benign(0.118) | TCGA-A6-6781-01 | Colorectum | colon adenocarcinoma | Male | <65 | III/IV | Chemotherapy | oxaliplatin | SD | |
| TTC39A | SNV | Missense_Mutation | rs368894146 | c.1559G>A | p.Arg520His | p.R520H | Q5SRH9 | protein_coding | tolerated(0.32) | benign(0.009) | TCGA-AA-3864-01 | Colorectum | colon adenocarcinoma | Male | >=65 | I/II | Unknown | Unknown | SD |
| Page: 1 2 3 4 5 |
Top |
Related drugs of malignant transformation related genes |
| Identification of chemicals and drugs interact with genes involved in malignant transfromation |
| (DGIdb 4.0) |
| Entrez ID | Symbol | Category | Interaction Types | Drug Claim Name | Drug Name | PMIDs |
| Page: 1 |

Copyright 2023-Present -The University of Texas Health Science Center at Houston |